Understanding BPMN Through Defect Detection Process
Gül Tokdemir and Damla Metin
Computer Engineering Department, Cankaya University, Eskisehir Yolu 29.km, Ankara, Turkey
gtokdemir@cankaya.edu.tr, damla91@gmail.com
Keywords: BPMN, Business Process, Diagrammatic Reasoning, Defect Detection.
Abstract: BPMN (Business Process Modelling Notation) diagrams enhance the perception of the business analysts to
better understand and analyse the processes of the organizational setting and provide a common
communication medium both for business analysts and IT professionals. The changes in the business systems
require business analysts to understand the processes and improve them and IT professionals to comprehend
and implement these processes as a software system. The main aim of this study is to analyse which type of
defects can be detected in a given BPMN diagrams easily by novice users. We believe the results of this study
will provide a guide for the educators in teaching, for business analysts and IT professionals in understanding
and improving business processes.
1 INTRODUCTION
As diagrams transfer, and leverage knowledge that is
essential for solving problems, they can be more
powerful than sentential representations depending
on the usage. Diagrams provide compressed
information; hence, they are very effective in
information systems for transferring information
between stakeholders of the system.
Business process modelling emphasizes business
activities and their interaction. Their purpose may
include revealing the problems, changes in the
operational issues, improving/understanding systems.
These models are used for the communication of the
business processes between business analysts and
software developers/IT professionals. Therefore, it’s
crucial for them to be clear and coherent (Figl and
Laue, 2011)
In this study, defect detection process in BPMN
reviewing process is analysed to obtain insights about
the cognitive processes of the first-year Computer
Engineering students of Cankaya University who
have basic knowledge about computer programming.
The research question 'Which types of defects are
easy to detect in BPMN representations?' is aimed to
be answered.
We intended to answer this question through an
experiment in which participants were given a BPMN
diagram with different type of defects and they were
expected to detect these defects. With the help of the
data we collected, we believe that such analysis
would provide insights about the design of BPMN
diagrams and defect detection process. The results of
this study are expected to enlighten the researchers,
businesses, and educators to improve BPMN
cognitive process. Background section below
contains related studies found in the literature,
Methodology section explains the experiment, Result
section analyses the experiment results and
Discussion and Conclusion section talks about the
insights gained through this study.
2 BACKGROUND
The Business Process Modeling Notation (BPMN) is
an important standard for process modelling and has
enjoyed high levels of attention from academia and
business world.
There are many studies analysing suitability of
various representations’ suitability to business do-
main like UML2.0, BPMLs, BPDM, RAD, EPC and
Petri nets (Gou et al., 2000; List and Korherr, 2006).
The results state that even though these
representations provide adequate capability to
represent dynamic behavior, organizational and
informational dimensions can be partially
characterized.
Many studies have compared the diagrams’
understandability based on participants’
comprehension of the given diagrams (Birkmeier and
Overhage, 2010; Geambaşu and Jianu, 2013; Cruz-
180

Lemus et al., 2010). They have concluded the
superiority of one of the diagram’s comprehension of
the business process representations. However, none
of them mentioned which defects are more important
and easier to be comprehended by participants in
BPMN diagrams. Usually, in system development
process, business process analysis is performed
during requirements elicitation phase. As a results,
analysts and developers use different visual
representations to incorporate information they grasp
for the design and development of software artefacts.
During this process, they also compare diagrams with
textual requirements to reveal discrepancies or
incomplete information (Hungerford, 2004). It is
important to detect and correct mistakes at the design
stage of the system development. Given that; there are
also defect types which cannot be detected in the
runtime (von Stackelberg et al., 2014). With this
research we aim to find out which types of defects are
easier to detect by novice users from IT field.
In the literature, there are not many studies
conducted to better understand the reviewers’
performance during the defect detection process in
BPMN models. For instance, Moser and Biffl report
that the missing or incorrect type of information is
often detected in a later engineering process step
(Moser and Biffl, 2010). Hence understanding the
defect types that cannot be detected easily could help
the software system designers to better represent this
type of information in their models. Additionally, this
information also can be used to better guide the
reviewers in different phases of software
development process accordingly.
3 METHOD
We have performed an experiment to observe and
collect data for defect detection process of novice
participants. The experimental study was conducted
with 6 participants using a study material which was
derived from the study of Geambaşu and Jianu, which
is adapted to the current settings of this study and
translated into Turkish (Geambaşu and Jianu, 2013).
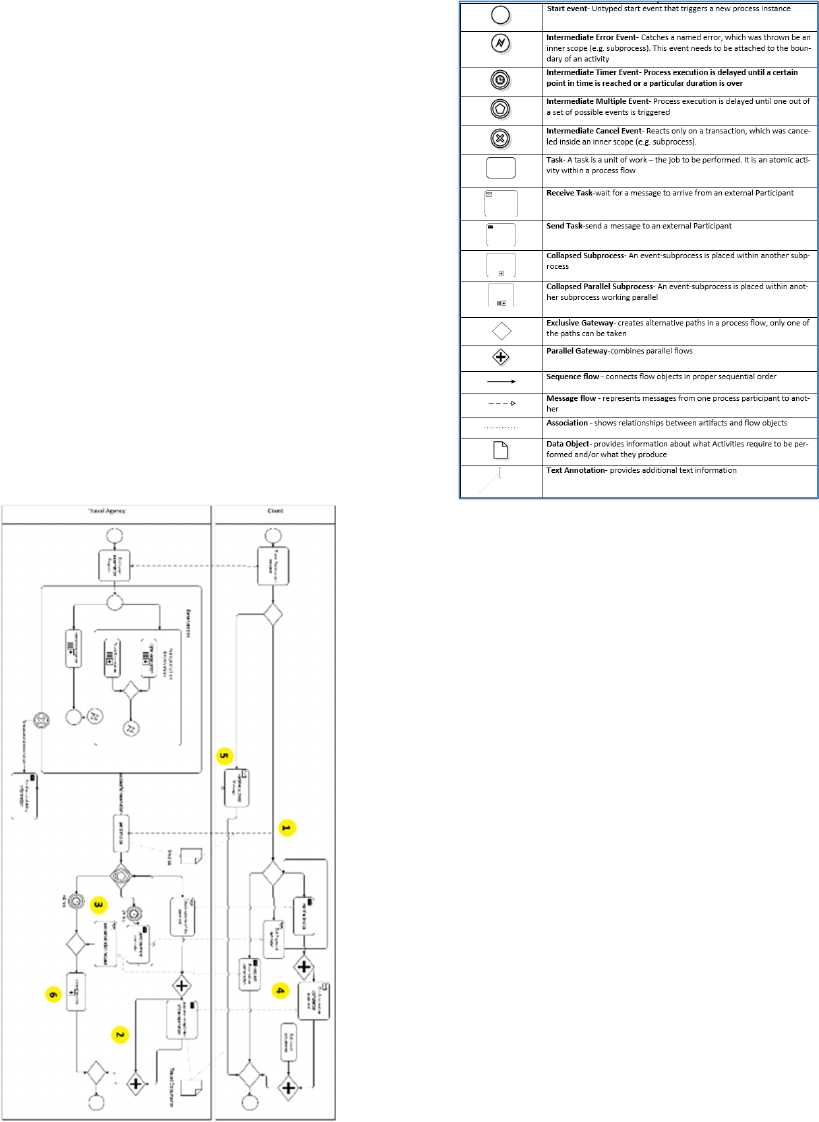
Moreover, they were provided with the description of
the symbols that would be used in the diagrammatic
representation. Participants of this study were first
year students of Computer Engineering Department
of Cankaya University. The inspection against a
requirements document is called vertical reading
technique (Travassos et al., 1999) which aims to
reveal omission, incorrect, inconsistent type of
defects which can be applied to all documents in any
of the software development stage whenever the
necessary documents are available.
We have prepared a scenario about package
holiday booking process of a travel agency.
According to this scenario 6 defects seeded into the
BPMN diagram of the system. The participants have
been provided the process description one week
before the experiment. During the experiment,
participants were asked to find the defects seeded into
the BPMN diagram, based on the scenario
description.
The defects are categorized into three types:
Missing Task (MT), Missing Dataflow or information
(MD), incorrect or missing Information (I). Table 1
summarizes the number of defects according to each
category defined here.
Table 1: Number of Defects in Each Category.
Code Description # of Defects
MT Missing Task 2
MD Missing Dataflow/information 2
I Incorrect/ Incomplete 2
Total 6
Table 2 depicts the defects seeded into the BPMN
with their defect types. Figure 1 shows the locations
of the defects.
Table 2: Defect Explanations.
Defect Description
Defect
Type
01 “Receive invoice” is missing MT
02 “Send travel requests” is missing MT
03
Data flow to “receive cancel request” is
missing
MD
04
Data flow to receive travel documents
is missing
MD
05
Instead of “receive unavailability
notice”, “receive success message”
I
06
Instead of “cancel bookings” , “cancel
invoice”
I
In Figure 1, there are several tasks performed by
a customer or travel agency. These processes define
the top-level diagram of package holiday booking
process of a travel agency. The tasks connected to
each other through data flows. Moreover, data is
accumulated in data stores called customer ac-count,
work order/proposal and personnel.
Understanding BPMN Through Defect Detection Process
181
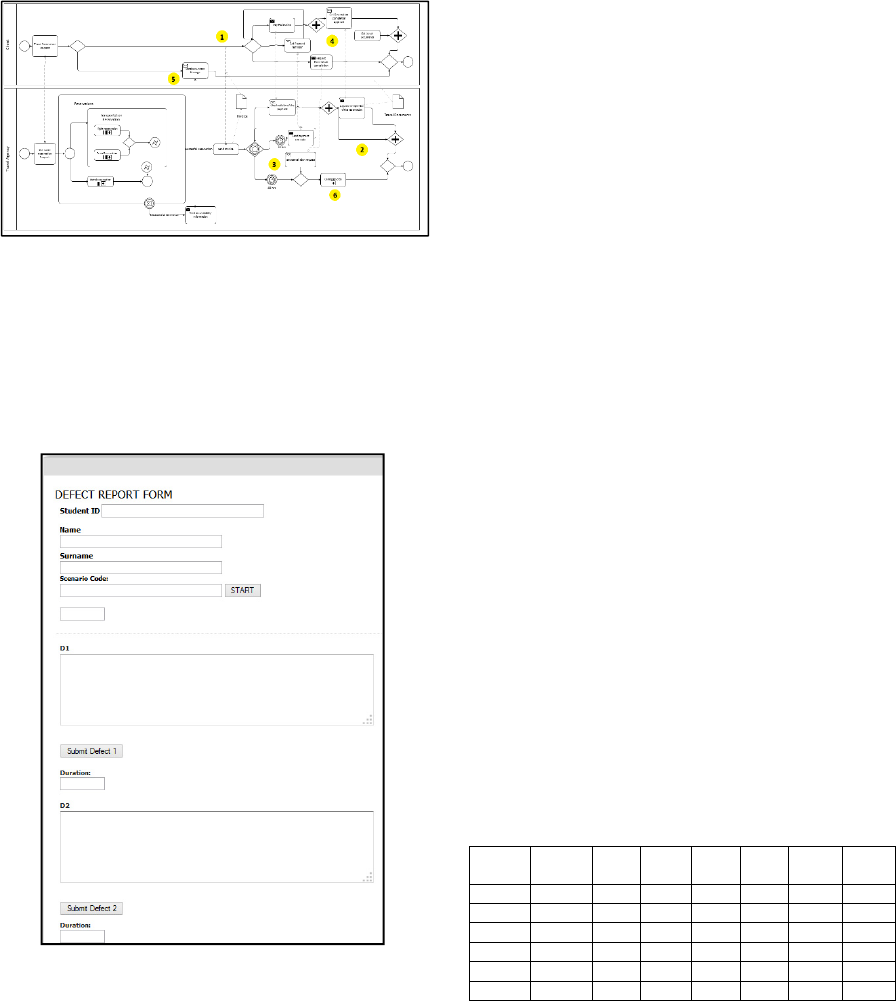
Figure 1: Defects’ Placements in BPMN.
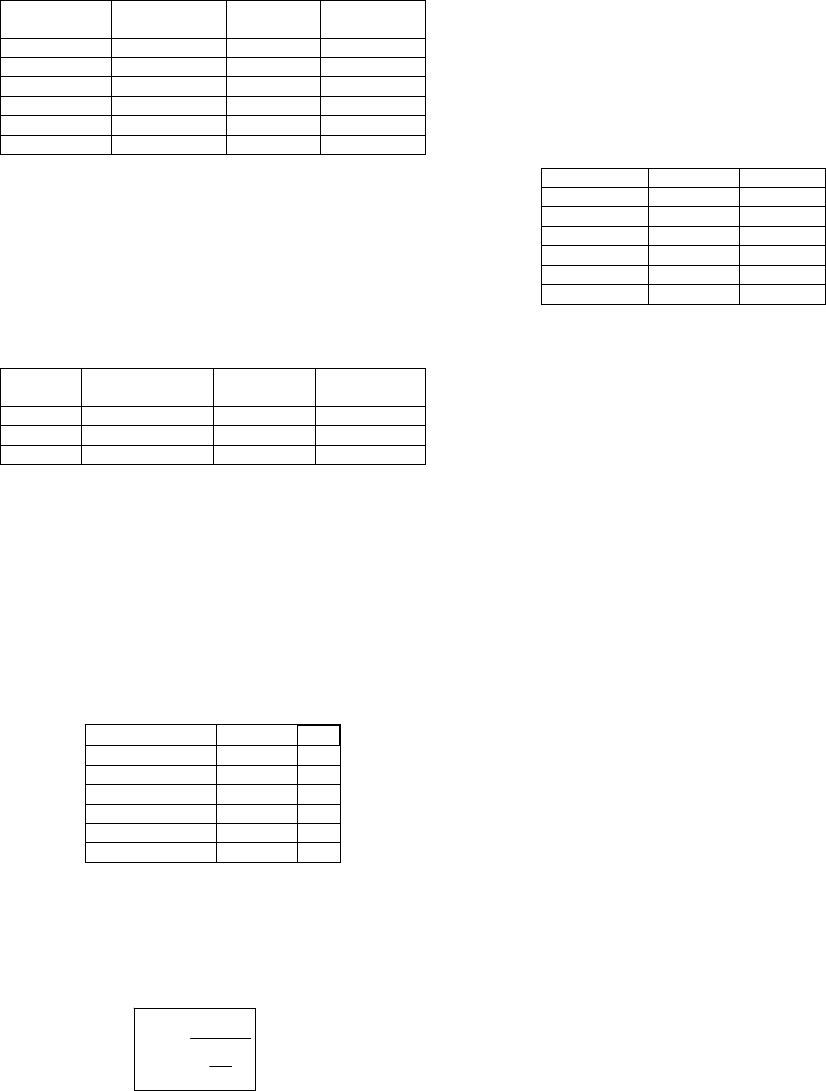
The participants were asked to detect the defects
by comparing it with the scenario provided to them.
In order to note the defects they found, they were
asked to use a web-based tool to record the time at
which they noticed the defect and its explanation
(Figure 2).
Figure 2: Defect Collection Tool.
In this study, data is collected through defect
collection tool by the reviewers, questionnaire and
semi-structured interview sessions conducted by each
reviewer. The defect detection report generated by the
tool includes the defect number, explanation for the
defects found and the time of the defect notice. By
using this form, the reviewers were asked to note each
defect that they detect and describe their opinions
about this defect as explained in the explanation
document provided in Appendix A. The observations
were conducted by one researcher and observation
notes were taken during each reviewer’s defect
detection process. Additionally, questionnaire and a
semi-structured interview session was conducted by
each reviewer individually. The semi-structured
interview questions were formed as below:
1. Which types of defects were easier to detect?
2. Which defects were harder to detect?
3. Which factors do you think helped you to detect the
defects easily?
4. Which factors do you think make it hard to detect
the defects?
Since the main research question of this study is based
on the defects, the results of this study based on 36
cases (6 x 6). Additionally, this study aims to focus
on the behaviours of the participants in order to
uncover the complexity of human behaviour in such
a framework and present a holistic interpretation of
what is happening during the review process. Nielsen
and Landauer also report that studying with four or
five subjects is enough to understand and explain
more than 80% of the phenomena (Nielsen and
Landauer, 1993). Accordingly, in this study, the
participants’ behaviours are analysed in depth from
different dimensions. In the following section, the
results of the defect detection process are provided.
4 RESULTS
Table 3 shows the duration in seconds that each
participant (DPij) spent during each defect detection
process.
Table 3: Defect Detection Duration Data.
Defect
Type
Defect
(Di)
Dp1i Dp2i Dp3j Dp4i Dp5i Dp6i
MD 3 1500
MT 1 780 720
MD 4 480 660 1140 60
MT 2 420 420 300
I 6 240
I 5 240 180 240
As an example, in this table, Dp1 is calculated
from the defect collection tool which shows the
duration in seconds that the participant p1 spend time
for detecting the defect i (Di). It is the duration
starting from the time point of last defect detection
process until the defect detection of Di. ADi in Table
4 is the average of the durations spent by each
participant to detect defect i (Di). Among the detected
defects, type I defects were detected in relatively less
time (D
5
, D
6
). Similarly, the participants spent more
Seventh International Symposium on Business Modeling and Software Design
182
time for detecting defects of type MD (D
3
) and only
one participant could be able to detect MD type defect
D
3
.
Table 4: Defect Detection Duration Average.
Defect Type
Defect
(Di)
ADi
Frequency of
Di
MD 3 1500 1
MT 1 750 2
MD 4 585 4
MT 2 380 3
I 6 240 1
I 5 220 3
We have analysed this data according to the defect
types, as shown in Table 4. Accordingly, the detection
rate for missing Information (I) type of defects is
calculated as 4/12=0.33. Defects of type MT were
detected mostly; on the other hand, the defects of type
MD were detected seldom.
Table 5: Detected Defect Type.
Defect
Type
Total Possibilities
Total
Detected
Detection Rate
MD 12 5 0.42
MT 12 5 0.42
I 12 4 0.33
The detection frequency Fi of defects is shown in
Table 5. In this table, Fi represents the frequency of a
detected defect by participants. Its value is calculated
by adding 1 point for each defect’s detection for
defect i (Di). For example, if the defect is detected by
only one participant this value is 1, if it is detected by
three participants the Fi value for that defect is
calculated as 3.
Table 6: Defect Frequency F
i
.
Defect Type Defec
t
F
i
MD 4 4
MT 2 3
I 5 3
MT 1 2
MD 3 1
I 6 1
Based on the defect detection average duration
and order, we have calculated defect difficulty using
formula derived by Cagiltay et al. (2011). Difficulty
of a defect means how much a participant spend effort
to find it in terms of time to find and order to find it.
(1)
where,
DF
j
: Defect detection difficulty level of the j
th
defect
D
j
: Average duration spent by all participants for finding
defect j
O
j
: Average score of all participants for detecting j
th
defect
R
j
: Number of people who detected defect j
m: Total number of participants
The average frequency of defect detection according
to the defect types are given in Table 7. As seen from
this table, MD type defect D
3
was the most difficult
defect in the diagram found by 1 participant.
Table 7: Defect Difficulty Levels.
Defect Type Defec
t
DF
j
MD 3 9000.0
MT 1 3375
MT 2 2026.7
MD 4 1462.5
I 6 1440.0
I 5 733.3
According to Table 7, MD type defects were the
most difficult ones whereas I type defects were the
easiest defects. 4 of the participants stated that they
have followed the scenario to detect the defects which
made it easier to find them. 5 of the participants think
that the modelling language was complicated for
them which made defect detection process difficult.
5 DISCUSSION AND
CONCLUSION
In this study, an experiment is conducted to analyse
defect detection performance of novice users in
reviewing BPMN diagrams. During the experiment,
we had provided materials to the participants, one
week before the experiment (Appendix A) and
requested to find defects on BPMN diagrams
compared to the explanations given. The defects they
have found recorded through a defect collection tool.
The results of this study show that, missing
information type defects (MP and MD) are harder to
detect than the incomplete or incorrect type (I) of
defects. Hence the defect detection frequency of
defects in average is higher for type I defects (2.67)
than that of type MP (2.00) and type MD (1.20)
defects. Similarly, the detection rate of type I defects
(0.67) is higher than that of type MP (0.50) and type
MD (0.70) defects.
In this study we used a business process to study
the defect detection process. Hence, there is a threat
to the validity of the findings in that the study results
could be a specific to the nature of the process or the
type of the defects that were seeded. A future study
m
R
OD
DF
j
jj
j
•
=
Understanding BPMN Through Defect Detection Process
183
would focus on several processes to be able to
generalize the results.
According to the results, the business process
designers may reconsider their designs especially for
the defects of type missing dataflow, which are harder
to be detected in the future and may increase the cost
of the projects. We believe that further analysis of the
BPMN defect detection process is expected to
provide more insights to the researchers, businesses,
and to the educators to improve BPMN cognitive
process.
REFERENCES
Figl, K., Laue, R., 2011. Cognitive complexity in business
process modeling. In International Conference on
Advanced Information Systems Engineering (pp.452-
466).
Gou, H., Huang, B., Liu, W., Ren, S., and Li, Y., 2000.
Petri-net-based business process modeling for virtual
enterprises Systems. IEEE International Conference on
Man, and Cybernetics, 2000, vol. 5, pp 3183 – 3188.
List, B., Korherr, B., 2006. An evaluation of conceptual
business process modelling languages. Proceedings of
the 2006 ACM symposium on Applied computing, SAC
'06, pp1532–1539.
Birkmeier, D., Overhage, S., 2010. Is BPMN really first
choice in joint architecture development? an empirical
study on the usability of BPMN and UML activity
diagrams for business users. In International
Conference on the Quality of Software Architectures,
pp. 119-134.
Geambaşu, C. V., Jianu, I., 2013. Evaluation of BPMN
capacity of being readily understandable by business
people. AMIS 2013, pp. 474.
Travassos, G.H., Shull, F., Fredericks, M., Basili, V.R.,
1999. Detecting defects in object-oriented designs:
using reading techniques to increase software quality.
In the Proceedings of the 14th ACM SIGPLAN
Conference on Object-oriented Programming, Systems,
Languages, and Applications (OOPSLA), Denver,
Colorado, United States.
Cruz-Lemus, J. A., Maes, A., Genero, M., Poels, G.,
Piattini, M., 2010. The impact of structural complexity
on the understandability of UML statechart
diagrams. Information Sciences, 180(11), 2209-2220.
Hungerford, B.C., Hevner, A.R., Collins, R.W., 2004.
Reviewing software diagrams: a cognitive study, IEEE
Transactions on Software Engineering, vol. 30, no. 2,
pp. 82-96.
von Stackelberg, S., Putze, S., Mülle, J., Böhm, K., 2014.
Detecting data-flow errors in BPMN 2.0. Open Journal
of Information Systems (OJIS), 1(2), 1-19.
Moser, T., Biffl, S., 2010. Semantic tool interoperability for
engineering manufacturing systems. In IEEE
Conference on Emerging Technologies and Factory
Automation (ETFA), pp. 1-8.
Nielsen, J., Landauer, T. K., 1993. A mathematical model
of the finding of usability problems. In Proceedings of
the INTERACT'93 and CHI'93 conference on Human
factors in computing systems, pp. 206-213, ACM.
Cagiltay, N., Tokdemir, G., Kilic, O., Topalli D., 2013.
Performing and Analyzing non-Formal Inspections of
ERD, Journal of Systems and Software, Volume 86
Issue 8.
APPENDIX A- SCENARIO
In This Experiment;
You are required to find the defects in the diagram,
according to the description given below. Defects
could be Missing Process (MP), Missing
Dataflow/Data (MD) or Incorrect Definition /Data (I).
Travel Reservation Scenario
Travel Agency (TA) makes travel reservation based
on the customer requests. TA receives a travel
reservation request from a Client including airline
transportation and hotel reservation. The request is
examined; transportation and hotel availability is
checked, reservation is made and accordingly an
invoice is created. If reservation is not possible, the
Client is informed correspondingly.
Client can make the payment upon reception of the
invoice or can request reservation cancellation. If the
payment is performed, TA checks the validity of the
payment and a confirmation of the reservation
message is sent to the customer with travel
documents. If Client requests cancellation, TA
cancels the reservation.
If Client does not make the payment, 24 hrs after the
reception of the bill, a payment reminder is sent.
Client can make the payment or cancel the reservation
after this reminder.
If Client does not make the payment in 48 hrs after
the reception of the bill, TA cancels the reservation.
Questionnaire
Open-Ended Questions
1. Which factors made you find the defects easily?
2. Which factors made it difficult to find the defects?
3. The easiest defect I found is:
What is the reason?
4. The most difficult defect I found is:
What is the reason?
5. During defect detection process, which strategy
have you followed?
6. While working with the diagram, did you follow
any defect order of your choice or the system has
forced you to follow a certain order?
Seventh International Symposium on Business Modeling and Software Design
184
7. Which diagram element is easier to understand?
8. Which diagram element is more difficult to
understand?
9. Which effect type was easier to find? Missing
Process (MP), Missing Dataflow/Data (MD) or
Incorrect Definition /Data (I)
10. Which effect type was more difficult to find?
Missing Process (MP), Missing Dataflow/Data
(MD) or Incorrect Definition /Data (I)
Lickert Scale (5-level) Questions
1. I understand this modelling language well
2. This modelling language is difficult
3. Diagram is complicated
4. Understanding the relationship between Client
and Travel Agency is easy
5. The scenario description is compatible with the
diagram
6. I understand modelling languages like ER, UML,
DFD well
7. Modelling language concept is difficult for me
BPMN DIAGRAM DEFECTS
BPMN Symbols
Understanding BPMN Through Defect Detection Process
185
