
Exploring Mediatoil Imagery: A Content-based Approach
Sahil Saroop
1
, Herna L. Viktor
1
, Patrick McCurdy
2
and Eric Paquet
1,3
1
School of Electrical Engineering and Computer Science, University of Ottawa, Ottawa, Ontario, Canada
2
Department of Communications, University of Ottawa, Ontario, Canada
3
National Research Council, Ontario, Canada
Keywords: Content-based Retrieval, Multimedia Data Mining, Bitumen Sands, Multi-domain Classification, Class
Imbalance.
Abstract: Debates over Canada’s energy future with its oil sands has become a flashpoint of public interest.
Stakeholders have identified advantages, such as economic benefit and global energy demand, and
drawbacks, notably environmental and social challenges. This research focuses on discovering how various
organizations employ graphics, images and videos in the media, in order to further our understanding of the
context and evolution of the oil sands discourse, since the late 1960s. To this end, we created the open-
source Mediatoil database contains images from six categories of imagery, namely graphics, machines,
people, landscape, protest and open-pit. We further created the Mediatoil-IR content-based image retrieval
system that utilizes SURF descriptors and bags of features. We illustrate how the Mediatoil-IR system was
used in order to explore and to contrast the imagery used by the various stakeholders, within a multi-class
learning setting. Our experimental results show that dividing the images into sub-categories is beneficial for
retrieval and classification.
1 INTRODUCTION
The size of digital image repositories continue to
expand, with the development of the Internet,
reduction in data-storage costs, and improvements in
technologies for image-capturing devices (e.g.,
digital cameras and image scanners, amongst
others). To deal with the high volume of pictures,
users require dynamic image searching and retrieval
tools.
Content-based Information Retrieval (CBIR)
systems, which build image descriptors, have had
much success when retrieving sets of images that are
similar (Liu et al., 2007). In addition, machine
learning has long been used in conjunction with
image retrieval systems. It has improved the quality
of retrieval, both in terms of accuracy and precision,
by either grouping images into different categories
or classifying a given image based on its unique
attributes while predicting its relevant class (Sridhar
et al., 2015). Furthermore, CBIR combined with
machine learning, have been used in different
applications related to query and image analysis (Liu
et al., 2007). The application domains of these
systems include remote sensing, history, fashion,
security, crime prevention, biodiversity information
systems, publishing, art collections, retail
catalogues, medical information retrieval, face
finding, as well as architectural and engineering
design.
Despite the many CBIR application areas, one
field that is still unexplored is the contested media
framing of Canada’s oil sands. Our research targets
this application area. Specifically, we explore how
pictures related to Canada’s oil sands, as obtained
from various stakeholders, may vary in content. This
analysis provides us with new insights into how
pictures are used to frame arguments and
viewpoints. We are further interested in contrasting
different categories of imagery, in order to provide
all role-players with an accurate retrieval system. To
this end, we developed the Mediatoil-IR system that
combines CBIR techniques and machine learning.
This paper is organized as follows. Section 2
contains a description of the Mediatoil project. This
is followed by Section 3, which introduces the
Mediatoil-IR system. In Section 4, the experimental
setup is presented and we discuss the results we
obtained. Finally, Section 5 concludes the paper and
discusses our future plans.
Saroop S., Viktor H., McCurdy P. and Paquet E.
Exploring Mediatoil Imager y: A Content-based Approach.
DOI: 10.5220/0006502702460254
In Proceedings of the 9th International Joint Conference on Knowledge Discovery, Knowledge Engineering and Knowledge Management (KDIR 2017), pages 246-254
ISBN: 978-989-758-271-4
Copyright
c
2017 by SCITEPRESS – Science and Technology Publications, Lda. All rights reserved

2 Mediatoil PROJECT
Campaigns and debates over Canada’s energy future
with its oil sands have become a flashpoint for
political action. Stakeholders driving the discussions
may be divided into three broad groups, namely civil
society, industry, and government (McCurdy, 2017).
By publishing reports, creating still advertisements,
and posting videos, oil sands stakeholders seek to
influence how the public perceives oil sands
development and ultimately the fate of this natural
resource (McCurdy, 2017).
Opponents and supporters continue to debate
advantages and drawbacks regarding the exploration
of the oil sands (Brant, 1962) (Dyer et al., 2017). On
the positive side, supporters see the oil sands as a
resource that can meet the growing global demand
for energy (Dyer et al., 2017). The machinery and
other goods required in oil sands production are
produced in Central and Eastern Canada, which
provides economic benefits to various sectors. Oil
sands development also provides economic benefits
to Canada by creating jobs and generating taxable
revenue. Despite their numerous benefits, the tar
sands also pose environmental and social challenges.
The synthetic crude derived from bitumen is more
carbon-intensive than the one obtained utilizing
conventional methods. Moreover, processing
bitumen requires using massive amounts of water,
which may come from fresh water sources and that
can lead to contamination. Land disturbance and use
are additional concerns and restoring boreal forests
and wetlands to their native state is also a major
challenge (Dyer et al., 2017).
Given an assumption that media can be a quite
powerful tool for impacting audience opinions on
the oil sands development, different visuals used by
the various stakeholders need to be explored.
Despite numerous application areas of CBIR
systems, the domain of oil sands campaigns and
their images is still unexplored. While multiple
accounts exist, reviewing the tar sand’s history
reveals that little work has been done on the media
debates (McCurdy, 2017). To this end, we are
interested in discovering how the struggle over
Alberta’s oil sands has played out in the reports,
publications, and campaigns of different tar sands
role-players. We pay particular attention to the
graphics and images produced by various
organizations, as they are vital resources in any
media and thus critical for understanding the
context, evolution, and essential characteristics of
the oil sands (McCurdy, 2017).
No central repository of tar sands images is
available in the literature. To accomplish our
objective of analysing oil sands images, we thus
designed and implemented the Mediatoil database,
which is publicly available at www.mediatoil.ca.
This database contains imagery collected from 99
different stakeholders. We collected reports,
photographs, still advertisements, fact-sheets, and
videos, spanning a period from 1924 to date. The
results reported here concerns images that were
collected until October 2016.
Next, we discuss the design of the Mediatoil-IR
system, designed to explore this open source of
imagery about the oil sands.
3 Mediatoil-IR SYSTEM
In the Mediatoil-IR system, the colours associated
with our images are represented in the Lab colour
space (Tomasi and Manduchi, 1998). There are
many reasons for this choice. The gamut of the Lab
colour space, that is the subset of colours that may
be represented, surpasses the gamut of most other
colour spaces. In addition, the Lab space is device
independent and constitutes a good approximation of
the human visual system especially for lightness
perception.
Our image description is based on the Speeded
Up Robust Features (SURF) algorithm (Bay et al.,
2006), an extension of the Scale-Invariant Feature
Transform (SIFT) approach (Lowe, 1999). The
SURF method consists of three parts: detection of
points of interest, description of their local
neighbourhood and matching. SURF uses box filters
in order to approximate Gaussian smoothing. An
improved computational efficiency is achieved by
using integral images, as it required only four
additions in order to evaluate the sum of the
intensities in a rectangular region of arbitrary size.
SURF is a blob or region detection algorithm. The
detection of the points of interest is based on the
Hessian matrix. The latter is a measure of change in
the neighbourhood of a point. The Hessian at point
(
)
,xy
and scale s is given by
()
()()
()()
,; ,;
,;
,; ,;
xx xy
yx yy
Lxy Lxy
Hxy
Lxy Lxy
ss
s
ss
é
ù
ê
ú
=
ê
ú
ê
ú
ë
û
(1)
where, for instance, the term
()
,;
xx
Lxys
refers to
the convolution of the second-order derivative of a
Gaussian of standard deviation
s with an image
I
at point
(
)
,xy
.
As mentioned earlier, the Gaussian derivatives
are approximated with box filters. In order to obtain
scale invariance, the Hessian is evaluated at various
scales corresponding to octaves of the smallest scale.
These in turn correspond to
99,´ 15 15,´
21 21,´
27 27,´
… box filters. The interest points are
associated to the maxima of the determinant of the
Hessian matrix both in space and in scale. Since the
scale varies considerably in between octaves, the
maxima of the Hessian matrix are interpolated with
a quadratic interpolation technique.
In order to achieve rotation invariance, the Haar
wavelet (Chen and Hsiao, 1997) coefficients are
evaluated for each point of interest, both in the
horizontal and vertical direction, within a
neighbourhood spanning six times the scale of
interest. The Haar wavelet coefficients are weighted
by a Gaussian distribution. The orientation vector of
the neighbourhood is evaluated from the horizontal-
vertical Haar coefficients graph. Then, a square
region, centered on the point of interest and oriented
according to the orientation vector, is extracted. This
region is rotation invariant.
The rotation invariant region is further divided
into
44´
sub-regions for which the Haar wavelets
coefficients are evaluated. These coefficients are
weighted by a Gaussian in order to improve the
robustness against noise and deformations. The set
of all weighted Haar coefficients for every point of
interest constitute the image descriptor. The number
of points of interest is typically 2000 to 4000 and the
number of Haar coefficients, for a given point of
interest, is 64. The set of all Haar coefficients
associated with a particular point of interest is called
a feature. We do not use the SURF descriptors
directly. Rather, we construct a bag of visual words
(Zhang et al., 2010). These words are obtained by
clustering all the Haar features with the k-means
algorithm (Likas et al., 2003). The words correspond
to the centres of the clusters. The set of all visual
words constitute a dictionary. In order to express a
particular SURF descriptor in terms of the
dictionary, the closest (in term of Euclidean
distance) word associated to each Haar feature is
determined. Subsequently, a histogram representing
the distribution (frequency of occurrence) of the
words associated with the descriptor is created.
These histograms constitute the bag of word
descriptors which are used for classification and
retrieval.
Given an unknown histogram, the corresponding
unknown class is determined by using a
classification algorithm. A number of classifiers
were first trained with the training set and then
evaluated with the test set. Once the class of an
unknown histogram has been determined by a
particular classifier, the most similar
N
results are
retrieved. This is achieved by calculating the
Euclidean distance in between the query histogram
for which the class has been determined and all
known histograms belonging to the same class. The
first
N
best results are then displayed to the user.
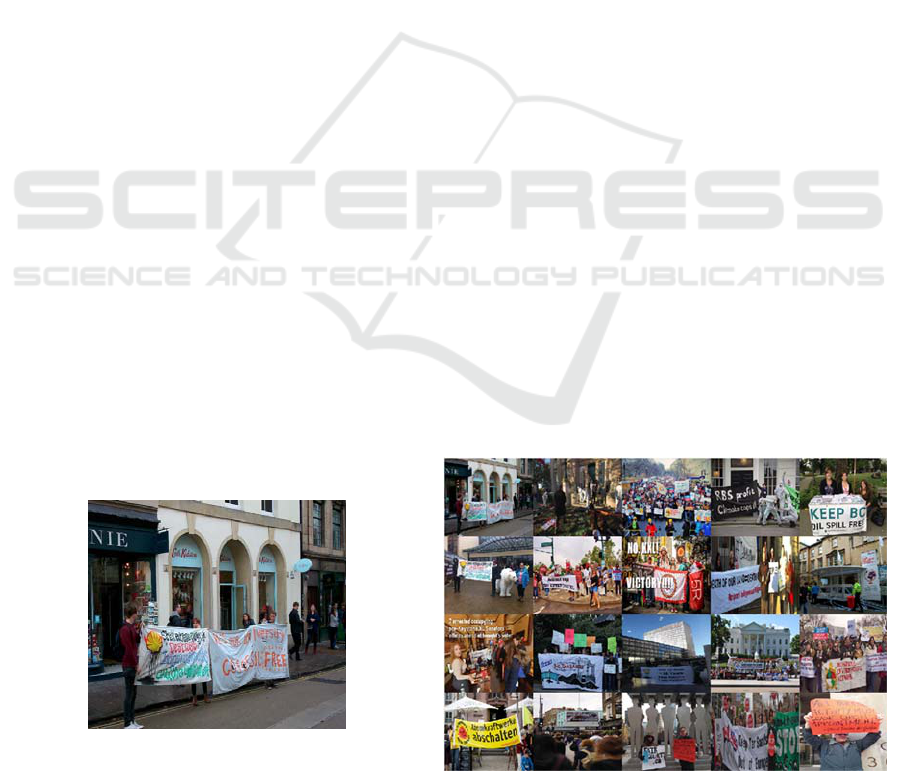
Figure 1 shows an example where N was set to
twenty and where the query image comes from the
protest category. In this case, our algorithm correctly
predicted the class and subsequently retrieved the
nearest twenty images, all belonging to the Protest
category.
4 EXPERIMENTATION
The Mediatoil website was developed in Visual
Studio 2015 with C#, Razor, and Bootstrap
frameworks for the front-end, with SQL Server 2014
as a back-end. Creating a website was necessary not
(a) Query Image
(b) First 20 images retrieved
Figure 1: Illustration of Mediatoil-IR system against the Protest category.

only to support our study but also to make our
information available to researchers investigating
bituminous sands. The classification experiments
were conducted using Matlab 2016 on a 64-bit
architecture running Windows 7 with 16 GB of
memory. Note that the six categories of images
namely graphics, machines, people, landscape,
protest and open-pit were initially labelled by a
domain expert. These categories where determined
by experts in media studies. The search process
returns the indexes for all of the pictures that match
the query image’s visual words, ranked from best
(nearest) to worst. The maximum number of
retrieved images was set to 20, as determined after
consultation with our domain experts.
4.1 Exploring Stakeholder Imagery
The Stakeholders in the Mediatoil database may be
divided into six categories, namely Aboriginal
Peoples, Civil Society: Pro-Oil Sands, Civil Society:
Anti-Oil Sands, Industry, Provincial Government,
and Federal Government. (Note that the Aboriginal
Peoples category contained only 15 documents, and
our analysis suggests that all of the images from this
category were against the oil sands. Consequently,
our discussion will be focused on the other five
categories.)
The pictures from the Industry and Provincial
Government categories may be dated back to 1967
and 1925, respectively. The year 2004 was a
breakthrough year when Civil Society images
related to the oil sands came into existence, but they
produced only two documents for the period 2004-
2005. It was thus found that 2006 was a
distinguishing year, given that this is when Civil
Society became more politically active in opposing
the oil sands.
Figure 2 depicts some imagery used by the three
main stakeholders, namely Suncor Energy, the
Government of Alberta, and Environmental
Defence. Based on the number of documents
available, these entities are leaders in Industry,
Government, and Civil Society: Anti Oil Sands,
respectively.
Figure 3 shows a comparison of the type of
images used by the three main organizations, as the
debate evolved over time. The evaluation includes
pictures from 2006 to mid-2016 (when data
collection stopped). From the graphs, it was clear
that Suncor Energy was the only organization
actively giving its views on the tar sands in the years
from 2006 to 2008. In 2008, the Government of
Alberta focused on the controversial tar sands by
utilizing machine/infrastructure pictures as the
instrument for promoting its views. Suncor Energy
proceeded in the same way, although in addition to
machines they also promoted their thoughts using
the open-pit and people classes.
In contrast, as Environmental Defence was in its
inception phase, they had only three documents in
that year. This small amount of images was due to
the fact that this organization was newly formed.
The figures show that the imagery focusing on
people and graphics dominate the imagery used by
Suncor Energy. Interestingly, there was a later
tendency to move towards graphics rather than
people, while Environment Defence tends to
increase their focus on graphics, protest and people.
The focus on machines is steadily declining, as
the debate continues. Further, Suncor Energy has
less focus on open-pit, while the other role-players
do engage this argument later in the timeline. The
two main themes commonly found in the
Government of Alberta images were people
(workers, eminent personalities in formal apparel)
and oil sands infrastructure. The earliest recorded
picture was from mid-1920s. After 2006, the use of
people in photographs was reduced by 25%, while
the use of machines in images was reduced to one
third in comparison to the earlier period. However,
landscape imagery showed an increase by a factor of
two during the same period.
Government and industries were facing rising
opposition from civil society about the destruction of
natural resources. Consequently, landscape images
were used by government to show how well the oil
companies are doing vis-à-vis returning the land to
its natural state.
In addition, there was a decline in using the
images of well-known pro-oil sands advocates as
well as activists, by all role players. Rather, the
imagery focused on generic images of families and
nature.
As expected, industry and government groups in
favour of the oil sands produced documents that
show the positive impact on life, society and culture.
Their focus was on showing oil as an essential
commodity in every aspect of our existence, while
the civil society opponents focused more on graphics
containing protest imagery and pictures of actual
protesters.
4.2 Multi-domain Learning
In this section, we discuss the results when exploring
the data in a supervised learning setting. Recall that
our database contains six classes of images, as

(a)
(b)
(c)
Figure 2: Contrasting imagery used by (a) Suncor Energy, (b) Government of Alberta and (c) Environmental Defence.
Figure 3: A comparison of the timelines of the imagery used by the three main players in the oil sands debate.
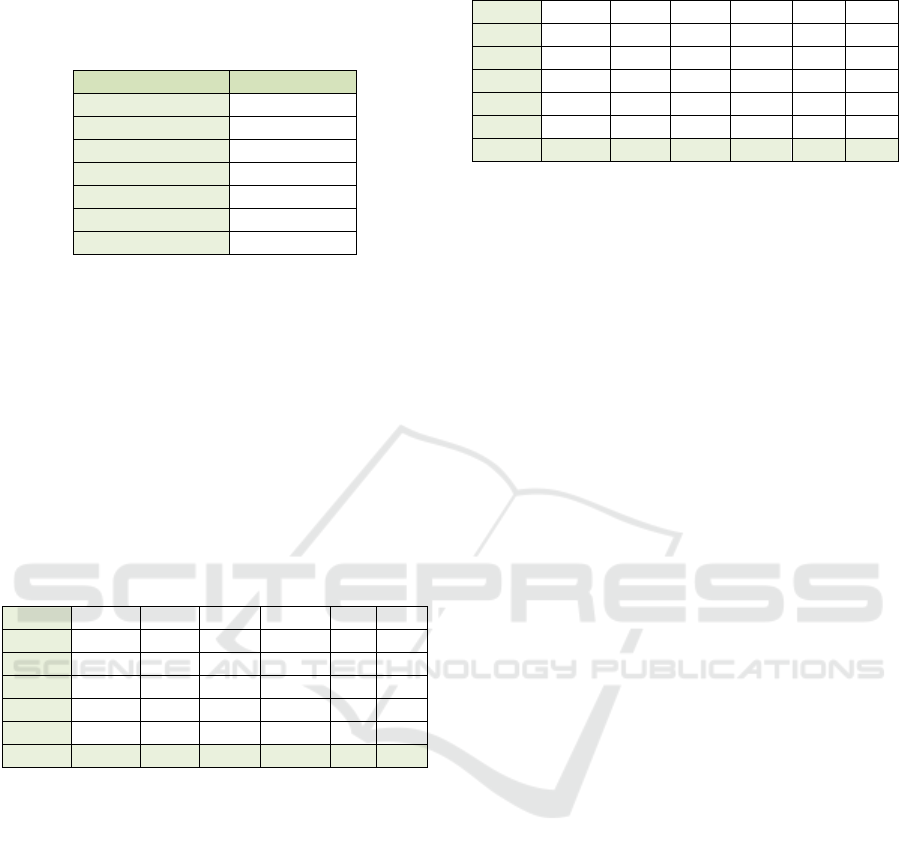
labelled by a domain expert. Table 1 summarizes the
membership of the six classes.
Table 1: Number of images in each category.
Category Membership
People 533 (30.3%)
Protest 109 (6.0%)
Machines 216 (12.3%)
Open-pit 142 (8.1%)
Landscape 192 (10.9%)
Graphics
569 (32.3%)
Total
1760 (100%)
Throughout this study, we followed a ten-fold
cross-validation approach and report the averaged
results of ten runs. Initially, we trained a number of
classification algorithms in this six-class learning
setting. We conducted four different sets of
experiments. Our preliminary experimental
evaluations confirmed that the quadratic support
vector machine (SVM) method performed best, in
terms of overall accuracy (Amari and Wu, 1999).
(Note that we used statistical significance analysis
through the Friedman and adhoc Nemenyi tests for
this task (Japkowicz and Shah, 2011).)
Table 2: True class versus predicted class (count).
Grphcs 463 12 1 85 5
Indstr 37 81 28 16 86 1
Lndscp 37 28 67 12 50 2
OpnPt 23 19 16 57 27
Ppl 65 46 18 7 356 5
Prtst 8 15 6 72 8
Grphcs Indstr Ldscp Opnpt Ppl Prtst
Next, we explored the results in order to obtain
insights into the nature of misclassifications. To this
end, tables 2 and 3 depict the results of the quadratic
SVM classifier in terms of a confusion matrix, as
well as the true positive versus false negative rates.
The tables show that the classifier was most
successful when classifying the graphics and people
images. The tables further indicate that, as expected,
that the people and protest categories were the most
similar, as they both contained humans. In this case,
66% of the protest images were misclassified as
people, due to the categories’ similar characteristics.
A protest image typically contains people together
with some posters, and this led to the protesters
being grouped into the more people category. That
is, the classifier discarded the poster information and
rather focused on the humans present.
Table 3: Class precisions in terms of percentages.
Grphcs 82% 2% <1% 15% 1%
Indstr 15% 33% 11% 6% 35% <1%
Lndscp 19% 14% 34% 6% 26% 1%
OpnPt 16% 13% 11% 40% 19%
Ppl 13% 9% 4% 1% 72% 1%
Prtst 7% 14% 6% 66% 7%
Grphcs Indstr Ldscp Opnpt Ppl Prtst
The graphics category resulted in fewer
misclassifications. Given that graphics contained
computer-assisted visuals (including text), whereas
categories such as landscape and open-pit mostly
included outdoor photographs, the Mediatoil-IR
system was able to detect these differences. A
similar observation holds for protest and open-pit
images. As the characteristics of these two classes
were quite distinct, not a single instance of open-pit
was misclassified as belonging to protest. The
results for the images that are often of mixed
content, namely landscapes and open-pit, confirms
that it is challenging to distinguish in such a context.
Our Mediatoil database contains a wide range of
distinctive images. We therefore concluded that
exploring the subsets of images separately, could
potentially yield better results. Based on this
observation, we proceeded to train the classifiers in
an incremental manner.
We next describe the results of this three step
learning process. In the first domain, we considered
our entire dataset and converted it into a binary
classification problem. That is, we combined the
generic people grouping with the protest category
(both which includes humans in the images) into one
class, and contrasted these images against the
remaining four categories (“non-people”). In the
second and third domains, we proceeded to split the
original datasets in two. For domain two, we turned
our attention to the generic people category and
opposed it to the protest category. This is a
challenging learning task, since (as noted above)
most protest images include some humans, often
together with graphical elements such as posters.
Our aim here was to determine whether we could
achieve a higher recall than the original
disappointing number of 7%. The third set of
experiments only considered the four “non-people”
classes, namely machines, open-pit, landscape and
graphics. Again, it follows that an open-pit image
may contain machines and also be part of a
landscape. Table 4 summarizes the details of these
domains, in terms of class memberships.

Table 4: Summary of three learning tasks.
Task Classes Membership
1 People + Protesters
Non-People
642 (36%)
1118 (64%)
2 People
Protest
533 (83%)
109 (17%)
3 Machines
Open-pit
Landscape
Graphics
216 (19%)
142 (13%)
192 (17%)
568 (51%)
The reader will notice that all of these datasets
are imbalanced, notably domain 2, where the skew
ratio is high (He and Garcia, 2009) (Agarwal et al.,
2015) . Note that, in most imbalanced domains, the
minority class is often deemed to be of higher
important. This is not the case in our research, since
we are interested in classifying all the classes
accurately.
Table 5: Recall for individual classes in three domains.
Class L-SVM Q-SVM Boostin
g
People
Non-Peo
p
le
67%
92%
72%
91%
57%
83%
People
Protest
99%
14%
99%
24%
83%
61%
Machines
Open-pit
Landscape
Gra
p
hics
59%
51%
45%
96%
59%
49%
47%
95%
49%
48%
79%
95%
We report the results for three difference
classification techniques, while using the one-
versus-one (OVO) approach for multi-class learning
(Gatar et al., 2011) (Tomar and Agarwal, 2015).
Firstly, we employed a linear SVM, where the
kernel used was linear with degree equal to one. The
second technique is a quadratic SVM, as introduced
above (Amari and Wu, 1999). The third method is
the RUSBoost boosting ensemble, with 30
classification and regression trees (CART) decision
trees as base learners. This boosting algorithm
utilizes a hybrid data sampling approach and has
been shown to be highly suitable for imbalanced
domains (Seiffert et al., 2010).
Table 6: Accuracies for the classifiers in three domains.
Domain L-SVM Q-SVM Boosting
P vs nP 82.67% 83.12% 73.80%
P vs Pt 85.04% 86.13% 77.88%
M, L, O, G 74.41% 74.23% 60.82%
Tables 5 to 7 summarize our results, measured in
terms of recall, precision and accuracy. Table 6
shows that the support vector machines had the
highest overall accuracies in these three domains.
Our results indicate, as expected, that the classifiers
are consistently biased towards the majority classes.
These accuracies further suggest that linear SVM,
quadratic SVM, and RUSBoost had some limited
success in identifying the minority classes. The
results also indicate that linear and quadratic SVM
do not degrade the performance against the majority
class, in contrast to the RUSBoost technique, where
the majority class accuracies for domains 1 and 2 are
lower.
Next, we consider the recall and the precision
values. Table 5 shows that, in domain 1, we found
that quadratic SVM achieves the highest recall
(72%) for the minority class, followed by linear
SVM (67%). In domain 2, RUSBoost secured a
recall of 61% for the protest category. However, this
gain results in a loss of recall for the majority class
(people). Domain 3 (machines vs. open-pit vs.
landscape vs. graphics) has three minority classes,
namely machines, open-pit, and landscape and all
three algorithms favour the majority class.
Table 7: Precision for individual classes in three domains.
Class L-SVM Q-SVM Boosting
People
Non-Ppl
82%
83%
82%
84%
66%
77%
People
Protest
85%
93%
86%
81%
91%
40%
Machines
Open-pit
Landscape
Graphics
65%
67%
63%
79%
64%
70%
69%
79%
48%
43%
39%
84%
Table 7 shows that, in four cases, the quadratic
SVM algorithm provided the highest scores in terms
of precision. In five of the categories, at least one of
the classification algorithms yield precision rates
higher than 80%. The precision rates for the
minority classes in domain 3, namely machines,
open-pit and landscape were 65% or higher. The
three algorithms produce comparable results, i.e.
precision rates are in the same ranges.
4.3 Lessons Learned
The application of content-based information
retrieval and knowledge discovery in a real-world
domain is always a challenge. In our case, the main
issues faced were the following.
According to communications researchers, who
were our domain experts, the images belonged to
distinct and easily distinguishable categories.

However, from a content-based retrieval point of
view, these images contained very similar features.
This fact was most notable in the images that contain
human subjects. For example, industry images
almost always contain some engineers and other
industry workers, often depicted as wearing
protective helmet. It follows that the protest category
are also problematic, since it is not always evident to
distinguish protesters from the generic people
category. Further, many landscape images could
contain images of hikers, swimmers, anglers or
canoers. This posed a challenge for accurate
classification and retrieval.
One aim of our research was to explore whether
using only content-based descriptors, without any
metadata, would suffice in terms of precision and
accuracy. Our results show that we obtained high
results for the categories that are clearly distinct. The
process of subdividing the images into subcategories
led to higher recall, precision and accuracies and
was beneficial to all the classification algorithms.
It follows that we could also make use of meta-
data such as tags and keywords, in order to possibly
augment the content-based descriptor. Manual image
annotation is time-consuming, laborious and
expensive; to address this, we are currently
investigating the use of automatic tagging systems
and/or crowd-sourcing (Datta et al., 2007). The use
of crowd-sourcing may be problematic, since the
annotators may potentially be biased towards a
specific cause.
The experimental results further show that no
single classifier dominated and suggests that a multi-
strategy learning method, which employs some form
of meta-learning, may be beneficial. For instance,
the meta-learner would select the current classifier
with the highest precision, and suggest these results
to the user.
A further problem was the fact that the data were
unbalanced. This aspect needs further attention,
since the classifier explicitly designed for handling
class imbalance did not outperform. Rather, this
classifier sacrificed the majority class accuracies, in
order to improve on minority class predictions. As
Mediatoil is an ongoing project and one of our aims
is to obtain additional images from these minority
classes. We are also planning in utilize additional
techniques to address the multi-class imbalance
issue (Agarwal et al., 2015).
Recall that the original class labels were assigned
by domain experts, through visual inspection.
Originally, each image was grouped into only one
class. The domain experts inspected our
classification results and it was conceded that some
of these classes are subject to interpretation. Further
assessment by our domain experts confirmed, after
the fact, that it may be possible for an image to fall
in more than one class. We aim to explore this
aspect in our future work.
5 CONCLUSIONS
In this paper, we introduced the Mediatoil-IR
system, designed in order to explore an evolving
repository of imagery regarding the Canadian oil
sands. We explored the images using content-based
retrieval combined with supervised machine
learning. Our goal was to illustrate how information
retrieval and knowledge discovery may be used in
order to map the contrasting viewpoints of different
stakeholders in this debate. Further, our system was
designed to investigate the different use of
categories of images during the lifetime of the
ongoing debates. Our analysis shows that the
imagery used by various stakeholders differed
considerably, and changed over time. Our results
further indicate that dividing the images into sub-
categories is beneficial for retrieval and
classification.
It follows that our future research will focus on
handling skewed domains where the class imbalance
is high, in order to ensure that the retrieval of
minority class images is precise. The use of key-
words or tags, together with the content-based
indexing, is another avenue that we wish to further
explore. We also plan to further explore the video
and text content, as contained in the Mediatoil
repository.
ACKNOWLEDGEMENTS
The authors acknowledge funding by Canada’s
Social Sciences and Humanities Research Council
(SSHRC). The MediaToil project is accessible at
www.mediatoil.ca.
REFERENCES
Liu, Y., Zhang, D. and Ma, W.: A survey of content-based
image retrieval with high-level semantics, Pattern
Recognition, 40(1):262 – 282, 2007.
Sridhar A., Doyle, S. and Madabhushi, A.: Content-based
image retrieval of digitized histopathology in boosted
spectrally embedded spaces, Journal of Pathology
Informatics, 6(1):41, 2015.

McCurdy P.: Mediatoil vision, URL:
http://mediatoil.ca/Home/About, accessed 22/08/2017.
Brant, A.A.: Beneath the surface, Geophysics 27, 1,
pp.162-167, 1962.
Dyer, S., Lemphers, N., Huot, M. and Grant, S.: Beneath
the Surface: A review of key facts in the oilsands
debate, Pembina Institute, Jan. 28, 2013, accessed on
12 June 2017, http://www.pembina.org/pub/2404.
Tomasi, C. and Manduchi, R.L.: Bilateral filtering for gray
and color images, In: IEEE 6
th
International
Conference on Computer vision, pp. 839-846, 1998.
Bay, H., Tuytelaars, T. and Van Gool, L.: Surf: Speeded
up robust features. Computer Vision: ECCV 2006,
pp.404-417, 2006.
Lowe, D.G.: Object recognition from local scale-invariant
features, In 7
th
International Conference on Computer
Vision, Vol. 2, pp. 1150-1157, 1999.
Chen, C.F. and Hsiao, C.H.: Haar wavelet method for
solving lumped and distributed-parameter
systems, IEE Proceedings on Control Theory and
Applications, 144(1), pp.87-94, 1997.
Zhang, Y., Jin, R. and Zhou, Z.H.: Understanding bag-of-
words model: a statistical framework, International
Journal of Machine Learning and Cybernetics, 1(1-4),
pp.43-52, 2010.
Likas, A., Vlassis, N. and Verbeek, J.J.: The global k-
means clustering algorithm, Pattern Recognition,
36(2), pp.451-461, 2003.
Amari, S.I. and Wu, S.: Improving support vector machine
classifiers by modifying kernel functions, Neural
Networks, 12(6), pp.783-789, 1999.
Japkowicz, N and Shah, M.: Evaluating Learning
Algorithms: A Classification Perspective. Cambridge
University Press, 2011.
He, H. and Garcia, E.A.: Learning from imbalanced data.
IEEE Transactions on Knowledge and Data
Engineering, 21(9), pp.1263-1284, 2009.
Galar, M., Fernández, A., Barrenechea, E., Bustince, H.
and Herrera, F.: An overview of ensemble methods for
binary classifiers in multi-class problems:
Experimental study on one-vs-one and one-vs-all
schemes, Pattern Recognition, 44(8), pp.1761-1776,
2011.
Tomar, D. and Agarwal, S.: A comparison on multi-class
classification methods based on least squares twin
support vector machine, Knowledge-Based Systems,
81, pp.131-147, 2015.
Seiffert, C., Khoshgoftaar, T.M., Van Hulse, J. and
Napolitano, A.: RUSBoost: A Hybrid Approach to
Alleviating Class Imbalance, IEEE Transactions on
Systems, Man, and Cybernetics - Part A: Systems and
Humans, 40 (1), pp. 185-197, 2010.
Datta, R., Joshi, D., Li, J. and Wang, J.Z.: Tagging over
time: Real-world image annotation by lightweight
meta-learning. In Proceedings of the 15
th
ACM
International Conference on Multimedia, pp. 393-402,
2007.
Agarwal, A., Viktor, H.L. and Paquet, E.: CUT: Multi-
Class Imbalanced Data Classification using SMOTE
and Cluster-based Undersampling. In Proceedings of
the International Conference on Knowledge Discovery
and Information Retrieval (KDIR 2015), pp. 226-234,
2015.
