
Relating Aircraft Altitude with Pilot’s Physiological Variables:
Towards Increasing Safety in Light-sport Aviation
Susana M. Vieira
1
, Alexandra Moutinho
1
, Margarida Solas
1
, Jos
´
e F. Loureiro
1
, Maria B. Silva
1
,
Sara Zorro
2, 3
, Lu
´
ıs Patr
˜
ao
3
, Joaquim Gabriel
4
and Jorge Silva
2, 5
1
IDMEC, LAETA, Instituto Superior T
´
ecnico, Universidade de Lisboa, Portugal
2
CERIS, CESUR, Instituto Superior T
´
ecnico, Universidade de Lisboa, Portugal
3
Faculdade de Ci
ˆ
encias da Sa
´
ude, Universidade da Beira Interior, Portugal
4
INEGI, LAETA, Faculdade de Engenharia, Universidade do Porto, Portugal
5
Faculdade de Engenharia, Universidade da Beira Interior, Portugal
Keywords:
Light-sport Aviation, Classification, Prediction, Neural Networks Model, Decision Support System.
Abstract:
Several applications require humans to be in high-altitude environments, whether for recreational purposes,
like mountaineering or light sport aviation, or for labour, as miners. Although in these conditions the monitor-
ing of physiological variables is, per se, of interest, the direct correlation of these variables with altitude itself
is not usually explored towards the development of decision-support systems and/or critical event alarms. This
paper proposes two neural networks approaches to assess and explore this correlation. One, based on dynamic
SISO models, estimates physiological variables using the aircraft pressure altitude as input. A second approach
uses static MISO networks to classify the flight stage (and therefore the altitude variation) from physiological
variables. Both models were developed and validated using real data acquired in hypobaric chamber tests
simulating a real flight. The good results obtained indicate the viability of the approach.
1 INTRODUCTION
The influence of altitude to human physiology is a
known issue, whether the scenario is underwater, on
the ground or in the air. Different monitoring systems
that allow to acquire relevant data to study this influ-
ence are being developed for different applications.
In (Aqueveque et al., 2016), a wearable device is de-
signed to acquire and monitor physiological (elec-
trocardiogram, respiratory activity and body temper-
ature) and environmental (ambient temperature and
relative humidity) variables of miners working at high
altitude. Wagner (2011) proposes an ambulatory
biosensor (heat and respiratory rate, skin and core
temperature) system to be used during high altitude
mountaineering. Marques (2012) proposes a portable,
ergonomic system for the acquisition of flight (posi-
tion, attitude, altitude, speed, g-load, heading, abso-
lute pressure and temperature inside the cabin) and
physiological (cerebral oximetry, electroencephalo-
gram and electrocardiogram) data, to be used in avia-
tion applications.
In light sport aviation, where aircraft may go as
high as 10,000 to 15,000 ft, cabins are not pressur-
ized. This means there is no conditioned air being
pumped into the aircraft cabin in order to guarantee a
stabilized pressure within proper limits for the human
body. The low pressure may lead to several physi-
ological problems like hypoxia, altitude and decom-
pression sickness, and barotrauma (Harding, 2002).
Of the different effects of low pressure exposure, hy-
poxia is known to impair mental functions and induce
sensory deficits. Petrassi et al. (2012) indicate learn-
ing, reaction time, decision making and certain types
of memory, as examples of cognitive and psychomo-
tor deficits resulting from hypoxia at moderate alti-
tudes (8,000 to 15,000 ft). Together with unforseen
climatic conditions, psychophysiological factors of
the pilot him/herself may affect the flight safety. In
this scenario, the psychophysiologic factors play a
key role, as the heterogeneity of reactions of differ-
ent pilots attests (Patrao et al., 2013; Petrassi et al.,
2012).
To prevent adverse outcomes, either in aviation or
Vieira, S., Moutinho, A., Solas, M., Loureiro, J., Silva, M., Zorro, S., Patrão, L., Gabriel, J. and Silva, J.
Relating Aircraft Altitude with Pilot’s Physiological Variables: Towards Increasing Safety in Light-sport Aviation.
DOI: 10.5220/0006476903590364
In Proceedings of the 14th International Conference on Informatics in Control, Automation and Robotics (ICINCO 2017) - Volume 1, pages 359-364
ISBN: 978-989-758-263-9
Copyright © 2017 by SCITEPRESS – Science and Technology Publications, Lda. All rights reserved
359

in other applications, research has been conducted to
monitor a person (pilot) suffering from hypoxia. Gur-
jar et al. (2010) propose a hypoxia monitor capable of
detecting various physiological parameters (heart and
respiratory rates, blood velocity and blood oxygen
saturation levels) that change in response to reduced
oxygen availability. The onset of hypoxia is identified
based on the changes in their cross-correlation sig-
nals. Acharya et al. (2016) present a M-ary decision
fuzzy architecture capable of classifying the degree
of induced hypoxia as a function of the duration of
exposure to different altitude profiles. The proposed
monitoring system takes blood oxygen saturation lev-
els and altitude readings as inputs and estimates of the
level of hypoxia as outputs.
Although there is a growing interest in new acqui-
sition systems, there are not so many studies using the
correlation of the acquired data, namely the relation
between altitude and physiological variables, towards
the development of decision-support systems and/or
critical event alarms. This paper presents preliminary
results in this direction, with the purpose of estimat-
ing the occurrence of critical events during light sport
flights using both physiological and flight data. It pro-
poses two neural networks approaches to assess and
explore the correlation between altitude and physio-
logical variables. One, based on dynamic SISO mod-
els, estimates physiological variables using the air-
craft pressure altitude as input. A second approach
uses static MISO networks to classify the flight stage
(and therefore the altitude variation) from physiolog-
ical variables. Results obtained using real data from
hypobaric tests validate the hypothesis.
2 DATA ACQUISITION AND
PREPROCESSING
The following sections present the data considered in
this work and the preprocessing methods applied prior
to the models development.
2.1 Data acquisition
In order to estimate critical events during light-sports
flights, a monitoring system was used that measures
the pilot’s cerebral (rSO2) and peripheral (SpO2)
oximetry and heart rate (HR), and the aircraft alti-
tude (h). Data was acquired in the hypobaric cham-
ber (fig. 1) of the Center of Aeronautic Medicine of
the Portuguese Air Force, at the Lumiar military base,
Lisbon, Portugal. This work considers data collected
during three tests performed by the same pilot at the
hypobaric chamber. The respective data is shown in
Figure 1: Data acquisition at hypobaric chamber.
fig. 2. Observing the data from the three tests, it is
possible to observe a correlation between the periph-
eral oximetry and altitude curves. In fact, when the
altitude increases, the peripheral oximetry decreases,
and vice-versa. From the data from tests 2 and 3
(figs. 2(b)-2(c)), it also seems possible to correlate the
heart rate with the altitude, but this correlation is not
clear for test 1 (fig. 2(a)).
2.2 Data Preprocessing
Observing the data in fig. 2, it is noticeable that the
variables were not acquired during the same period of
time, and that they do not have the same sampling.
This is due to the fact that they were acquired with
different equipments. In order to use the data for
modeling purposes, it is required that these issues be
solved. A first preprocessing step was then to truncate
(eliminate) the excessive data at the beginning and/or
end of the data set in order to have data sets where
all variables are present. Regarding the harmoniza-
tion of the variables sampling, two approaches were
considered. The first approach considers the variable
with higher sampling period (altitude), and expands
the other variables (cerebral and peripheral oximetry
and heart rate) data in order for them to have the same
number of data points. This is accomplished using
the ZOH (zero-order hold) method, which holds the
previous value until a new one is available. The sec-
ond method takes the opposite direction, forcing the
lower sampling rate of variables heart rate and cere-
bral oximetry to the variables with higher sampling
(altitude and peripheral oximetry). The median was
used to obtain the most representative value in each
time interval. Although the average is a more intu-
itive measure, the median is less sensitive to possible
outliers, making this process analogous to a filtering
step.
ICINCO 2017 - 14th International Conference on Informatics in Control, Automation and Robotics
360

(a) Test 1 data (b) Test 2 data (c) Test 3 data
Figure 2: Original data obtained in three tests performed by the same pilot at the hypobaric chamber.
2.3 Data Analysis
After data preprocessing, it is now possible to eval-
uate the correlation between the physiological vari-
ables and the altitude. For each pair of variables, the
data were centered subtracting the mean value prior
to computing the covariance matrix:
Covariance [rSO2; h] =
1 −0.136
−0.136 1
Covariance [SpO2; h] =
1 −0.603
−0.603 1
Covariance [HR; h] =
1 0.3307
0.3307 1
The covariance matrix is a symmetric matrix that al-
lows to explore the linear relation between variables.
This matrix may be used to predict how one vari-
able varies relative to another. Analysing the values
of the cross-diagonals, it is possible to observe that:
(i) the relations between cerebral oximetry/heart rate
and altitude are weak, with the first being the weakest
(lower value of correlation, -0.136); (ii) the periph-
eral oximetry shows a moderate negative correlation
(-0.603) with the altitude, indicating that when the al-
titude increases the peripheral oximetry will decrease
and vice-versa (as was already observed in fig. 2).
3 NEURAL NETWORK MODEL
Artificial neural networks (ANN) are mathematical
models developed to mimic the functioning of the bi-
ological neural networks (Haykin, 1999). In the scope
of this work, artificial neural networks are used to
perform supervised learning from a training data set
where the values of the output variable are known.
The target output variable is a continuous real valued
variable and the problem is dealt as a regression prob-
lem.
3.1 Neural Network Parameters
Defining the network structure is not a trivial task.
Besides the number of inputs and outputs, the number
of hidden layers of the network and the type of activa-
tion functions have to be defined. The backpropaga-
tion algorithm was used to train the network to learn
the adequate weights and bias.
Network Type and Dimensions. Two approaches
were considered to assess the relation of the barom-
eter altitude with each physiological variable mea-
sured. The first concerns the prediction of each phys-
iological variable using the altitude as network in-
put. The second considers the opposite direction and
aims to see if it is possible to identify the flight stage
(take-off, cruise flight, or landing), based on the cur-
rent values of the physiological variables. For that,
two types of neural networks are developed. One
corresponds to a static multiple-input, single-output
(MISO) network for flight stage classification (clas-
sifier neural network), and the other is a dynamic
single-input, single-output (SISO) network for pre-
dicting physiological variables based on the altitude
(dynamic neural network). For the classifier neural
network (CNN), all samples are considered as inde-
pendent. For this type of model, the three available
flight data sets can be concatenated and the data may
be randomly divided into the train, test and validation
data sets, as long as the class proportion is maintained
throughout all the data sets. The dynamic neural net-
work (DNN), or predictor, considers the information
on the present time sample as well as the historical
temporal sequence of the inputs and outputs. This
type of neural network present a very good perfor-
mance for the modeling of nonlinear systems.
Training, Test and Validation Data. The data was
divided into three different sets: train, test and vali-
dation. The bigger data set was used for training the
network, defining the parameters (weights and bias)
that minimize the cost function (1). The validation set
is used during the training process to avoid the net-
work overfitting. The test set is used for the model val-
Relating Aircraft Altitude with Pilot’s Physiological Variables: Towards Increasing Safety in Light-sport Aviation
361

idation and is used after the training process of the
neural network is done. For the two types of neural
(a) Classifier data parti-
tion.
(b) Predictor data parti-
tion.
Figure 3: Data set division in train validation and test.
networks used, the data were divided in two different
ways. For the classifier the considered flight data were
concatenated and the complete data set was then di-
vided randomly as the samples/observations are con-
sidered as being independent. The distribution of the
data was done according to figure 3(a). For the dy-
namic neural network, the data were not divided ran-
domly. The integrity of a complete data set corre-
sponding to a given flight was maintained, so three
different flights were considered and used as train,
validation and test according to figure 3(b). Please
note that in this case the size of the different sets is
very similar due to the similarity between flights.
Cost Function. In a neural network, the cost function
is computed in the optimization algorithm used for the
network learning process. The cost function is used
to measure the current network performance, and is
also used to update the weights of the network during
the backpropagation method. In this work, the most
common cost function for regression problems was
used, the mean squared error (MSE):
C =
1
2
K
∑
i=1
(t
i
− y
i
)
2
(1)
where t
i
is the i-th sample target output value, y
i
is the
respective estimated output value and K corresponds
to the number of samples. The cost function (1) is
only valid for neural networks with a single output,
where the learning process uses the complete set of
available samples at each iteration.
Training Algorithm. The performance of the ob-
tained neural network model strongly depends on the
training algorithm used. The Levenberg-Marquardt
algorithm was used as it is fast for simple networks
and in this work the expected neural network struc-
tures are small for both presented approaches.
Number of Hidden Layers. To identify the most ad-
equate number for the hidden layers, several networks
with different number of hidden layers were devel-
oped. In order to accommodate the inevitable varia-
(a) Classifier (b) Predictor
Figure 4: Number of hidden layers.
tion on the network performance, for each number of
hidden layers tested, five experiments were run and
the median of the five was considered for the analy-
sis. From figures 4(a) and 4(b), it is possible to con-
clude that, as expected, the quality of the regression
increases with the number of hidden layers.
4 RESULTS
4.1 Flight Stage Classifier
This section presents the designed flight stage clas-
sifier, a neural network model that classifies patterns
into categories. It receives the different physiological
variables (heart rate, cerebral oximetry and periph-
eral oximetry) as inputs and outputs the flight stage
classification. The flight was divided into three flight
stages, depending on the altitude rate: (C1) ascent, in-
cluding take-off (positive rate); (C2) cruise flight (null
rate); and (C3) descent, including landing (negative
rate). The block diagram of the classifier is repre-
sented in figure 5. The generated model is capable
Figure 5: Block diagram of flight stage classifier
(a) Cost function (b) Flight stage classifica-
tion
Figure 6: Flight stage CNN model performance.
of identifying correctly 96.4% of the patterns of the
test data set. Table 1 presents the results obtained for
this data set, namely through the confusion matrix (ta-
ble 1(a)) and the performance measures (table 1(b)).
ICINCO 2017 - 14th International Conference on Informatics in Control, Automation and Robotics
362

Figure 6(a) shows the evolution of the error for the
training data set, and fig. 6(b) the comparison between
the classifier output and the target (true output). These
results show the general good assessment of the clas-
sifier.
Table 1: Results of flight stage classifier for the test data set.
(a) Confusion matrix
Classifier output
C1 C2 C3 Total
C1 851 18 869 869
Real C2 65 1503 18 1586
Flight Stage C3 0 11 965 976
Total 916 1532 983
(b) Performance measures
Classifier
C1 C2 C3
Accuracy 0.9758 0.9674 0.9915
Sensitivity 0.9793 0.9477 0.9887
Precision 0.9290 0.9811 0.9817
Specificity 0.9646 0.9843 0.9927
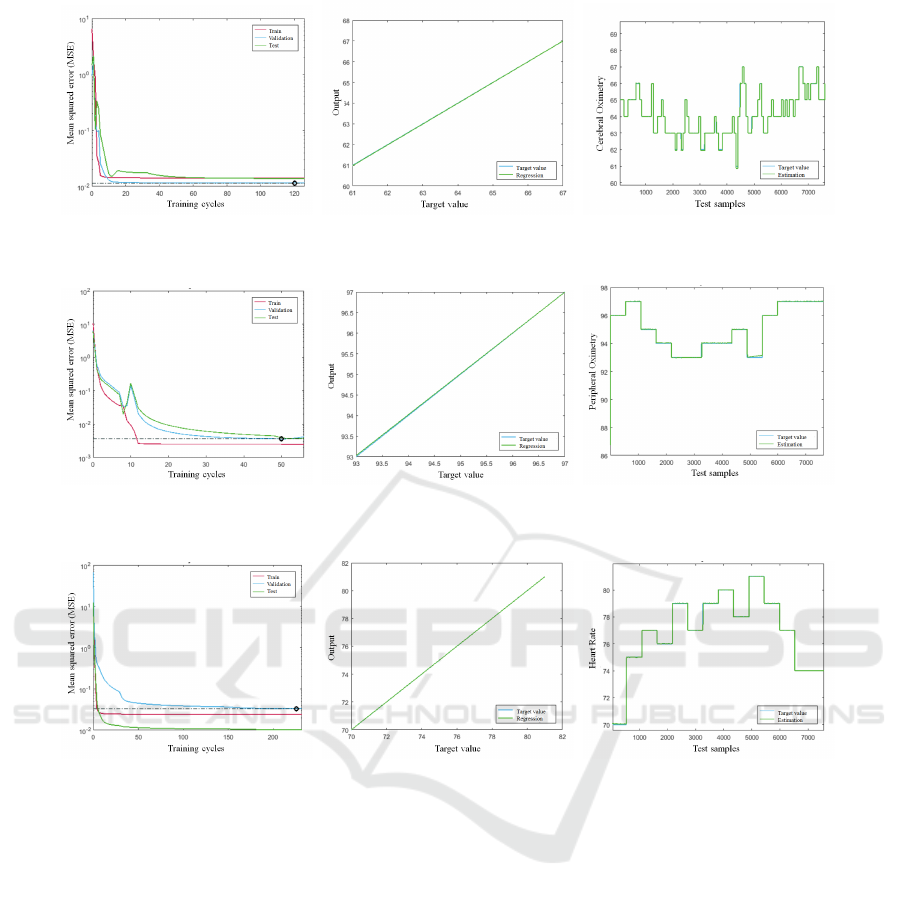
4.2 Physiological Variables Predictor
This section presents the three single input, single
output (SISO) dynamic neural networks capable of
individually estimating the three physiological vari-
ables (cerebral oximetry, peripheral oximetry and
heart rate) from the barometric altitude. The respec-
tive block diagrams are depicted in fig. 7. Table 2
Figure 7: Block diagrams of the SISO dynamic models.
shows the regression and mean squared error values
obtained for the best model of each type. The periph-
eral oximetry model has the best overall fitting, given
that it has the lowest mean squared error (MSE) and
a regression value very close to the best value of the
heart rate model.
Table 2: Performance of the different dynamic SISO mod-
els.
Input Output Regression value MSE
Cerebral oximetry 0.9676 0.0132
Altitude Peripheral oximetry 0.9961 0.0033
Heart rate 0.9979 0.0226
Figure 8 depicts the results obtained for the cere-
bral oximetry predictor. With a linear regression fit-
ting coefficient of 0.9676, the model output shows a
nearly perfect fit against the target values. The re-
sults obtained for the peripheral oximetry predictor
are depicted in figure 9. With a linear regression fit-
ting coefficient of 0.9961 and a MSE of 0.0033, the
model output is nearly perfect. In terms of the heart
rate predictor, the results obtained are depicted in fig-
ure 10, showing a linear regression fitting coefficient
of 0.9979 and a MSE of 0.0226.
5 CONCLUSIONS
This paper assesses the use of neural network models
to relate physiological variables (heart rate, peripheral
oximetry and cerebral oximetry) with barometric alti-
tude. This assessment is twofold. First it considers
using the available physiological variables to classify
the altitude rate (flight stage). Second, it considers dy-
namic models to predict each physiological variable
from the barometric altitude. Both approaches used
real data obtained from three hypobaric chamber tests
performed by the same pilot. The good results ob-
tained validate the proposed models. Moreover, they
may serve as the basis for the development of an alert
system of abnormal situations. For example, compar-
ing the altitude rate obtained from the barometric al-
titude with the flight stage classified using the physi-
ological variables it may be possible to detect a mal-
function of the barometric sensor. Or comparing the
physiological variables prediction using the baromet-
ric altitude with the respective measured variables, it
may be possible to detect an unexpected physiolog-
ical behavior of the pilot, eventually caused by hy-
poxia or other conditioning factors. Following steps
also include analysing the sensitivity of the models to
different pilots data.
ACKNOWLEDGEMENTS
This work was supported by FCT, through IDMEC,
under projects LAETA (UID/EMS/50022/ 2013) and
iDecision4Care (IF/00833/2014/CP1238/ CT0002).
S. M. Vieira acknowledges the support by Program
Investigador FCT (IF/00833/ 2014) from FCT, co-
funded by the European Social Fund (ESF) through
the Operational Program Human Potential (POPH).
Relating Aircraft Altitude with Pilot’s Physiological Variables: Towards Increasing Safety in Light-sport Aviation
363
(a) Mean squared error (b) Regression (c) Target versus model output
Figure 8: Cerebral oximetry DNN model performance.
(a) Mean squared error (b) Regression (c) Target versus model output
Figure 9: Peripheral oximetry DNN model performance.
(a) Mean squared error (b) Regression (c) Target versus model output
Figure 10: Heart rate DNN model performance.
REFERENCES
Acharya, S., Rajasekar, A., Shender, B., Hrebien, L., and
Kam, M. (2016). Real time hypoxia prediction us-
ing decision fusion. IEEE Journal of Biomedical and
Health Informatics, PP(99).
Aqueveque, P., Gutierrez, C., Saavedra, F., and et al. (2016).
Monitoring physiological variables of mining workers
at high altitude. In Industry Applications Society An-
nual Meeting, pages 1–6. IEEE.
Gurjar, R., Seetamraju, M., Wolf, D. E., and Hastings, J.
(2010). High reliability, miniature personal hypoxia
monitoring system. In SPIE 7674, Smart Biomedi-
cal and Physiological Sensor Technologies VII, page
76740H76740H. International Society for Optics and
Photonics.
Harding, R. (2002). Medical Aspects of Harsh Environ-
ments, volume 2, chapter 32 - Pressure Changes and
Hypoxia in Aviation, pages 984–1013. Office of The
Surgeon General, Dep.of the Army, United States of
America.
Haykin, S. (1999). Neural Networks: A Comprehensive
Foundation. Prentice-Hall.
Marques, A. (2012). Unpressurized light aviation aircrafts
flight and physiological data acquisition system. Mas-
ter’s thesis, Universidade da Beira Interior, Covilh
˜
a,
Portugal.
Patrao, L., Zorro, S., Silva, J., Castelo-Branco, M., and
Ribeiro, J. (2013). Flight physiology training expe-
riences and perspectives: Survey of 117 pilots. Avia-
tion, Space, and Environmental Medicine, 84(6):620–
624.
Petrassi, F., Hodkinson, P., Walters, P., and Gaydos, S.
(2012). Hypoxic hypoxia at moderate altitudes: re-
view of the state of the science. Aviation, Space, and
Environmental Medicine, 83(10):975–984.
Wagner, D. (2011). Ambulatory recording of physiological
variables during an ascent of Mt Aconcagua. Wilder-
ness & Environmental Medicine, 22(1):58–61.
ICINCO 2017 - 14th International Conference on Informatics in Control, Automation and Robotics
364
