
A Computer-based Framework to Process Audiometric Signals using
the Tomatis Listening Test System
Félix Buendía-García
1
, Manuel Agustí-Melchor
1
, Cristina Pérez-Guillot
2
, Hernán Cerna
3
and Alvaro Capitán
3
1
Computing Engineering Department, Universitat Politècnica de València, Camino de Vera s/n, Valencia, Spain
2
Applied Linguistics Department, Universitat Politècnica de València, Camino de Vera s/n, Valencia, Spain
3
Isora Solutions, Calle de la Luna, 24, 28004 Madrid, Spain
Keywords: Audiometric Signals, Tomatis Listening Test System, Image and Spreadsheet Data Processing.
Abstract: Some kinds of audio information are usually represented by images that need to be processed. This is the
case of audiometric signals which are obtained from some devices that hardly produce quantifiable data.
The current paper describes a computer-based framework able to process audiometer images in order to
extract information which can be useful to analyse subject's hearing levels. Such information is
complemented with additional data sources that allow a more comprehensive view of hearing issues either
disorder symptoms or treatment results. These data sources are provided by the TLTS (Tomatis Listening
Test System) device. The proposed framework is based on the use of OpenCV libraries that provide image
processing functionalities together with scripts to manage audiometry spreadsheets. An experiment has been
developed to test auditory stimulations in the context of a collaboration project with the Isora Solutions
company where the proposed system was applied. Obtained results show the framework accuracy and
adequacy to retrieve and process information from several audiometric data sources.
1 INTRODUCTION
Audiometry deals with the need of measuring
hearing acuity for variations in several audio
parameters. Such audiometric process can be based
on objective measurements coming from physical or
acoustic signals, or relying on subjective user
responses. This second scenario represents the work
context of this paper that involves several signal
sources when determining the subject's hearing
levels. Audiometer devices used for evaluating this
hearing acuity are usually based on embedded
hardware units which barely produce charts called
audiograms as a result of the audiometric process.
The current work focuses on the processing of
the images and spreadsheets that record the
audiogram information as data sources provided by
the Tomatis Listening Test System (TLTS).
Moreover, there are several types of tests that can be
addressed in this context such as Pure Tone
Audiometry (PTA), Masking Level Difference
(MLD) or Speech audiometry that requires different
data types to be processed. The computer-based
framework proposed in this work intends to combine
and integrate those data sources that enable a more
comprehensive and holistic view of audiometry
outcomes in a context of auditory stimulations to
improve listening skills.
Computers are quite useful to help the hearing
assessment when several multimedia signal sources
are combined. For example, Mackersie et al., (2001)
presented the evaluation of speech perception
through a computers-assisted test called CASPA
(Computer Assisted Speech Perception Assessment).
This work was extended in the system CasperSent
(Boothroyd, 2006) as a multimedia program whose
main purpose was sentence-level speech-perception
training and testing.
A set of auditory assessment tests based on
integrating phonetic discrimination and word
recognition were described (Eisenberg et al., 2007).
Fernandez et al., (2014) used detection of eye
gesture reactions as a response to sounds in order to
provide computer aided hearing assessment.
Therefore, a combination of multiple data sources is
essential to get a global view of the specific auditory
scenario. In this sense, processing audiogram charts
Buendía-García, F., Agustí-Melchor, M., Pérez-Guillot, C., Cerna, H. and Capitán, A.
A Computer-based Framework to Process Audiometric Signals using the Tomatis Listening Test System.
DOI: 10.5220/0006431400250034
In Proceedings of the 14th International Joint Conference on e-Business and Telecommunications (ICETE 2017) - Volume 5: SIGMAP, pages 25-34
ISBN: 978-989-758-260-8
Copyright © 2017 by SCITEPRESS – Science and Technology Publications, Lda. All rights reserved
25

is a key issue in the current work together with the
collection of spreadsheets data provided by
audiometers.
Another aspect is about the intervention of
experts in the audiometric process. Automated tests
have been developed to check hearing issues in
specific audiometry fields using air conduction tests
(Convery et al., 2014). In this sense, there is a
systematic review of works that check the validity of
automated threshold audiometry compared with the
gold standard of manual threshold audiometry
(Mahomed et al., 2013). Therefore, there is a need to
allow human experts to participate in this process by
providing them with several audiometry data sources
and enabling their analysis. The current work
presents a framework able to process audiometer
images in order to extract information which can be
useful to analyse subject's hearing levels.
The remainder of the paper is structured in the
following sections. The second section depicts the
audiometry context in which the proposed
framework has been developed and tested. This
framework is outlined in section 3 and the fourth
section reports the obtained Results. Section 5
describes some related works Finally, some
Conclusions and further works are drawn.
2 AUDIOMETRY CONTEXT
Audiometry can be considered as a tool to measure
the subject’s hearing capability according to
different sound frequencies. There are several
methods to measure this capability and they can be
divided into subjective and objective audiometry.
Mendel (2007) emphasized the need for both
subjective and objective documentation of hearing
aid outcomes. In this case, the current work focuses
on subjective measures as a way to get audiometry
information by means of specific hearing tests. Pure
tone audiometry (PTA) is measured in dB HL
(Hearing Level) and this value is used to identify the
hearing threshold level of an individual. This level
represents the higher intensity of sound to be
perceived by a subject, compared with people who
have a normal hearing level.
For this work, a modified audiometer called
TLTS (Tomatis, 2016) has been used, which is
based on the use of de SPL (Sound Pressure Level)
values as the difference between the pressure
produced by a sound wave and the barometric
pressure. TLTS was designed by Dr. Alfred Tomatis
using a curve of absolute hearing threshold values
and it is used for performing a specific listening test
that registers hearing levels once these are almost
inaudible. The listening test evaluates an
individual’s auditory thresholds in terms of
frequency, ability to identify the source of sounds,
ability to discriminate between frequencies, and
auditory laterality. The analysis of the resulting
curves serves to determine the person’s quality of
listening and from this to induce a psychological
profile. This kind of tests has been performed by
professionals of the Isora Solutions company who
are participating in a research project about the
effect of neurosensory stimulation to improve
listening skills (Perez et al., 2016). There are
multiple types of actions which can be performed to
determine subject's hearing levels in this context.
Next subsections describe such actions and the
obtained outcomes to be further processed.
2.1 Audiometric Tests
Four main types of audiometric behavioural tests
have been performed which address different
hearing parameters:
Thresholds
Laterality
Selectivity
Availability
Threshold of hearing is the minimum sound of level
that a human ear can perceive in a certain frequency
band and it is considered as a measure of hearing
sensitivity. This kind of sensitivity can be
represented using a chart called audiogram that
displays the audible threshold intensity for
standardized frequencies. Figure 1 shows an
example of audiogram that represents intensity
thresholds measured using dB SPL values (displayed
on the vertical axis), which change as frequency
ranges from 250 to 8000 Hz (horizontal axis). In this
audiogram, blue lines are associated to the air
conduction while red line symbols refer to the bone
conduction and the green line to the availability.
Both via air and via bone conduction (using a
vibrator placed on the top of the head) are the main
data sources in the TLTS tests. It is important to
remark the difference in the sound speed of the two
mediums since the travelling time of the bone
conduction to the brain is assumed to be faster that
the air conduction. According to Dr. Tomatis, the
bone conducted sound serves as a wakeup call to
prepare the brain for incoming sound. Then, the
delay between bone and air-conducted sound has to
be measured.
SIGMAP 2017 - 14th International Conference on Signal Processing and Multimedia Applications
26
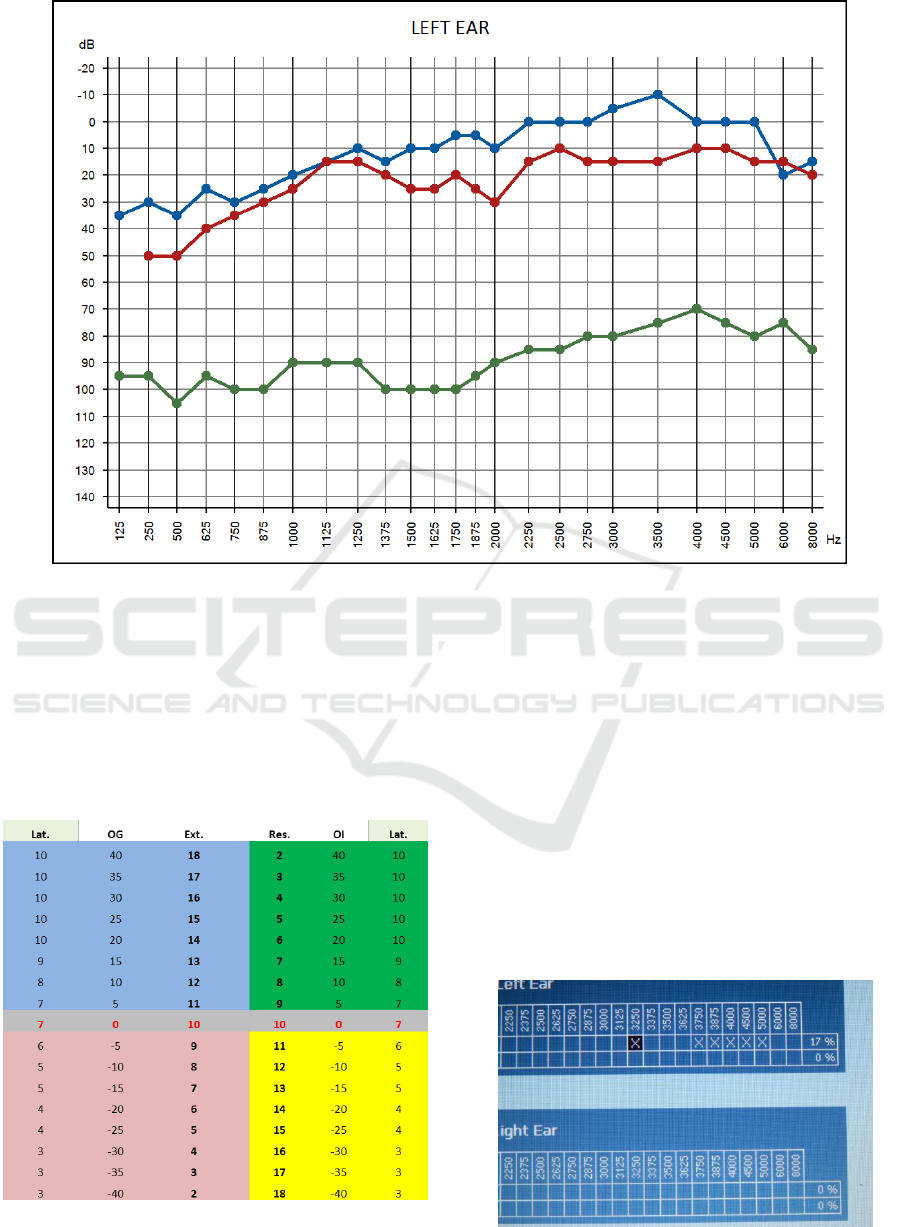
Figure 1: Sample of TLTS audiogram to display Threshold curves.
The second test is based on checking laterality,
which is only obtained from a TLTS device, as a
measure to observe how humans focus their hearing
on one ear (left or right). This measure uses two
main values called Extraction (Ext.) and Resistance
(Res.) representing the laterality profile. Figure 2
shows a table that allows the matching between
these two values and the laterality levels.
Figure 2: Laterality TLTS dataset.
Selectivity refers to the ability to differentiate the
pitch of sounds in relation to each other, but also the
direction of variation in pitch. The selectivity test
determines the maximum opening of the subject’s
auditory that is obtained by the frequencies in which
some kind of barrier is detected.
In this case, selectivity is obtained from 35
frequency options. Each of these values can be
marked when a hearing misunderstanding is
detected. An overall percentage of marks can be
computed from this test. The higher is this
percentage, the lower is the subject’s level of
listening and memory abilities. Figure 3 shows a
sample of this test where a barrier mark is observed
for the left ear in the 3250 Hz frequency,
Figure 3: Selectivity test sample.
A Computer-based Framework to Process Audiometric Signals using the Tomatis Listening Test System
27
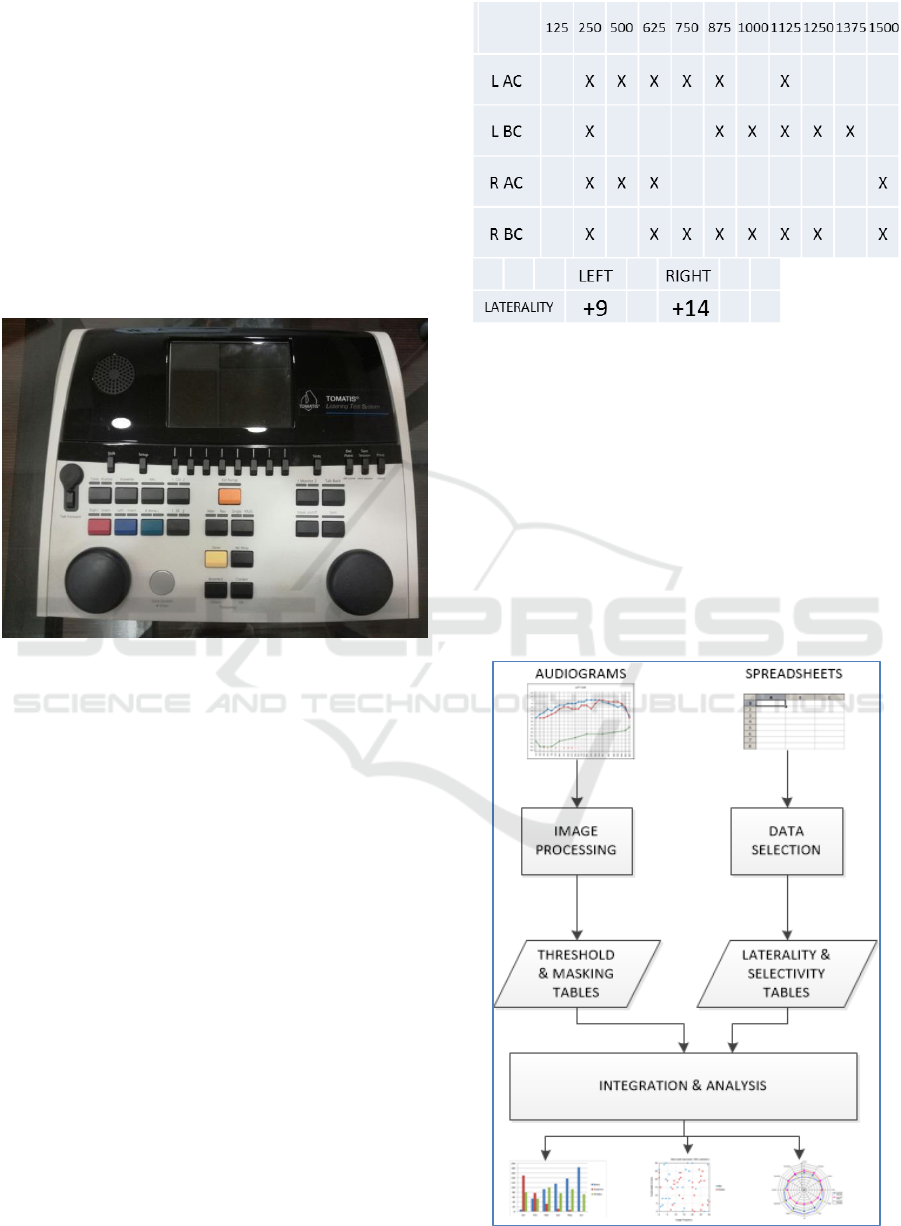
These tests were implemented with the help of
the TLTS device, such as the one displayed on
Figure 4. This type of device determines hearing
levels, but also measures the ability to discriminate
between different sound intensities. The TLTS offers
built-in wavefiles for a variety of speech extended
high frequency evaluation and PTA calculations. It
provides features to process speech information
through live voice, mp3 recordings and wavefiles as
well as word recognition capabilities. For tone
analysis, several air conduction and bone condition
mechanisms are addressed, and the possibility to
manage masking information.
Figure 4: Picture of a TLTS device.
2.2 Test Outcomes
This subsection describes some of the outcomes
obtained in the TLTS process. Such outcomes are
divided in two categories: spreadsheets files and
image files. Intensity thresholds and availability are
represented by means of audiogram charts such as
the one displayed on Figure 1. The upper area shows
two polygonal lines that represent those threshold
diagrams associated to the air conduction (blue line)
and bone conduction (red line) for the right ear in
this case. The lower area shows a set of characters
that represent special situations in a hearing scenario
Laterality and selectivity data are stored on
spreadsheets files in a tabular format such those
displayed on Figure 5. The first table shows part of
the values returned by the audiometer that compute
selective frequencies for the left ear either in air
conduction test (LAC) or bone conduction (LBC),
and, similarly, for the right ear (labelled as RAC and
RBC, respectively).
Figure 5: Selectivity and Laterality data tabular display.
3 FRAMEWORK DESCRIPTION
The framework proposed in this work deals with
processing the different signal sources mentioned in
previous sections. Figure 6 shows an overview of the
framework functionality. It is structured in two main
flows: the first one addressed to process the
audiogram images and the second one in charge of
selecting spreadsheet data. The results of both flows
are integrated in order to analyse and interpret them.
Figure 6: TLTS Framework overview.
SIGMAP 2017 - 14th International Conference on Signal Processing and Multimedia Applications
28
3.1 TLTS Processing
TLTS processing is based on the use of OpenCV
(Open Source Computer Vision Library). OpenCV is
an open source computer vision and machine
learning software library that was built to provide a
common infrastructure for computer vision
applications. It has C++, C, Python, Java and
MATLAB interfaces and works on multiple
operating systems. This library provides several
features that help to gather quantitative information
from different kinds of images. In the current case,
images come from audiograms such as the one
displayed on Figure 1 and the use of OpenCV
enables to get the locations of points that compose
the audiometric lines.
These locations assign values of intensity
thresholds (measured in dB) for each frequency
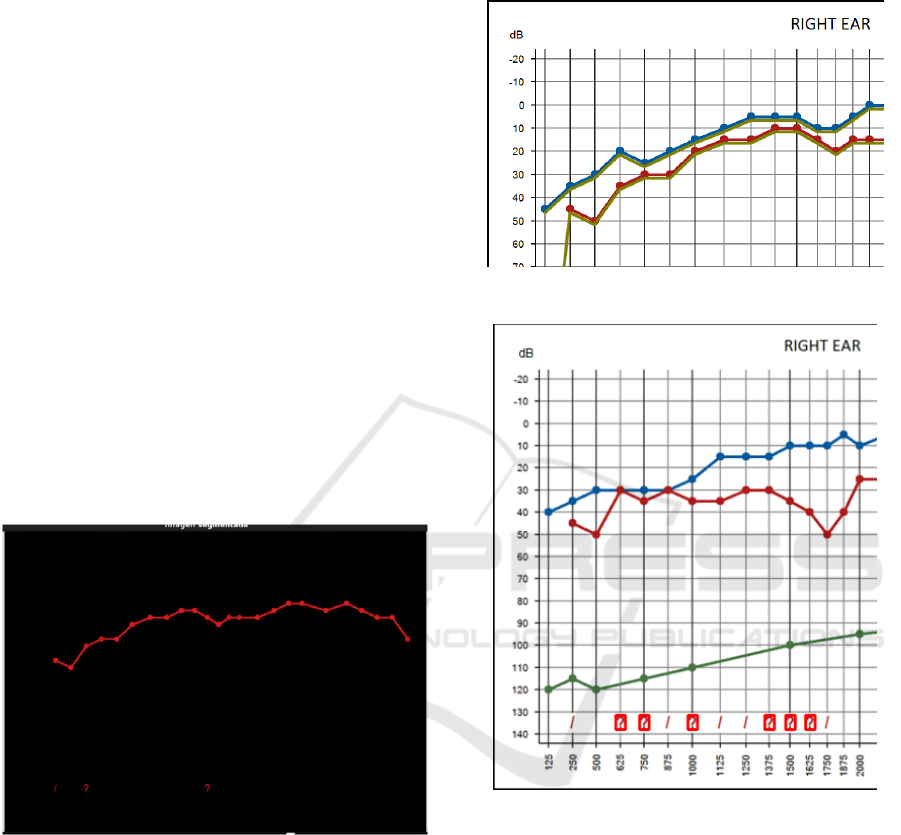
value in the horizontal axis. Original audiogram
images are bitmaps of resolution 1200x850 pixels. A
first processing step consists in identifying each of
the lines by colour, and segmenting it from the rest
of the image. Figure 7 shows the red line that
represents the threshold bone conduction line in the
target audiogram.
Figure 7: Segmented TLTS image.
The second step is about computing the
measured values of each point of a segmented line.
Checked points for each of the values of the
frequencies can be located from the analysis of the
labels in the horizontal axis, providing a frequency
value in Hz. By projecting these point locations in
the vertical axis, the dB value can be computed. In
order to find such points a template matching
process is performed do detect the point shapes. The
coordinates of the center of mass of these shapes are
returned using an iterative sequence over the
audiogram colour lines. Figure 8 shows a part of the
audiogram in which a green line is marking the
detected points.
Figure 8: Point shape detection.
Figure 9: Segmentation of sound TLTS spatialization.
A similar matching procedure is used to filter the
spatialization symbols as they are displayed on
Figure 9, in which “?” characters are marked within
red squares. At the end of the image processing,
tabular formats with the collected data are produced
and converted to text files (e.g. csv documents).
3.2 Spreadsheet Processing
The process of gathering information from
spreadsheets is based on the use of scripts which
allow researchers to get a web view of audiometric
data.
Figure 10 shows an example of screenshot that
displays Laterality values from a selected dataset.
A Computer-based Framework to Process Audiometric Signals using the Tomatis Listening Test System
29
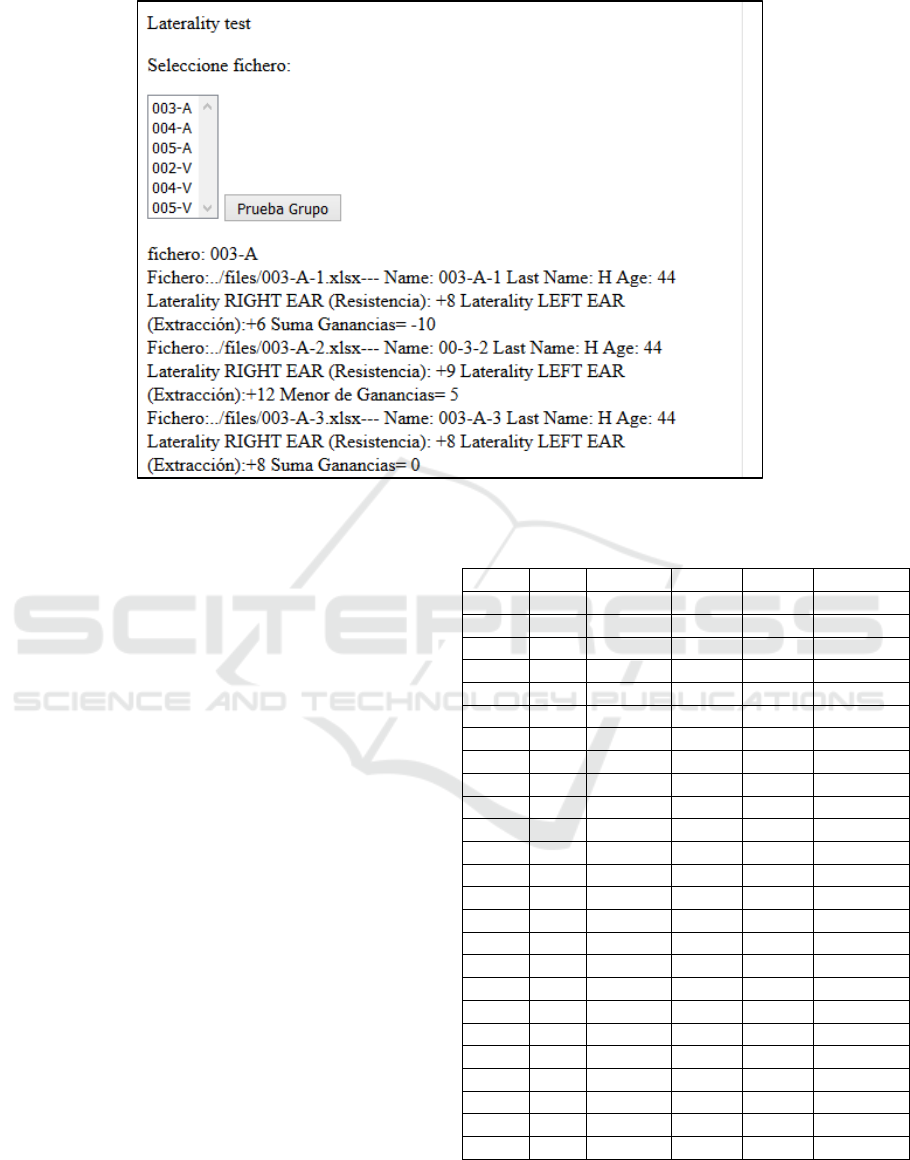
Figure 10: Script outcomes for selecting laterality data items.
These scripts provide access to spreadsheet files
either individually or gathering a set of them, in
order to get and retrieve the relevant data items and
store such items in tabular formats ready to be
analysed in further steps.
4 RESULTS
Results obtained by the framework components are
evaluated in this section. With this aim, several
experiments have been implemented that check the
framework accuracy and adequacy for processing
audiometry TLTS signals. These samples represent
different measures of audiometric tests that were
available in a tabular format after the framework
application.
A first evaluation consisted in comparing values
obtained from processing audiograms with original
tabular values. Table 1 shows a list of threshold
values coming from audio conduction tests for a
specific subject whose audiograms were processed
using the framework. These values are structured
into several columns that display the audiogram
frequency, the threshold data for the Left ear on Air
Conduction (LAC), or Bone Conduction (LBC), the
extracted points (Ext.) from both graph audiograms,
and the Average difference between these data.
Table 1: List of threshold values (measured and extracted).
Freq.
LAC
Ext.
LBC
Ext.
Avg.Dif..
125
55
54,915
0
0
0,0425
250
40
39,783
50
49,953
0,132
500
50
49,953
60
59,876
0,0855
625
30
30,109
45
44,744
0,0735
750
30
29,86
45
44,744
0,198
875
35
34,822
40
39,783
0,1975
1000
35
34,822
40
39,783
0,1975
1125
15
14,729
35
34,822
0,2245
1250
15
14,729
20
19,69
0,2905
1375
15
14,729
20
19,69
0,2905
1500
10
9,767
25
24,899
0,167
1625
15
14,729
20
19,69
0,2905
1750
15
14,729
15
14,729
0,271
1875
20
19,69
25
24,899
0,2055
2000
15
14,729
25
24,899
0,186
2250
0
-0,155
20
19,69
0,2325
2500
5
4,806
15
14,729
0,2325
2750
10
9,767
15
14,729
0,252
3000
15
14,729
15
14,729
0,271
3500
15
14,729
15
14,729
0,271
4000
20
19,69
15
14,729
0,2905
4500
25
24,899
20
19,69
0,2055
5000
20
19,69
30
29,86
0,225
6000
35
34,822
30
29,86
0,159
8000
35
34,822
30
29,86
0,159
SIGMAP 2017 - 14th International Conference on Signal Processing and Multimedia Applications
30
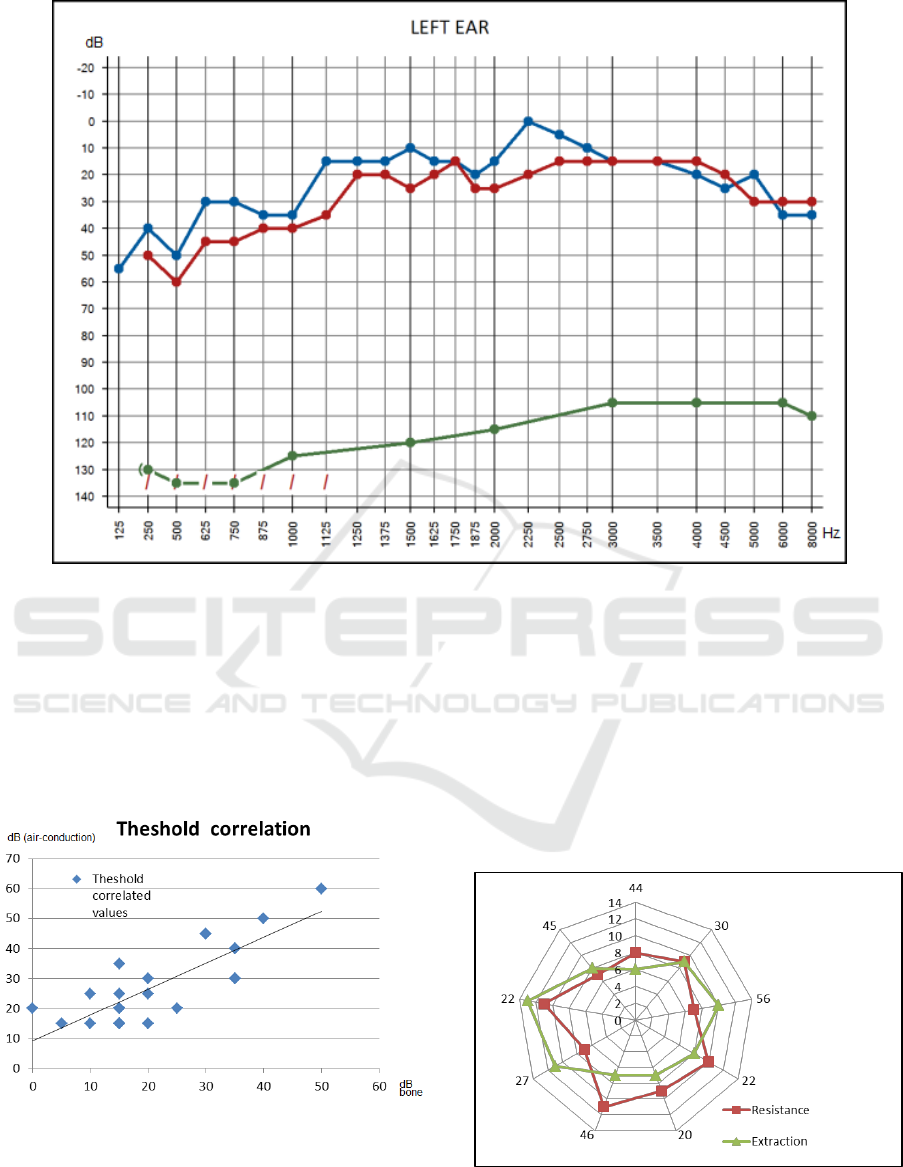
Figure 11: Audiogram processed sample with detection of threshold curves.
Such list of values is based on the audiogram
sample displayed on Figure 11 and the average
difference is less than 0.3 in every processed data
item either for air or bone conduction. These
threshold data items can be further processed to
analyse their correlation using a scatter chart such
the one displayed on Figure 11 that displays the
relationship between air and bone sound conduction.
Figure 12: Correlation of TLTS threshold curves.
The results of processing spreadsheets files are
also addressed in the framework evaluation. These
files store information about audiometric parameters
such as Laterality and Selectivity issues together
with additional user information (e.g. Age). An
example of Laterality profile regarding a specific
subject is displayed on Figure 10. The framework
can provide a collection of different subject profiles
in order to allow their analysis. Figure 12 shows a
radar chart that displays the relationship between the
values of Resistance and Extraction as Laterality
parameters and the age of nine subjects in a study
sample.
Figure 13: Analysis of TLTS laterality information.
A Computer-based Framework to Process Audiometric Signals using the Tomatis Listening Test System
31
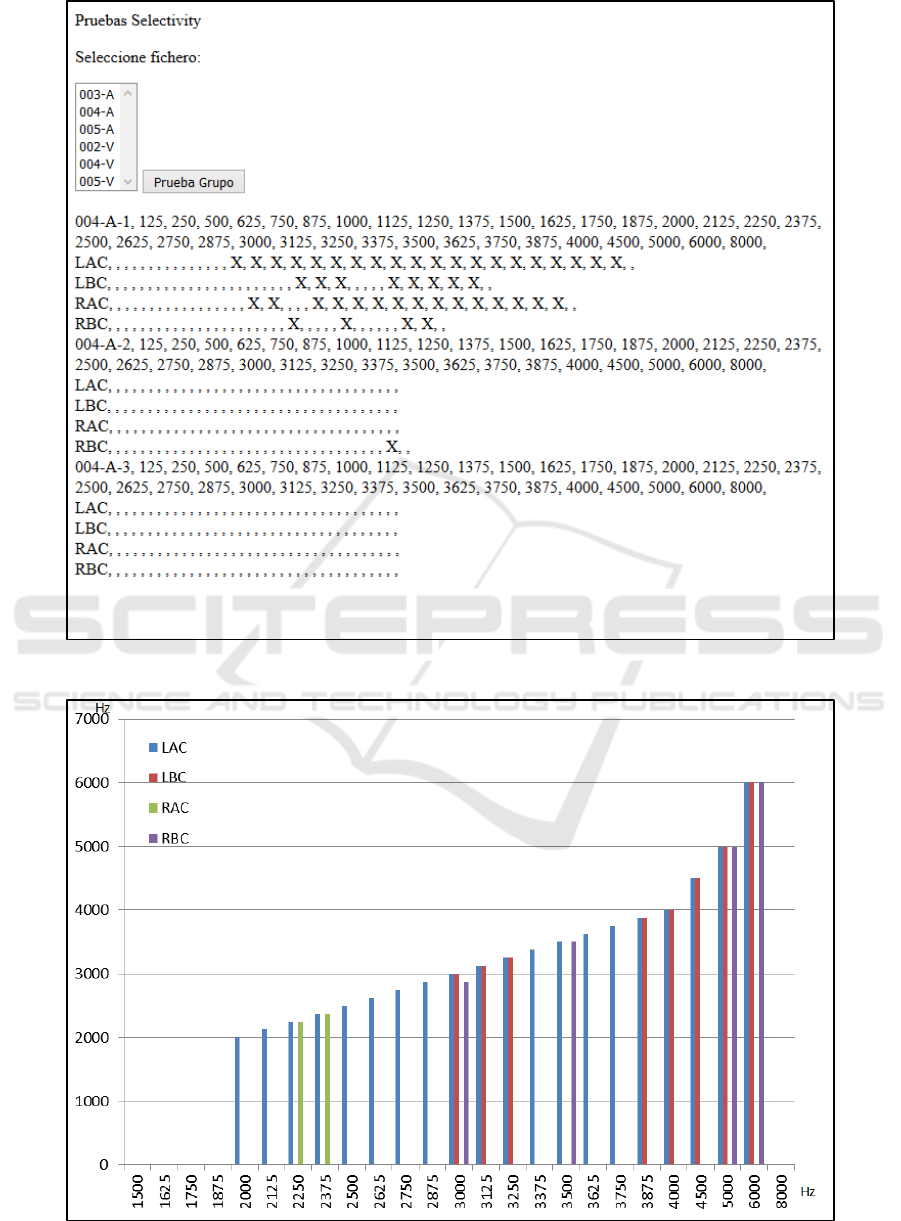
Figure 14: Script outcomes displaying the collection of selectivity data items.
Figure 15: Selectivity bar chart to display threshold distribution.
SIGMAP 2017 - 14th International Conference on Signal Processing and Multimedia Applications
32
selectivity information can also be analysed using
the spreadsheets processed in the framework.
For example, Figure 14 shows the display of
frequencies that were marked in a specific
Selectivity case and
Figur represents the bar chart for that case in
which frequencies associated to air sound
conduction in the left ear (LAC) and the right ear
(RAC) are compared with those produced via bone
sound conduction (LBC and RBC, respectively).
5 RELATED WORKS
Computer-based frameworks for managing and
processing audiometry signals are rather unusual as
long as these signals have a strong link with
audiometers or specific devices that generate and
produce them. Some organizations such as NCHAM
at Utah University or HIMSA
1
have implemented
software to provide audiology professionals with
systems to manage patient information. In the case
of NCHAM, they provide HiTrack
2
as an Early
Hearing Detection and Intervention (EHDI) Data
Management System to screen and register relevant
hearing information.
One of the HiTrack main advantages is the
possibility to connect with screening equipment
coming from multiple manufacturers. HIMSA has
developed NOAH as an integral framework allowing
“hearing instrument fitting, audiologic measurement
and database management system”. This software is
able to store patients’ audiologic profiles from
different suppliers and also record notes regarding
patient sessions.
Additionally, the Audiology and Speech
Pathology Software Development Group at
Memphis State University developed a program for
the Abbreviated Profile of Hearing Aid Benefit (Cox
and Alexander, 1995) to document the outcome of a
hearing aid fitting and to compare and evaluate the
same fitting over time.
Otherwise, manuals and audiometry guides can
be found (NCHS, 2016) but they are usually limited
to establish procedures and recommendations in the
use of instrumentation or how to record audiometry
results. There are authors such as Dau (2008), and
Jepsen et al., (2008) who have proposed models for
auditory processing and, in the last case, their
authors include a Computational Auditory Signal
Processing (CASP) framework that was
implemented in Matlab / Octave scripting language.
1
https://www.himsa.com/
2
http://www.hitrack.org
However, these models are usually focused on
specific aspects like masking in human listeners. In
this sense, Heinz (2010) also presented a
computational model of sensorineural hearing loss.
This work focused in the context of a sensorineural
stimulation project with the aim to process a wide
spectrum of audiometry signals beyond the typical
hearing loss situations. Therefore, the priority was to
introduce a framework that could be adapted to
process alternative source of data, either in tabular
format or using image files, and provide audiology
researchers with computer tools to analyse them.
6 CONCLUSIONS
The current work has presented a computer-based
framework that deals with the processing of
audiometry signals coming from different data
sources. These audiometry signals have been based
on audiogram images and spreadsheet files produced
by the TLTS device that were addressed to specific
hearing tests. Obtained outcomes show the wide
range of possibilities of the proposed framework to
compute these data sources and contribute to
improve the assessment of hearing tests using them.
For example, by determining the accuracy in the
processing of audiogram charts whose data can be
used for statistical studies. Another framework
contribution is its potential to retrieve multiple data
sources and combine them to produce graphic charts
that allow audiologists to easily envision hearing test
outcomes. This feature remarks the framework
adaptability to fit processing functions according to
the required needs. Further works plan to
incorporate new processing procedures and integrate
them in a Web portal that enables a universal access
to the framework services.
ACKNOWLEDGEMENTS
Thanks to the support of the Research Project
“Neurosensorial Stimulation for the Integration of
English Language” Universitat Politècnica de
València & Isora Solutions, 2016, the Computer
Engineering department (DISCA) and the ETSINF
(Escola Tècnica Superior d’Enginyeria Informàtica)
at the Universitat Politècnica de València.
A Computer-based Framework to Process Audiometric Signals using the Tomatis Listening Test System
33

REFERENCES
Boothroyd A., 2006. CasperSent: an example of computer-
assisted speech perception testing and training at the
sentence level, Phd thesis.
Convery E., Keidser G., Seeto M., Freeston K., Zhou D.,
Dillon H.,2014. Identification of conductive hearing
loss using air conduction tests alone: Reliability and
validity of an automatic test battery. Ear and Hearing
35(1): 1–8.
Cox R M, Alexander G C. The abbreviated profile of
hearing aid benefit. Ear Hear 1995; 16: 176–186.
Dau, T., 2008. Auditory processing models. In D.
Havelock, S. Kuwano, & M. Vorländer (Eds.),
Handbook of signal processing in acoustics, Vol. 1
(pp. 175–196). New York: Springer.
Eisenberg L.S., Martinez A.S., Boothroyd A., 2007.
Assessing auditory capabilities in young children. Int.
Journal Pediatr Otorhinolaryngol; 71: 1339–1350.
Fernández A., Ortega M., Penedo M.G., 2014. Computer
Aided Hearing Assessment: Detection of Eye Gesture
Reactions as a Response to the Sound. In: Campilho
A., Kamel M. (eds) Image Analysis and Recognition.
ICIAR 2014. Lecture Notes in Computer Science, vol
8815. Springer, Cham.
Heinz M.G., 2010. Computational modelling of
sensorineural hearing loss, Computational models of
the auditory system.eds. Meddis R, Lopez-Poveda EA,
Popper AN, Fay RR (Springer, New York), pp. 177–
202.
Jepsen M.L, Ewert S.D, Dau T., 2008. A computational
model of human auditory signal processing and
perception. J. Acoust Soc AM in press, 124(1).
MacKersie C.L., Boothroyd, A., Minnear. D., 2001.
Evaluation of the Computer-Assisted Speech
Perception Test (CASPA) Journal Am. Acad. Audiol.,
pp. 390–396.
Mahomed F., Swanepoel D.W., Eikelboom R.H. & Soer S.
2013. Validity of automated threshold audiometry: A
systematic review and meta-analysis. Ear Hear, 34,
745–752.
Mendel, L.L., 2007. Objective and subjective hearing aid
assessment outcomes. American Journal of Audiology,
16, 118-129.
NCHS, 2016. Audiometry Procedures Manual. National
Center for Health Statistics. https://wwwn.cdc.gov
/nchs/data/nhanes/2015-2016/manuals/2016_
Audiometry_Procedures_Manual.pdf
Perez, C., Garcia, C., Conejero, M., Capitán, A., Cerna,
H., 2016. Neurosensorial Stimulation for the
Integration of English Language. http://www.tomatis.
com/es/el-metodo-tomatis/actualidad/neurosensorial-
stimulation-for-the-integration-of-english-language-
en.html
Tomatis, 2016. User manual (Level II. TLTS).
www.centroauditivo-valencia.es.
SIGMAP 2017 - 14th International Conference on Signal Processing and Multimedia Applications
34
