
Churn Prediction for Mobile Prepaid Subscribers
Zehra Can
1,2
and Erinç Albey
1
1
Industrial Engineering, Özyeğin University, İstanbul, Turkey
2
Business Intelligence Team, Turkcell Technology Research and Development Inc., İstanbul, Turkey
Keywords: RFM, Prepaid Subscriber, Telecommunication, Pareto/NBD, Logistic Regression, Mobile.
Abstract: In telecommunication, mobile operators prefer to acquire postpaid subscribers and increase their incoming
revenue based on the usage of postpaid lines. However, subscribers tend to buy and use prepaid mobile lines
because of the simplicity of the usage, and due to higher control over the cost of the line compared to postpaid
lines. Moreover the prepaid lines have less paper work between the operator and subscriber. The mobile
subscriber can end their contract, whenever they want, without making any contact with the operator. After
reaching the end of the defined period, the subscriber will disappear, which is defined as “involuntary churn”.
In this work, prepaid subscribers’ behavior are defined with their RFM data and some additional features,
such as usage, call center and refill transactions. We model the churn behavior using Pareto/NBD model and
with two benchmark models: a logistic regression model based on RFM data, and a logistic regression model
based on the additional features. Pareto/NBD model is a crucial step in calculating customer lifetime value
(CLV) and aliveness of the customers. If Pareto/NBD model proves to be a valid approach, then a mobile
operator can define valuable prepaid subscribers using this and decide on the actions for these customers, such
as suggesting customized offers.
1 INTRODUCTION
Under today’s challenging market conditions,
competitions become more and more important for
companies. The attention of a customer is disturbed
by the competitors. Therefore the companies must be
proactively analyze their customer behavior based on
their CRM and behavioral data and offer the customer
the best product or service to keep their attraction.
Satisfaction with the product or service improves the
loyalty of the customer with the brand. Customer
loyalty encourages customer to spend more money
with the company’s product and services, thus the
revenue of the firm grows.
In mobile sector the churn rate of the customers
are more dynamic than the other sectors. Especially
predicting the behavior of the prepaid subscribers are
more difficult than postpaid subscribers. Usually, it is
accepted that prepaid subscribers individually
generate less revenue than postpaid subscribers, as a
result of those, operators mostly focus on the postpaid
subscribers. However, in Turkey in last years,
proportionally the volume of the prepaid subscribers’
number converges to the postpaid subscribers’
number so the prepaid revenue cannot be ignored.
The trends of the postpaid and prepaid subscribers
can be seen in Figure 1. This market data is published
quarterly to report the market trends in mobile sector
by BTK knowns as “Bilgi Teknolojileri Kurumu”
which is the Governmental Organization of
Information Technologies.
Figure 1: Postpaid Prepaid Subscriber Trends in Turkey
Published By BTK.
One of the main question is who can be targeted
and what can be offered to these subscribers, to keep
them alive and make them satisfied and loyal
customers, that is postpaid subscribers.
Can, Z. and Albey, E.
Churn Prediction for Mobile Prepaid Subscribers.
DOI: 10.5220/0006425300670074
In Proceedings of the 6th International Conference on Data Science, Technology and Applications (DATA 2017), pages 67-74
ISBN: 978-989-758-255-4
Copyright © 2017 by SCITEPRESS – Science and Technology Publications, Lda. All rights reserved
67

In this paper, we focus on the prepaid subscribers
who have a non-contractual relation with the
company and company cannot observe the time when
the customer “dies”. The characteristic of the prepaid
subscribers’ behavior can be defined simply with the
recency, frequency, and monetary (RFM) data. RFM
analysis was probably the first “predictive model”
used in database marketing (Neslin et al., 2008). The
RFM values of a customer provide insight about
customers tendency to contact with the company
again. Recency gives what is the last time the
customer buys product or service from the company.
The customer who has the most recent transaction has
the highest probability to buy from you again. The
customer who has frequent contact with the company
has the highest probability to come back to the
company and lastly the customer who spends more
than other customers, has the highest probability to
spend more in the future. RFM model classifies the
customers into groups which the company can use in
targeting their product or service offers.
Pareto/NBD model (Schmittlein et al., 1987) is
specifically designed to handle the RFM values in a
way to generate individual level predictions for the
churn tendency. In addition to churn prediction,
Pareto/NBD model can be used to predict activeness
level of the customers and life time values.
As mentioned above, prepaid subscribers are
potential postpaid subscribers. RFM data as a base
data for Pareto/NBD model can be used by the mobile
operator to offer their products or services or switch
to an appropriate postpaid line offer. Thus the RFM
data can be used for Pareto/NBD model to define the
subscriber’s behavior.
2 BACKGROUND
Prepaid subscribers have to first make top-up before
making calls. Usage behavior of prepaid subscribers
differs from each other. The credit is purchased at any
time whenever the subscriber decides to. In Turkish
mobile market if the mobile subscribers does not
make any top-up, the line contract is terminated by
the mobile operator. The period for the cancellation
of the subscriber line contract is 270-days after the
last purchase. However, the operator never knows
when the subscriber would do the last credit purchase.
Hence, the subscriber behavior can be easily defined
with only recency/frequency data and Pareto/NBD
model can give the probability of a customer being
alive and the expected number of transactions for a
customer. Based on these valuable data a mobile
operator can calculate the “Customer Life Time
Value” and monetary value of a customer. (Fader et
al., 2005b)
2.1 Pareto/NBD Assumptions
The Pareto/NBD model is defined by SMC
(Schmittlein, Morrison and Colombo) to model the
repeat purchase for a non-contractual customers
(Schmittlein et al., 1987). SMC states the model has
several assumptions regarding customers:
Individual customer;
Poisson Purchases: While alive, each customer
makes purchases according to a Poisson process
with rate λ.
Exponential Lifetime: Each customer remains
alive for a lifetime which has an exponentially
distributed duration with death rate µ.
Heterogeneity across customers;
Individuals' purchasing rates are distributed
following Gamma distribution with rate λ
Customers is distributed according to a gamma
distribution across the population of customers
(NBD distribution).
Death rates also follow a Gamma distribution with
rate µ, and customers have different gamma
distribution across (Pareto distribution).
Rates λ and µ are independent: The purchasing
rates λ and the death rates µ are distributed
independently of each other.
By using these distributions on the basic RFM data,
SMC derived expressions for (Fader et al., 2005)
The probability of a customer is still alive,
The expected number of future transaction for a
customer.
2.2 RFM Analysis
RFM data includes the transactional data of the
customers. Recency can be calculated by the date of
the customers’ last transaction data, frequency can be
calculated by the count of the customers’ transaction
which fall into between the first transaction date and
last transaction date of the subscribers’ lifecycle and
the monetary value gives the transaction amount of
the subscriber. This is the simplest way which can be
used to define the non-contracted customers’
behavior.
The RFM values can be also used to segment
customers to identify the customers who have the
highest probability to respond to campaigns. By using
the RFM calculation, each subscriber would have a
value score assigned to them.
DATA 2017 - 6th International Conference on Data Science, Technology and Applications
68

The score is calculated first by dividing the
customers in quintiles then the recency, the frequency
and the monetary value of the customers are scored
beginning from 5 to 1 in descending order. The
customer who has the most recent value is scored with
5 then the less recent customers are scored with the
following numbers 4,3,2,1. The same method than
applied to the frequency and the monetary values of
each customer. At the end, each customer has a score
from 555 to 111. Totally, there could be 125 buckets
in which the customers are segmented. The customers
in the RFM bucket which is 555, could have the
highest probability to respond the campaigns (Birant,
2011).
2.3 Logistic Regression
Logistic regression measures the relationship
between categorical dependent variable and the
independent variables. The independent variables can
be one or more. The function which is used to
calculate the probability of the relation between the
dependent and independent variables is logistic
function. Logistic regression is one of the most
powerful methods to calculate the probability of an
event.
In this paper logistic regression is used to
benchmark the Pareto/NBD model. First logistic
regression is applied to the based RFM data and then
applied to other calculated variables which will be
explained in the following section.
3 RELATED WORKS
The activation of the prepaid subscribers can be
defined as non-contractual process. They stay alive
while continuing to purchase from the mobile
operator. There are some purchasing actions that
resets their 270-day period to zero day and the
subscriber continues to generate revenue. Otherwise,
they become inactive at the end of the 270-day period.
The importance is that the churn rate is higher
than the churn rate of the postpaid subscribers.
Increasing the customer loyalty or offering new
product services to the loyal customers will give the
control to the mobile operator rather than the
customer.
There are a lot of modelling works with postpaid
subscribers in mobile sector. However, defining and
managing prepaid subscribers’ future value is harder
than postpaid ones because of their unobserved
behavioral format.
There is a publication about this behavior of pre-
paid subscribers (Dairo et al., 2014). They use
decision tree algorithm to segment the prepaid
subscribers to define who are going to churn based on
CDR and SIM data.
There is a similar work as mentioned above. The
data set in this study (Owczarczuk, 2010) includes
prepaid subscribers model variables. The churn
prediction is done by using the logistic regression,
linear regression and Fisher linear discriminant
analysis and decision trees.
There are other studies for mobile operator churn
prediction. However, most of them does not directly
focus on prepaid subscribers’ behavior (Khan et al.,
2015). In this study, specifically churn prediction is
studied based on CDR data without specifying any
customer base. They work on feature selection
methods and supervised learning algorithms to
predict the churn score for the subscribers.
(Kirui et al., 2013), (Lu, 2002), (Ahna et al., 2006)
are again the studies that focus on postpaid
subscribers churn propensities. Another paper
(Dahiya et al., 2015) again analysis the churn
prediction but does not define a customer base.
As stated at the beginning, prepaid subscribers can
be accepted non-contractual subscribers. In
marketing non-contractual based data can be widely
analyzed with RFM data (Birant, 2011), (Neslin et al.,
2008)
In this paper (Coussement et al., 2014), RFM
analysis, logistic regression and decision trees are
used to compare with each other based on the
accuracy of the data.
Some other publications also focused on the
performance of the churn prediction models.
(Keramatia et al., 2014) applies many data mining
methods to a mobile operator data. But the main focus
is to improve the model accuracy. (Olle G. et al.,
2014) used hybrid churn prediction model for prepaid
subscribers and compared the accuracy of the data
mining models. (Huang et al., 2013) proposed a
hybrid model for churn prediction.
Although there are many churn pediction
publications, there are a few with mobile prepaid
subscribers data. Most of them focuses on the
performance improvement of the data mining
methods. In this work, the power of RFM data is used
to predict prepaid subscribers’ behavior.
4 DATA PREPARATION
4.1 RFM Data
Pareto-NBD model uses RFM data. In this paper we
Churn Prediction for Mobile Prepaid Subscribers
69
analyze the active mobile prepaid subscribers. The
data is provided by one of the mobile operators in
Turkey. If prepaid mobile subscribes do not make any
top-up, their contract will end in a defined period of
time, 270 days in Turkish market. But you never
know when they will stop making top-up so when
they will end their contract. In this paper the RFM
data set includes prepaid mobile subscribers who
make their first activation with the prepaid charging
method and do not change their charging method in
the selected time interval. The selected time interval
is 2 year period from 1
st
of February, 2015 to 31
th
of
January, 2017.
The number of distinct subscribers is 386K. The
refill amount and refill count is calculated based on
the refill transactions. The number of transactions is
2.7M. The subscribers with no transactions are
eliminated from the base subscriber set after
elimination the observer subscribers with refill
transactions are 327K.The refill transactions for the
same subscriber on the same date are merged into one
record so the 2.700.349 record has become 2.578.681
distinct transactions.
For the simplicity of the model, not all the
transactions are fed into the PARETO/NBD model,
the data is split into 50 buckets with ORA-HASH
function. The size of the one of the bucket has
approximately 55K refill transaction and the distinct
subscriber is 6500. The model is run with 6 sets of
this data. Each transaction contains a “Subscriber Id”
which uniquely defines the customers, refill date the
date of the transaction, refill amount the amount of
refill transaction in TL in other words the monetary
value of the refill transaction. The data is order by
subscriber id and refill date in ascending. A small
sample is presented in Table 1.
Table 1: A small sample of the RFM Data.
Subscriber Id Refill Date Refill Amount (TL)
132047392 20160812 15
132047392 20160901 20
…… ….. ….
132054290 20150328 25
132054290 20150416 12
4.2 Subscriber Variables for Data
Models
For model benchmarking with logistic regression the
defined variables were prepared. Usage (Data, Voice,
SMS) behaviors,
1. Usage statistics which includes if the subscriber
has any usage in the last 3 months.
2. Refill behaviors which holds the sum of the last
12 months refill transaction amounts. The refill
transactions include both voice and data
separately.
3. Package usage properties which hold if the
subscriber make any package refill in the last 12
months.
4. ARPU (average revenue per user) properties
5. Call center and online interaction transaction
variables were also included.
The subscriber set for this variable is the same with
RFM data set. The variables are calculated in monthly
bases. The selected month is the last month before the
calibration date which is January of 2016.
5 EXPLAROTARY DATA
ANALYSIS
As mentioned in Section 4 six buckets of the
transaction data is used. %15 of the subscribers,
which is 59.810 subscribers, never made a top-up
during the selected period. They are removed from
the used data set. The basic properties of the data sets
are shown in Table 2.
Table 2: Basic properties of the selected data sets.
Transaction Coun
t
~50
K
Distinct Subscriber Count ~6.500
Minimum Refill Date 01.03.2015
Maximum Refill Date 31.01.2017
Days Between Dates 708
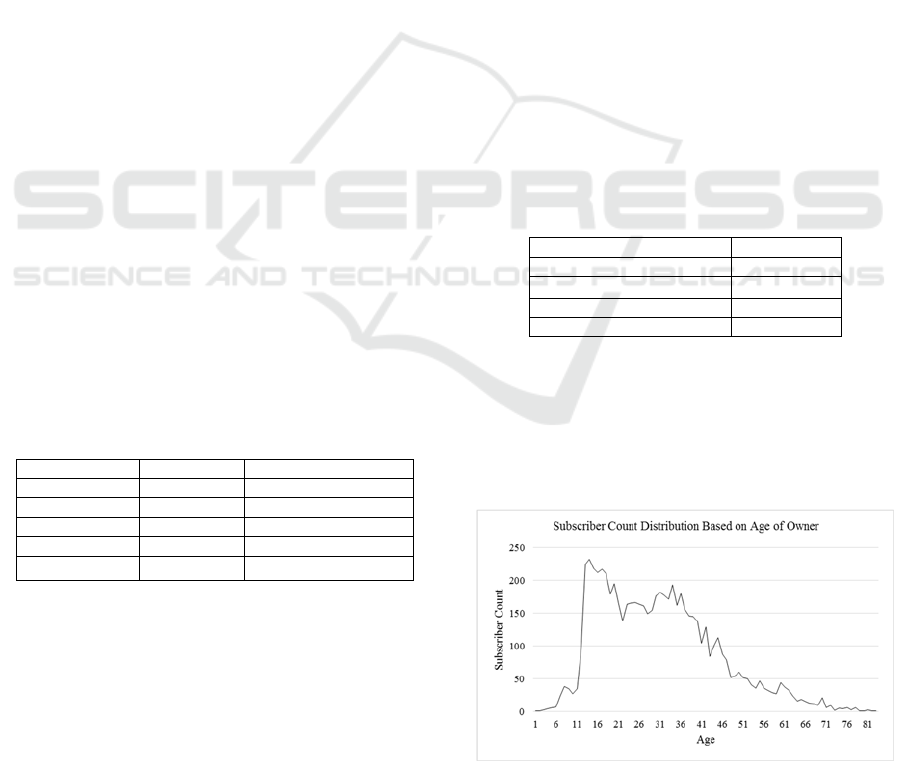
The refill subscriber’s behavior cannot be
estimated beforehand like postpaid subscribers. The
demographic information for the prepaid subscribers
usually differs from the postpaid ones. Mostly young
people prefer to use prepaid lines which is shown in
the Figure 2.
Figure 2: Subscriber Distribution Based on Age.
DATA 2017 - 6th International Conference on Data Science, Technology and Applications
70

The basic statistics of the sets are given below in
Table 3. The statistics are generated based on the
Refill Amount (TL).
Table 3: Basic statistics of the selected data sets.
Set Trans Min Max Mean Var Stddev
Set 1 53,320 2 180 24 122 11
Set 2 52,683 2 360 24 123 11
Set 3 53,091 1 180 24 123 11
Set 4 51,920 1 180 24 124 11
Set 5 53,900 1 360 25 130 11
Set 6 53,248 2 360 24 147 12
The statistics for the subsets are nearly the same
as the main set which has 2.7M transactions. This
ensures that we can use one of the subsets to create
the model. The 5
th
, 25
th
, 50
th
, 75
th
and 95
th
percentiles
of the sets are listed in Table 4.
Table 4: The distributions of the data sets.
Set Q5 Q25 Median Q75 Q95
Set 1 10 19 25 30 40
Set 2 10 19 25 30 40
Set 3 10 19 25 30 40
Set 4 10 19 25 30 45
Set 5 10 19 25 30 45
Set 6 10 19 25 30 40
Main 10 19 25 30 40
According to Table 5 it can be easily seen that the
sets are shown similar distributions. To see the
distribution of the subscriber behavior for the days
between transactions, we can see there is positive
skewness for the distribution of the days.
Table 5: Values of the days between transactions.
Set Min 1
st.
Qu. Median Mean 3
rd.
Qu. Max
Set 1 1 9 24 31.72 34 593
Set 2 1 9 24 31.93 34 515
Set 3 1 10 26 32.74 35 590
Set 4 1 10 25 32.45 35 545
Set 5 1 9 24 31.45 34 462
Set 6 1 9 25 32.21 35 536
6 RESULTS
BTYD (Buy Till You Die) package in R is used to
implement the Pareto/NBD model. The selected 6
sets are used to calculate the model parameters. The
estimated parameters are given below in Table 6.
Table 6: The calculated model parameters.
Set r alpha S beta LL
Set 1 1.8201 9.5895 9.5451 10,000.00 -31018
Set 2 1.7126 9.1458 10.9913 9,771.91 -30304
Set 3 1.7446 9.5094 7.7747 9,730.02 -31396
Set 4 1.6936 8.8990 0.0382 33.31 -30647
Set 5 1.6907 8.7533 9.2325 8,773.72 -31393
Set 6 1.7154 9.0818 7.3129 9,990.86 -31170
It can be seen that all the sets shows the same
behavior, the parameter estimation nearly gives the
same result for all of them. We prefer to use one of
the data set “Set 6” to calculate the probability of
aliveness of the subscriber. After calculating the
probability of aliveness of each subscriber in the
selected data set, we get the actual values for the 6480
subscriber’s contract status of the holdout period from
the database as of the end of the holdout period
“31.01.2017”. The distribution for the probability of
alive are given in Figure 3 below, the model predicts
most of the subscriber to be alive.
Figure 3: Probability of Alive Distribution.
To see if the transaction count has an effect on the
model results we decreased the transaction counts and
subscriber records from the RFM data set “Set 6”, the
model is applied on the new data set which is called
“Set 6 Limited”. The result count for the transaction
is 7007. The model was also tested without the
transactions on the 31
st
of March, 2017, because the
transactions are incomplete for this day, and generate
a sharp decrease at the end of the model. The set is
called “Set 6 without Last Day”. The model vs actual
comparison for weekly transactions is shown in
Figure 4, Figure 5 and Figure 6. Only “Set 6 Limited”
gives expected results in the test period because of the
limited transaction count. However, when the
estimated parameters for this set was applied to a
larger set, it was again observed that the model for the
test period failed.
Churn Prediction for Mobile Prepaid Subscribers
71
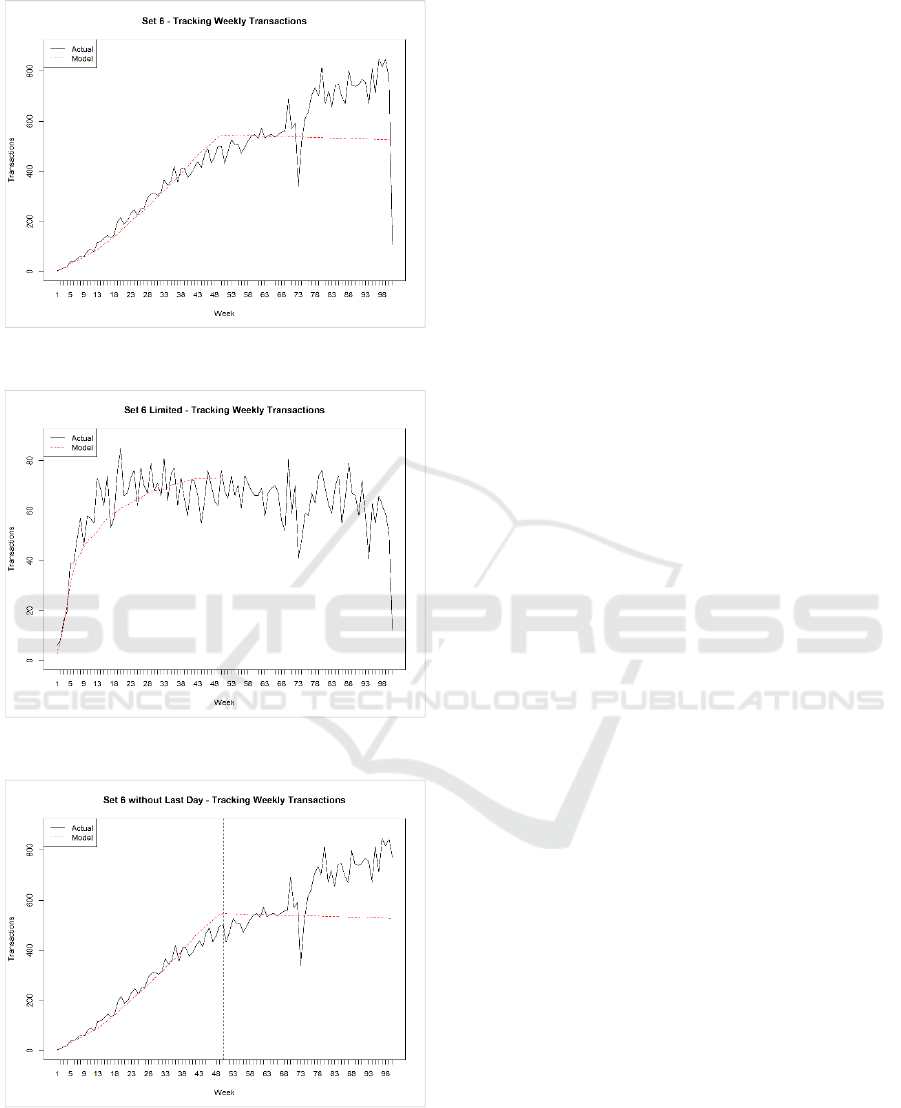
Figure 4: Model Actual Comparison – Set 6.
Figure 5: Model Actual Comparison – Set 6 Limited.
Figure 6: Model Actual Comparison – Set 6 without Last
Day.
Consequently, using Pareto/NBD model does not
give the expected results for the prepaid mobile
subscribers’ RFM data. Instead of concluding that the
model fails for prepaid subscribers, we decided to
benchmark the results of the aliveness of the
subscribers with the logistic regression. First we used
the RFM data only and then used the calculated
variables which include usage, refill call center, and
online interaction and ARPU information of the
subscribers with RFM values. The confusion matrix
values of the two model results are given in Table 7.
The Pareto/NBD model predicted almost all the
subscribers would be alive. So we do not share the
model performance values in the confusion matrix in
Table 7.
7 CONCLUSIONS AND FUTURE
WORK
In mobile industry, subscribers generate a lot of
transactions, and refill transactions of the prepaid
subscribers are not an exception. Although, the
behaviour of the prepaid subscribers seems
appropriate for the Pareto/NBD model, the parameter
estimation does not give expected results in
Pareto/NBD model.
In Figure 1, it can be seen that model fits well in
the calibration period but has a lot of deviation in the
hold out period. There is a sharp decrease around 74
th
week. When we investigate the data the refill
transactions actually dropped around these dates and
also there is nothing special with the days of that week
(from 17
th
of July -> 23
rd
of July, 2016) like official
holiday.
When the model is applied on the new data set
named “Set 6 Limited”, with limited transactions, the
model gives better result. The model is also tested
with the set named “Set 6 without Last Day”.
However, removing these transactions did not have
any effect on the model parameter estimation. We can
conclude that the model has some limitations with
large number of transactions. If the number of
transactions is large, the estimation of model
parameters converges to 10.000 for the “beta” value
and the model for test period fail.
The “optim” R function is used in the BTYD
package to estimate the model parameters. Although
the number of subscriber is not very large, the
function runs very slowly. 6480 subscriber chosen for
the package to run. But the estimation of parameters
took very long time approximately one and half hour
to calculate and beta value got the highest default
value as parameter value. For that reason the model
did not behave well for the test period.
DATA 2017 - 6th International Conference on Data Science, Technology and Applications
72

Table 7: Confusion Matrix.
As mentioned in the previous section, we also
wanted to see the results with “Logistic Regression”
applied to both RFM data and mining variables that
were prepared for the selected subscriber set. The
results which got from Logistic Regression model
which was run only with the RFM data has the highest
“Accuracy” value for the probability of aliveness
which can be easily seen from Table 7, the model
performance values for Logistics Regression with
RFM data performed better than Logistics Regression
with other variables. This shows that for prepaid
subscribers simply using the RFM Data will enable
the operators to be able to target the most responsive
subscriber population.
For future work the parameter estimation can be
developed for high volume of transaction especially
like mobile data which has high potential to generate
big data. If this parameter estimation would give
better results, the RFM data will be valuable
predictive model for the prepaid subscribers’
behaviour analysis in mobile sector. Because most of
the time, there is not much definitive data for the
prepaid subscribers.
Moreover, the Pareto/NBD model is base model
for the lifetime calculation of a customer. Therefore
one of the next step could be calculating LTV if the
parameter estimation problem is solved.
REFERENCES
Neslin, S., Blattberg, R. and Kim, B., 2008. Database
Marketing: Analyzing and Managing Customers.
Springer
Fader, P., Bruce H., and Ka, L., 2005b. RFM and CLV:
Using Iso-Value Curves for Customer Base Analysis.
Journal of Marketing Research, 42 (November), 415–
430.
Schmittlein, David C., Donald G. Morrison, and Richard
Colombo, 1987. Counting Your Customers: Who They
Are and What Will They Do Next? Management
Science, 33 (January), 1–24.
Fader, P., Hardie, B., 2005. A Note on Deriving the
Pareto/NBD Model and Related Expressions.
“http://brucehardie.com/notes/009/”
Pfeifer, P., Haskins, M. and Conroy, R., 2005. Customer
Lifetime Value, Customer Profitability, and the
Treatment of Acquisition Spending, Journal of
Managerial Issues, 17 (Spring), 11–25
Dairo, A. and Akinwumi, T. 2014. Dormancy Prediction
Model in a Prepaid Predominant Mobile Market: A
Customer Value Management Approach. International
Journal of Data Mining & Knowledge Management
Process (IJDKP) Vol.4, No.1.
Owczarczuk, M. 2010. Churn models for prepaid
customers in the cellular telecommunication industry
using large data marts. Expert Systems with
Applications, Volume 37, Issue 6, Pages 4710–4712,
Elsevier.
Khan, M., Manoj, J., Singh, A., Blumenstock, J., 2015.
Behavioral Modeling for Churn Prediction: Early
Indicators and Accurate Predictors of Custom
Defection and Loyalty. 2015 IEEE International
Congress on Big Data, pp. 677-680.
Kirui, C., Hong, L., Cheruiyot, W. and Kirui, H., 2013.
Predicting Customer Churn in Mobile Telephony
Industry Using Probabilistic Classifiers in Data
Mining. IJCSI International Journal of Computer
Science Issues, Vol. 10, Issue 2, No 1.
Lu, J., 2002. Predicting Customer Churn in the
Telecommunications Industry - An Application of
Survival Analysis Modeling Using SAS. SUGI 27, Data
Mining Techniques, Paper 114-27.
Ahna, J., Hana, S. and Leeb, Y., 2006. Customer churn
analysis: Churn determinants and mediation effects of
partial defection in the Korean mobile
telecommunications service industry.
Telecommunications Policy, Volume 30, Issues 10–11,
Pages 552–568, Elsevier.
Dahiya, K. and Bhatia, S. 2015. Customer Churn Analysis
in Telecom Industry. 4th International Conference on
Reliability, Infocom Technologies and Optimization
(ICRITO) (Trends and Future Directions), 1 - 6, IEEE.
Birant, D., 2011. Data Mining Using RFM Analysis.
Knowledge-Oriented Applications in Data Mining,
Prof.Kimito Funatsu (Ed.).
Neslin, S., Blattberg, R. and Kim, B., 2008. RFM Analysis.
Database Marketing Volume 18 of the series
Model Cut-Off TP TN FP FN Total Accuracy TP Rate FP Rate Precision
0.5 5439 725 223 93 6480 0.95 0.98 0.24 0.96
0.6 5379 735 213 153 6480 0.94 0.97 0.22 0.96
0.7 5284 756 192 248 6480 0.93 0.96 0.20 0.96
0.8 5150 782 166 382 6480 0.92 0.93 0.18 0.97
0.9 4782 826 122 750 6480 0.87 0.86 0.13 0.98
0.5 5531 0 948 1 6480 0.85 1.00 1.00 0.85
0.6 5531 0 948 1 6480 0.85 1.00 1.00 0.85
0.7 5531 0 948 1 6480 0.85 1.00 1.00 0.85
0.8 5530 0 948 2 6480 0.85 1.00 1.00 0.85
0.9 5525 6 942 7 6480 0.85 1.00 0.99 0.85
Log Reg with RFM
Log Reg with Variable
Churn Prediction for Mobile Prepaid Subscribers
73

International Series in Quantitative Marketing pp 323-
337. Springer.
Coussement K., Bossche F., Bock K., 2014. Data
accuracy's impact on segmentation performance:
Benchmarking RFM analysis, logistic regression, and
decision trees. Journal of Business Research, Volume
67, Issue 1, January 2014, Pages 2751–2758
Keramatia A., Jafari-Marandia R., Aliannejadib M.,
Ahmadianc I., Mozaffaria M., Abbasia U., 2014.
Improved churn prediction in telecommunication
industry using data mining techniques. Applied Soft
Computing, Volume 24, November 2014, Pages 994–
1012.
Olle G., Cai S., 2014. A Hybrid Churn Prediction Model in
Mobile Telecommunication Industry. International
Journal of e-Education, e-Business, e-Management and
e-Learning, Volume 4, Issue 1, Pages 55-62.
Huang, Y., Kechadi T., 2013. An effective hybrid learning
system for telecommunication churn prediction. Expert
Systems with Applications, 2013, Volume 40, Issue 40,
Pages 5635-5647.
DATA 2017 - 6th International Conference on Data Science, Technology and Applications
74
