
HAIT: Heap Analyzer with Input Tracing
Andrea Atzeni
1
, Andrea Marcelli
1
, Francesco Muroni
2
and Giovanni Squillero
1
1
DAUIN, Politecnico di Torino, Corso Duca degli Abruzzi 24, Torino, Italy
2
Independent Scholar, Torino, Italy
Keywords:
Heap, Exploit, Memory Profiler, Dynamic Symbolic Execution, Taint Analysis.
Abstract:
Heap exploits are one of the most advanced, complex and frequent types of attack. Over the years, many
effective techniques have been developed to mitigate them, such as data execution prevention, address space
layout randomization and canaries. However, if both knowledge and control of the memory allocation are
available, heap spraying and other attacks are still feasible. This paper presents HAIT, a memory profiler that
records critical operations on the heap and shows them graphically in a clear and comprehensible format. A
prototype was implemented on top of Triton, a framework for dynamic binary analysis. The experimental
evaluation demonstrates that HAIT can help identifying the essential information needed to carry out heap
exploits, providing valuable knowledge for an effective attack.
1 INTRODUCTION
An exploit is a combination of code and data that takes
advantage of a flaw in a system to cause an unin-
tended behavior, for instance, allowing to gain ille-
gitimate control over it. Memory exploits can target
different regions, namely the stack or the heap, and
can adopt different methods to circumvent operating
system (OS) defenses.
The development of an exploit consists of two
phases: the discovery of the vulnerability and the de-
sign of the code to take advantage of it. Manual vul-
nerability discovery is typically not an option since
too complex and time consuming. In order to find an
unexpected behavior, the target system can be mod-
eled (e.g. through symbolic execution), or stressed
with automatically generated inputs (e.g. by fuzzing).
Eventually, the development of the exploit leverages
the flaw discovered in the code, transforming the sys-
tem weakness into a concrete attack.
Buffer overflow attacks are one of the longest-
running, occurring, and damaging type of threats
(UKessays.com, 2015). In short, a buffer overflow ex-
ists whenever a program attempts to put more data in
a buffer than it can actually hold. This situation can
simply crash the component, or, more interestingly,
can be used to execute arbitrary code, thus gaining
the control over a service (MITRE, 2017). Roughly
speaking, two kinds of buffer overflow attacks exist:
stack-based and heap-based.
As a result of the progress in secure coding, in
static and dynamic application analysis and in OS-
level protection mechanisms, the recent attack trends
show that stack-based exploitation is becoming less
frequent in modern systems. On the other hand, the
heap is the most targeted element of software pro-
cesses (Rains, 2014): it can be either the core of the
vulnerability or just an auxiliary element in a more
complex exploit
1
. Corrupting the heap requires a
large amount of information and, due to the number
of variables and details involved, is much harder than
stack-based attacks. As the level of complexity of the
systems grows, developing a heap exploit by manu-
ally inspecting all the memory becomes less feasible
and ultimately depends on the analyst experience and
ability.
In order to discover the essential pieces of in-
formation required for the heap exploitation, we
surveyed different well-known techniques, either
generic, such as use-after-free and double-free, or tai-
lored to a specific allocator. Our research clearly
showed that all the attacks require two categories of
information: the list of changes in the layout of the
heap memory during execution and the knowledge
of how the program inputs influence the operations
on the heap. Since many attacks rely on a specific
memory layout, it is crucial to know the heap state at
each step of the execution, i.e. the exact position of
1
Like heap spraying in ASLR circumvention, quite a
common strategy in browser exploitation
Atzeni, A., Marcelli, A., Muroni, F. and Squillero, G.
HAIT: Heap Analyzer with Input Tracing.
DOI: 10.5220/0006420803270334
In Proceedings of the 14th International Joint Conference on e-Business and Telecommunications (ICETE 2017) - Volume 4: SECRYPT, pages 327-334
ISBN: 978-989-758-259-2
Copyright © 2017 by SCITEPRESS – Science and Technology Publications, Lda. All rights reserved
327

memory blocks, whether they are currently allocated
and all the associated metadata. Considering the high
level of sophistication of the attacks, a graphical rep-
resentation of the heap layout at each step is very use-
ful for the development of the exploit. Additionally,
the developer needs to understand how the program
inputs influence the heap layout, which is essential to
decide the exploitation technique to be used.
In this paper we present a methodology to auto-
matically gather information about the heap state and
the operations that are performed on it. While the idea
is general and can be applied to different architectures
and applications, the research tackled the exploit de-
velopment on Linux desktop applications.
We implemented the proposed methodology in a
proof-of-concept tool named HAIT (Heap Analyzer
with Input Tracing). The prototype is built on top of
Triton (Saudel and Salwan, 2015), a framework for
the dynamic binary analysis of programs. Triton con-
sists of different components, among which there is a
dynamic symbolic execution engine that is the foun-
dation of the proposed tool. For the dynamic binary
instrumentation, our prototype relies on Pin
2
, which
offers a good integration with Triton.
HAIT has been successfully tested on several
Capture-The-Flag challenges (CTFs), security com-
petitions where purposely vulnerable programs are
used for practicing with various security related chal-
lenges. Our tool provided important support and it
was able to significantly speed-up the information
gathering, one of the crucial phase of the heap ex-
ploitation process, relieving the users from a long and
tedious manual inspection.
The rest of the paper is organized as follows: Sec-
tion 2 provides the necessary background, Section
3 introduces the proposed methodology and HAIT,
while Section 4 presents an example case of study.
Finally, Section 5 concludes the paper.
2 BACKGROUND
2.1 Automated Vulnerability Analysis
The development of an exploit is characterized by the
discovery of a vulnerability and the design of the code
to take advantage of it. Regarding the discovery, most
of the automated vulnerability analysis systems can
be classified into three categories: static, dynamic,
and concolic; each one with its typical advantages and
2
Pin, a dynamic binary instrumentation tool (v. 3.2),
https://software.intel.com/en-us/articles/pin-a-dynamic-
binary-instrumentation-tool
disadvantages (Stephens et al., 2016). Static analysis
is performed without actually executing programs: it
analyzes the control and data flows, builds a model,
and checks its properties. While it is usually quite
fast and able to produce deterministic results, its per-
formance depends entirely on the choice of the model:
its complexity may lead to intractable problems, or it
may simulate only a subset of the program features.
Moreover, static analyses provide a significant frac-
tion of false positive alerts. On the contrary, dynamic
analyses monitor the native execution of the applica-
tions in specific conditions, such as with random in-
puts generated by a fuzzer. The dynamic analysis does
not suffer from the problems of the static one, but the
time required depends on the size and complexity of
the test, and its final accuracy is hardly quantifiable.
Finally, concolic execution engines make use of pro-
gram interpretation and constraint-solving techniques
to generate inputs able to explore the state space, in an
attempt to reach and trigger vulnerabilities. However,
due to the large number of paths that are executed,
these systems are not scalable.
Other types of analysis, which could be either de-
fined as static or dynamic, also exist. For instance,
Taint analysis is an iterative process where the goal is
to eventually mark locations as tainted if those derive
directly from relevant sources (e.g. user input) (Hee-
lan, 2009). Taint analysis is a powerful methodology,
and in HAIT the same principle is used to correlate
program input to memory allocation in order to find
allocation patterns that can be used to create the mem-
ory layout of interest.
2.2 Exploitation Techniques
Early buffer overflow exploits relied on the ability
to inject executable code, termed shellcode, into a
buffer and then overwrite a return address on the stack
to point to it. As a consequence, instead of return-
ing to the previous code, execution would jump into
the shellcode, giving the attacker control over the
program. Security researchers dealt with the prob-
lem by preventing the stack and other memory ar-
eas not supposed to contain code from being exe-
cuted. Microsoft introduced Data Execution Preven-
tion (DEP) in Windows XP, marking memory as non-
executable with the NX bit, if available; around the
same time, OpenBSD implemented a feature named
W⊕X, which forces each memory page to be either
writable or executable, but not both. To outsmart such
defenses, attackers adopted the idea of code reuse:
take advantage of legitimate functionality already in
the program to accomplish their malicious goals. For
instance, in the return-into-libc exploits, an attacker
SECRYPT 2017 - 14th International Conference on Security and Cryptography
328

redirects the control flow directly to a sensitive libc
function, such as system(), after setting the proper
arguments. Another possibility to circumvent non-
executable memory is to hijack program control flow
and then execute chosen instruction fragments that
are already present in the machine’s memory. Such
fragments, or gadgets, are typically located at the
end of a subroutine and conclude with a return in-
struction, hence the name Return-Oriented Program-
ming (ROP) (Wojtczuk, 2001; Roemer et al., 2012).
Against such attacks, researchers developed a system-
level hardening technique called Address Space Lay-
out Randomization (ASLR) (Szekeres et al., 2013):
the programs memory layout, including the locations
of libraries, the stack, and the heap, is randomized
at each execution. Thus, with ASLR, the attacker
does not know where to redirect the control flow in
the libraries to execute specific functions. Moreover,
even if the attacker can determine this information, he
would be still unable to identify the location of spe-
cific functions inside the library unless in possession
of a copy of the library itself. As a result, an attacker
usually has to provoke the library content leakage and
parse the code to identify the location of critical func-
tions.
Looking for a good memory corruption, i.e. that
allow an attacker to execute a “reliable exploit”, of-
ten the unlink procedure of the heap allocator is the
target of the attack, as described in the well-known
Malloc Maleficarum Phrack Magazine articles (Phan-
tasmagoria, 2005; blackngel, 2009). Both the double-
free and the one-byte-overflow vulnerabilities (Con-
rad, 2015), in which chunk metadata is overwritten
or emulated, allow to achieve a write-primitive, that
is the possibility to write “where you want, whatever
you want”. Moreover, use-after-free vulnerabilities
can also lead to very reliable exploits (Evans, 2015),
particularly when the “free” and the “use” are close
together (e.g., in the Pinkie Pie
3
exploit). In real-
world exploits, an attacker often uses an information
disclosure attack to leak the address or contents of
a library, then uses this information to calculate the
correct address of a security-critical library function
(such as system()), and finally sends a second pay-
load to the vulnerable application that redirects the
control flow to call the desired function (Di Federico
et al., 2015).
2.3 Related Tools
Shadow (Argyroudis, P. and Karamitas, C., 2015) is
a Python extension for WinDBG that provides an ex-
3
http://scarybeastsecurity.blogspot.it/2013/02/exploiting-
64-bit-linux-like-boss.html
tremely detailed insight of every aspects of jemalloc,
the heap allocator of Firefox. Designed for Windows,
it allows to extract several meta-information about je-
malloc and to display Firefox symbols, retrieved from
Mozilla symbol server.
Villoc
4
is a tool designed for the visualization of
the heap memory layout. The program under anal-
ysis is executed within ltrace, the Linux library call
tracer. Then, the output is parsed by a Python script
which looks for calls to heap management functions
and finally produces a static HTML file with a graph-
ical representation of the different states of the heap
after each function call. Villoc main limitation is that
the analysis is only available when the program un-
der analysis terminates, so there is no immediate feed-
back at runtime. Moreover, since the information dis-
played is solely based on ltrace, other valuable data,
e.g. chunk metadata, is not accessible.
HAIT extends the idea of Villoc using an under-
lying powerful dynamic binary analysis framework,
such as Triton. The proposed tool not only display
the crucial chunk metadata, although currently only
ptmalloc is implemented, but it also allows a step by
step analysis correlating program inputs to heap allo-
cations.
3 PROPOSED FRAMEWORK
Any analysis of heap exploitation methodologies
(Shoshitaishvili et al., 2016), and real-word example
show that all attacks require two categories of infor-
mation: the knowledge on how the heap memory lay-
out changes during program execution and how user
inputs influence the allocations on the heap.
To support the information gathering of the cru-
cial knowledge of every exploit, we introduce HAIT
5
,
a proof of concept Heap Analyzer with Input Tracing.
The tool is built on top of Triton (Saudel and Sal-
wan, 2015), a sophisticated framework for dynamic
binary analysis, which consists of several compo-
nents, above all a dynamic symbolic execution engine.
Developing HAIT, we took the same approach
as Automatic Exploit Generation (Avgerinos et al.,
2011): leverage binary instrumentation to obtain data
as soon as it is available, a technique whereby ex-
tra code is injected into the normal execution flow,
therefore allowing an arbitrary analysis of the exe-
cuting program (Heelan, 2009). Binary instrumen-
tation exists in two flavors: static and dynamic. In
the first, the additional code is added at compile time,
4
Villoc, https://github.com/wapiflapi/villoc/
5
https://github.com/mauronz/HAIT
HAIT: Heap Analyzer with Input Tracing
329
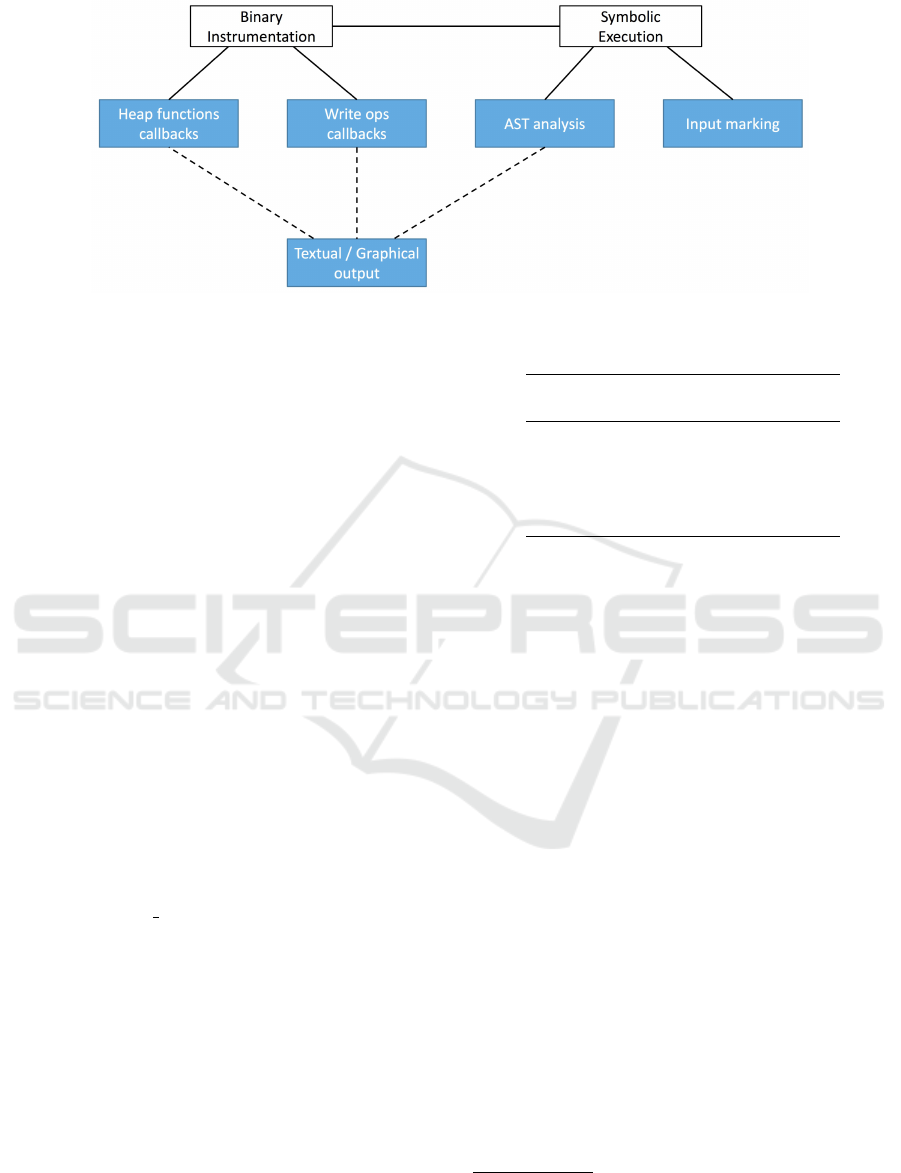
Figure 1: HAIT schema.
resulting in a new version of the original executable.
The main drawback of this technique is the need of
the application source code. On the other hand, dy-
namic binary instrumentation works directly on the
executable, looking for events that trigger specific
routines. Considering the purpose of tracing heap op-
erations, we decided to use the dynamic approach. As
a tracer, HAIT relies on Pin, a dynamic binary instru-
mentation library from Intel, which currently offers
the best integration with Triton, since the framework
provides Python bindings to interact directly with the
tracer and use all of its features, above all event hook-
ing. Figure 1 illustrates the HAIT infrastructure.
By running specific routines both before and after
the execution of all the heap related functions, HAIT
can perform a detailed analysis. Specifically, it re-
trieves the calling parameters, either from the stack
or the registers, as defined by the calling convention
of Linux 64-bit executables. Moreover, it inspect the
memory to get the chunk metadata; these can be found
at predetermined offsets with respect to the address of
the chunk, i.e. the address returned by the allocation
functions. The offsets are computed from the corre-
sponding data structure of the ptmalloc implementa-
tion (struct malloc chunk). Tracking program writes
to the heap, by means of Pin function hooks, provides
additional useful information.
Symbolic expressions are stored in the form of
Abstract Syntax Trees (AST), a binary tree data struc-
tures in which each node represents an operation and
the two children the operands, while taint analysis is
used to keep track of user input affected allocations.
HAIT logs memory allocations, write operations
and tainted values to the console; Section 4 provides
several examples. Then, as illustrated in Figure 3,
an interactive HTML page is built, displaying at each
line the current heap memory layout. The white back-
ground color identifies a free memory block, while a
red border is drawn if an allocation is controlled by
Table 1: Memory usage comparison for several CTF
6
.
Memory usage (GiB)
with libc without libc
Freenote 2.3 0.40
Stkof 2.0 0.04
Logger 2.4 0.08
Chat 2.1 0.10
Shopping 2.3 0.07
user input. By clicking a memory chunk, it is possible
to retrieve the memory addresses and other allocator-
specific metadata, such as fd and bk links in the case
of a freed block. Moreover, additional information
from /proc/pid/maps is displayed. Such features have
been shown to be crucial for the fast prototyping of
heap exploit.
As any other analysis tool, using HAIT implies
overhead to program execution. By default dynamic
binary instrumentation increases the time of the exe-
cution, besides considering that the several analyses
carried during program execution, the overhead can
reach up to 500%.
This cost is mostly expected and in line with other
analysis performed using the Triton framework
7
.
There exist different ways to improve the tool, as
discussed in Sec. 5, and thus enlarge its applicability.
Table 1 shows a comparison of RAM memory
usage while analyzing several CTF programs. It is
clear that including the libc library in program anal-
ysis causes a big overhead in term of RAM memory
allocation. While it is possible to remove it without
affecting HAIT analysis, it provides critical informa-
tion to link the program inputs to the heap allocations.
However, our tool is meant to be applied mostly
after the vulnerability discovery phase, i.e. to de-
7
Triton’s author states “By default DBI (Dynamic bi-
nary instrumentation) increases the time of the execution.
Add others analysis and you got an overhead of 500% to
1000%” (Salwan, 2015)
SECRYPT 2017 - 14th International Conference on Security and Cryptography
330

velop a targeted exploit. Thus, HAIT is not meant to
be generically applied on large binaries, like Firefox
and Chrome, for which would be unpractical. On the
contrary, should target specific parts (e.g. identified
libraries) where vulnerabilities exist (or are suspected
to exist). In this kind of scenarios our tool is effec-
tive: we tested HAIT in the context of several CTFs
(i.e. where programs vulnerable by design are pro-
vided for security analysis) and it proved to be very
useful, as detailed in Sec.4.
4 CASE OF STUDY
As a demonstration of the capabilities of HAIT, we
selected freenote
8
, a Capture The Flag (CTF) chal-
lenge from the 0CTF Quals 2015 (Quals, 2015). The
vulnerable program is an implementation of a Linux
command-line textual notebook, where a user can
add, modify or delete a note, as well as print all the
previously inserted ones. The following analysis of
the vulnerable program is based on the write-up of a
possible solution provided by one of the competitors
(seanwupi, 2015).
Freenote is a typical CTF designed to challenge
reversers to develop a working heap exploit with
all the operating system countermeasures active, like
ASLR, DEP and partial RELRO. The challenge is
provided as an executable program, in ELF format.
The following description will focus on the ini-
tial information gathering process about the heap state
and the data structures, aiming at the leakage of a
memory address to bypass ASLR. The details about
how to take advantage of such information and the de-
velopment of the actual exploit are omitted, pointing
the attention on the support that HAIT provides.
The faulty program presents two vulnerabilities
that can be targeted by an attacker: a null-terminated-
string and a double free. When a new note is inserted,
the user input is written in memory without append-
ing the ASCII null character ‘\0’, therefore, when the
printf function is invoked, more information than the
necessary will be presented to the user. On the other
hand, when a note is deleted, the program wrongly
manage the pointer to the allocated area where the
note was stored, resulting in a double free vulnera-
bility
9
. While both bugs can be identified reversing
the code by an expert and trained eye, HAIT presents
them much more readily.
8
https://github.com/ctfs/write-ups-
2015/tree/master/0ctf-2015/exploit/freenote
9
https://www.owasp.org/index.php/Double Free
4.1 Freenote Analysis with HAIT
The first step of the analysis is to gather as much in-
formation as possible about the program under study,
it took few seconds and required about 2 GB of RAM.
By running the executable inside HAIT, the following
output is shown.
[* ] M a llo c -> add r = 0 x 8c3008 , u siz e =
0 x1810 , r siz e = 0 x18 20
A block of 6160 (0x1810) bytes is allocated as
soon as Freenote starts. 16 additional bytes are re-
served at the beginning of the block for storing meta-
data information from ptmalloc.
Then, the user can choose the action to perform.
Adding a new note, option 2, produces the following
output.
Yo ur c hoic e : 2 - Len gth of n ew note : 10
[* ] M a llo c -> add r = 0 x 8c4828 , u siz e =
0 x80 , r siz e = 0 x90
Sym V ar_0 rea d #1 by te 0 - > v alu e = ’2 ’
-> ato i
Sym V ar_2 rea d #3 by te 0 - > v alu e = ’1 ’
-> ato i
Sym V ar_3 rea d #4 by te 0 - > v alu e = ’0 ’
-> ato i
Even though the user inserts a length of ten char-
acters, a block of 128 (0x80) bytes is allocated. Try-
ing different sizes, it is trivial to deduce that the length
provided by the user is rounded up to the next multi-
ple of 128 bytes.
As shown by the above read operations, thanks to
our tracing system, HAIT can correlate user input to
memory allocation without requiring the reverser any
further manual analysis.
Finally, the content of the note is actually stored,
after which HAIT outputs several logs. An example
snippet is shown in the following listing.
[* ] Co n t inu e d wri te op e r atio n in b loc k
0 x 8c3008 , st a rtin g at 8 c 301 8
( cu r rent siz e 0 x 18 )
[* ] W rit e oper a t ion in blo ck 0 x8 c3008 ,
at 0 x8c 3010 ( siz e 0 x8 ) val ue =0 x1
In the first operation, 24 (0x18) bytes are written
at offset 16 (0x10), in the big block allocated during
initialization. In the second, the integer value ‘1’ is
written at offset 8. The meaning of this operations be-
come clear after trying to add several notes. The first
write always occurs at an offset calculated according
to the following formula:
o f f set
i
= 16 + 24 · i
HAIT: Heap Analyzer with Input Tracing
331
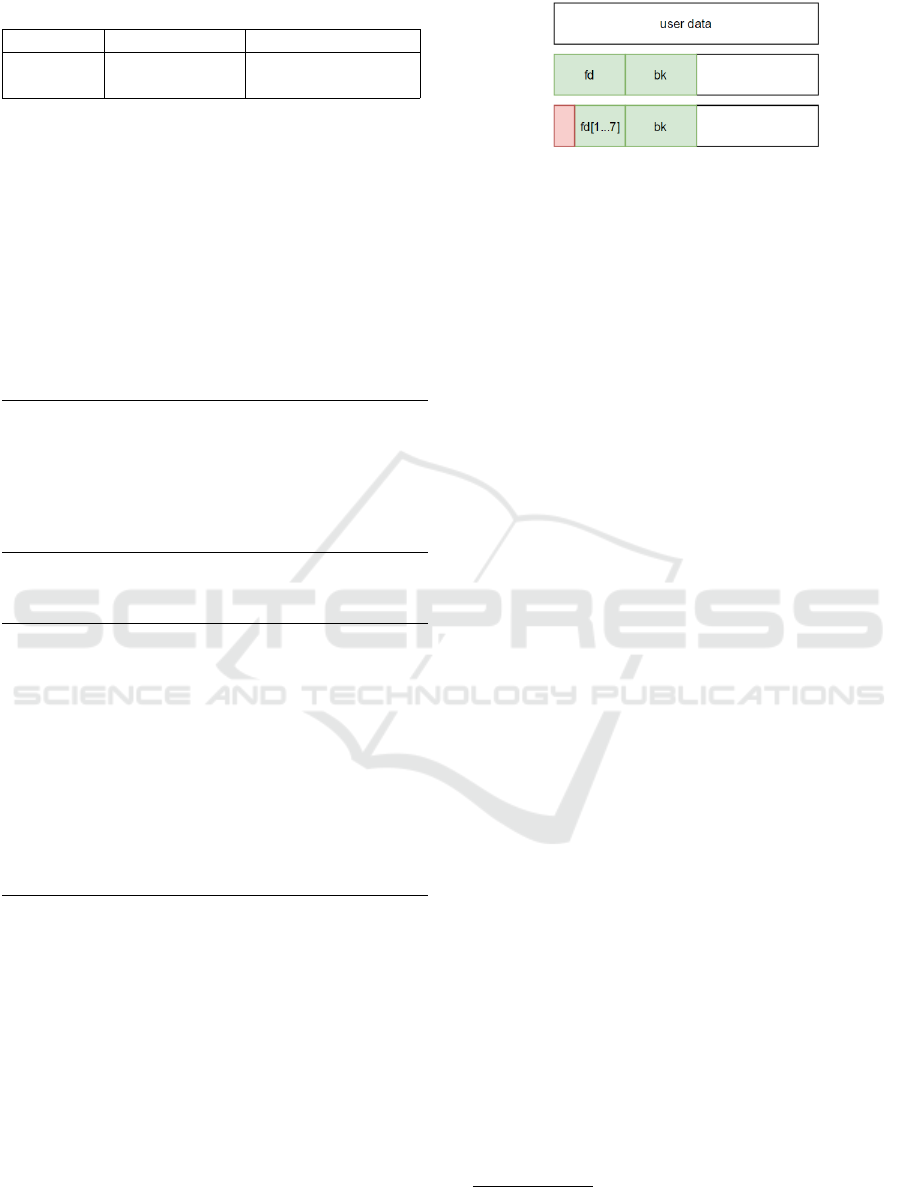
Table 2: Note index entry structure.
8 byte 8 byte 8 byte
Unknown Length of note
Pointer of memory
block of the note
where i is the note number, with a 0-based notation.
Differently, the second write is always at the same lo-
cation and it is legitimate to infer that it is a value that
keeps track of the number of notes.
When option 4 is chosen, the selected note is
deleted. As shown by the following output, three
actions occur. Firstly, the number of allocated notes
is decremented, then the note entry in the index is
updated and finally, the memory chunk containing
the note is freed.
Yo ur c hoic e : 4 - N ote num b er : 0
[* ] W rit e oper a t ion in blo ck 0 x8 c3008 ,
at 0 x8c 3010 ( siz e 0 x8 ) val ue =0 x1
[* ] Co n t inu e d wri te op e r atio n in b loc k
0 x 8c3008 , st a rtin g at 0 x 8c30 18
( cur rent siz e 0 x 10 )
[* ] F ree -> add r = 0 x8c 4828
To conclude the analysis, the update of an existing
note, option 3, is shown.
Yo ur c hoic e : 3
No te n umbe r : 1
Len gth of no te : 10
.. .
[* ] R e all o c -> add r = 0 x 8c48b8 , u siz e
= 0 x80 , r siz e = 0 x90 ( prev b loc k
= 0 x8c 48b8 )
.. .
[* ] W rit e oper a t ion in blo ck 0 x8c3008 ,
at 0 x8c 3048 ( siz e 0 x8 )
val ue =0 x 8c48 b8
[* ] W rit e oper a t ion in blo ck 0 x8c3008 ,
at 0 x8c 3040 ( siz e 0 x8 ) val ue =0 xa
The update operation is implemented with a real-
loc and thanks to the logs from HAIT it is possible
to deduce that the first write stores the address of the
re-allocated memory block at offset 16 (0x10), while
the second one writes the size of the note at offset 8.
Thanks to the previous analysis, it is possible to infer
that the note entry in the index data structure consists
of 8 unknown bytes, 8 bytes where the size of the note
is stored and 8 bytes with the address of the memory
block containing the note itself, as illustrated by Table
2.
Having gathered such information about the data
structure was essential to discover the double-free
vulnerability: recalling the penultimate listing, when
a note is deleted only the first 16 bytes are updated,
Figure 2: Leak of fd link.
that is, the pointer to the chunk containing the note is
not removed from its entry in the index.
4.2 Address Leak
As discussed in Section 2.2, Address Space Layout
Randomization prevents to trivially use any predeter-
mined memory address while taking advantage of a
vulnerability. This result is achieved by the random-
izing the offset at which each section of the executable
is mapped at each execution of the program. To suc-
cessfully create a working exploit, both the address of
the heap and libc must be leaked. Those will be later
used in the writing of the actual exploit.
The procedure to leak the address of libc is the
following:
1. Allocate two notes (0 and 1)
2. Free the first one (note 0)
3. Allocate a new note on top of the first one with
size 1
4. Print all the current notes
That specific sequence of actions targets the im-
plementation of free in ptmalloc: once a chunk of
memory is freed, it is inserted in a bin
10
of free blocks.
Being the first memory chunk to be released, back-
work (bk) and forward (fd) links will point to the head
of the list, which is always located in the same po-
sition inside the .bss section of the libc image. Re-
ferring to Figure 2, since the forward link is located
at the beginning of memory chunk, allocating a new
block of one-byte length will result in overwriting
only the first byte of the fd link. By printing all the
notes, the faulty program will show the leaked ad-
dresses inside the libc image. The initial creation of
two notes was a necessary step to have a free list.
Otherwise, the freed block, corresponding to note 0,
would have been merged with the subsequent non-
allocated memory space.
Referring to Figure 3, looking at the details of the
free chunk, it is possible to confirm that the memory
10
A bin is a double linked list of free chunks carefully
tracked by the allocator for an efficient reuse. Forward and
backword links are part of the chunk metadata.
SECRYPT 2017 - 14th International Conference on Security and Cryptography
332
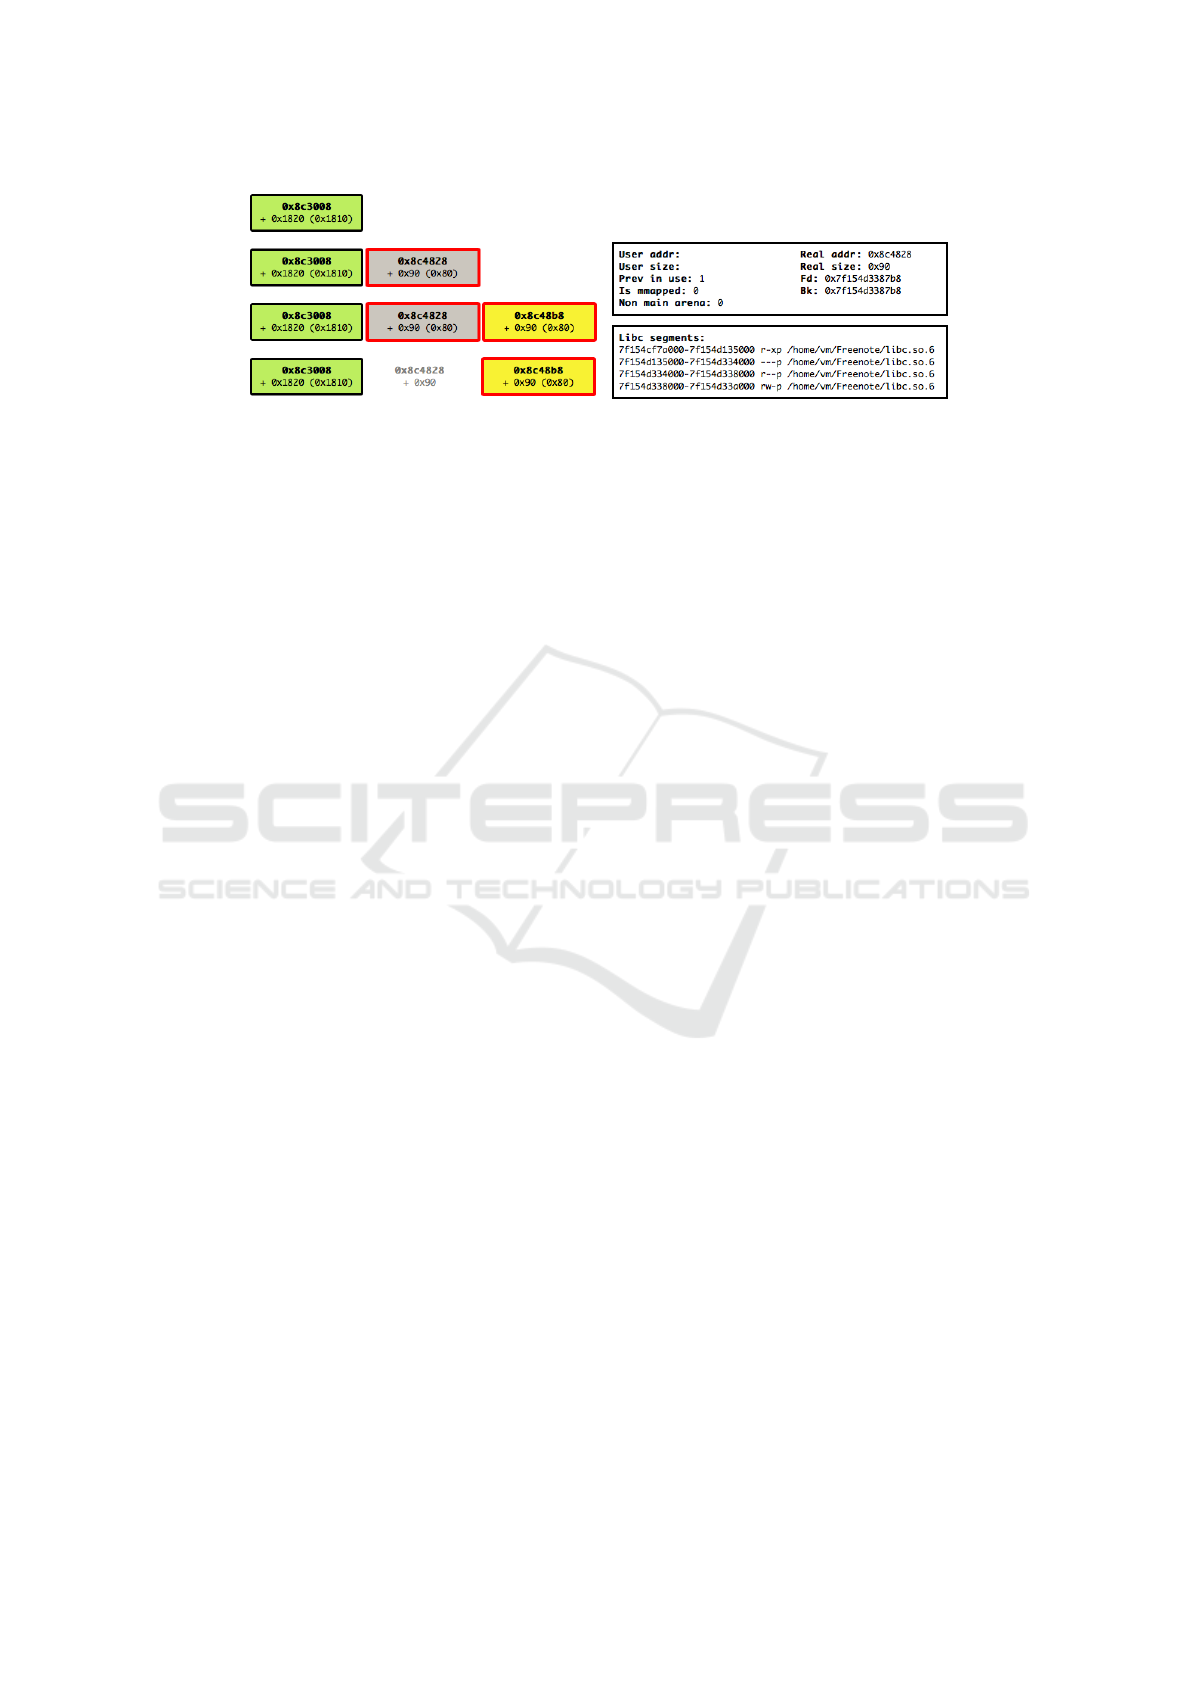
Figure 3: HTML view of the leaking procedure.
address stored in fd and bk links is inside libc mem-
ory area: they have the same value and the address
0x7f154d3387b8 belongs to the first libc segment as
shown in the memory mapping from /proc/pid/maps.
The leak of the heap address is conceptually simi-
lar to the one of libc and for the sake of brevity, it will
not be shown.
4.3 Analysis of the Results
Despite the relative simplicity of the program un-
der analysis, HAIT showed several crucial capabil-
ities required by a tool in the arsenal of an exploit
writer: a fast prototyping, ready visualization of es-
sential information (e.g. memory addresses and pro-
gram flaws) and easy debug support.
Referring to Figure 3, the tool readily showed the
memory address of the heap and libc library, allowing
fast exploit prototyping. Although those addresses
vary at each program execution, it allows the reveser
to focus on the exploit itself, leaving the information
leakage to further analyses. Having a visual represen-
tation of the heap memory state at each step of the
execution, using the HTML view, is much more hu-
man intuitive than reading a collection of hexadecimal
addresses. Moreover, both the two core vulnerabili-
ties can be easily spotted by carefully reading the few
output lines. Finally, the exploit writing process itself
is further supported by a handy debug, thanks to the
graphical visualization and by a step-by-step analysis.
The previous example showed the level of sophis-
tication that an average heap exploit requires. Al-
though experience and technical knowledge are not to
be questioned and represent the foundation for taking
advantage of any vulnerability, the availability of such
a tool represents a considerable support to the exploit
development process. It is no exaggeration to say that
HAIT is the Swiss-Army knife of heap exploitation.
5 CONCLUSIONS
Developing a successful exploit from scratch for an
unknown application is a complex process. Twenty
years ago, a simple buffer overflow, redirecting the
execution to the attacker shellcode, was enough to hi-
jack the control flow of a vulnerable program. With-
out any further security measure, such an exploit
could be easily created using few lines of code after a
simple manual analysis and testing.
Nowadays the increasing awareness of the impor-
tance of secure coding and the availability of several
testing tools avoid trivial bugs in the code. Moreover,
the introduction of several protection techniques at
the operating system level, with the aim of increasing
the global system security, make impossible to take
advantage of most of the flaws of a target program. If
this approach continues, one day the exploit develop-
ment process will be so long and tedious to become
unfeasible.
In such a complex environment, it is clear that
security researchers need the support of specialized
tools to gather as much information as possible to de-
velop sophisticated exploits.
The research presented in this paper focuses on a
specific category of exploits, those based on the heap:
the most common target in modern exploitation. The
heap can be the core of the vulnerability, like in those
techniques that rely on the the heap corruption, or it
can be just a part of a wider process, like the bypass
of ASLR and DEP by means of heap spraying, which
is the commonly used approach in almost all browser
exploits. Considering the complexity of heap man-
agement, having a tool that automatically provides all
the useful information, instead of manually retrieving
them by inspecting the memory, can be the ultimate
advantage for the security analysts to discover quicker
an exploitable flaw and fix it.
The in-depth analysis of commonly used tech-
niques has led to the definition of a summary about
which is the most important kind of information
to create heap-based exploits. This paper shows a
HAIT: Heap Analyzer with Input Tracing
333

methodology to obtain such data during the execution
of the target program, taking advantage of dynamic
binary instrumentation to perform a runtime analysis
of the heap state. HAIT, the proof of concept imple-
mentation of our methodology, proved to be useful in
the context of known vulnerable programs, like CTFs.
6 FUTURE DEVELOPMENT
HAIT has been developed to showcase the proposed
exploitation methodology and is still not a production
ready tool. As such, can be improved regarding cov-
erage and effectiveness. The overhead can be reduced
by creating an ad-hoc engine for the concolic execu-
tion, eliminating the unnecessary operations that the
underlying generic framework, Triton, provides and
focusing only to what strictly required by our analy-
sis. Moreover, since the method of analysis is gen-
eral and can be applied to a large variety of targets,
it would be interesting to extend the tool to support
other architectures and allocators, above all the An-
droid environment, which runs on ARM and uses je-
malloc for the heap management.
ACKNOWLEDGMENT
Andrea Marcelli Ph.D. program at Politecnico di
Torino is supported by a fellowship from TIM (Tele-
com Italia Group).
Authors wish to thanks Dario Lombardo and Mar-
iano Graziano for their support and insightful com-
ments.
REFERENCES
Argyroudis, P. and Karamitas, C. (2015). Shadow v1.0b.
https://github.com/CENSUS/shadow.
Avgerinos, T., Cha, S. K., Hao, B. L. T., and Brumley,
D. (2011). AEG: Automatic exploit generation. In
Network and Distributed System Security Symposium,
pages 283–300.
blackngel (2009). Malloc des-maleficarum. Phrack.
Conrad, E. (2015). Off by 1 over-
flow. https://www.sans.edu/student-
files/presentations/heap overflows notes.pdf.
Di Federico, A., Cama, A., Shoshitaishvili, Y., Kruegel, C.,
and Vigna, G. (2015). How the elf ruined christmas. In
24th USENIX Security Symposium (USENIX Security
15), pages 643–658.
Evans, C. (2015). What is a good memory corruption.
https://googleprojectzero.blogspot.it/2015/06/what-
is-good-memory-corruption.html.
Heelan, S. (2009). Automatic generation of control flow hi-
jacking exploits for software vulnerabilities. Master’s
thesis, University of Oxford.
MITRE (2017). Common Weakness Enumeration
- version 2.10, cwe-120: Buffer copy without
checking size of input (’classic buffer overflow’).
http://cwe.mitre.org/data/definitions/120.html.
Phantasmagoria, P. (2005). The malloc maleficarum - glibc
malloc exploitation techniques. Phrack.
Quals (2015). freenote 0ctf. https://ctf.0ops.net.
Rains, T. (2014). How vulnerabilities are exploited: the root
causes of exploited remote code execution cves.
Roemer, R., Buchanan, E., Shacham, H., and Savage, S.
(2012). Return-oriented programming: Systems, lan-
guages, and applications. ACM Transactions on Infor-
mation and System Security (TISSEC), 15(1):2.
Salwan, J. (2015). presentation of dynamic be-
havior analysis using binary instrumentation.
https://www.slideshare.net/sth4ck/st-hack2015-
dynamicbehavioranalysisusingbinaryinstrumentation-
jonathansalwan-46443521.
Saudel, F. and Salwan, J. (2015). Triton: A dynamic
symbolic execution framework. In Symposium sur la
s
´
ecurit
´
e des technologies de l’information et des com-
munications, SSTIC, France, Rennes, June 3-5 2015,
pages 31–54. SSTIC.
seanwupi (2015). Advanced heap exploitation: 0ctf 2015
’freenote’ writeup. https://gist.github.com/seanwupi/
929df6655f2acdbab3ff.
Shoshitaishvili, Y., Wang, R., Salls, C., Stephens, N.,
Polino, M., Dutcher, A., Grosen, J., Feng, S., Hauser,
C., Kruegel, C., and Vigna, G. (2016). SoK: (State
of) The Art of War: Offensive Techniques in Binary
Analysis. In IEEE Symposium on Security and Pri-
vacy.
Stephens, N., Grosen, J., Salls, C., Dutcher, A., Wang, R.,
Corbetta, J., Shoshitaishvili, Y., Kruegel, C., and Vi-
gna, G. (2016). Driller: Augmenting fuzzing through
selective symbolic execution. In Proceedings of the
Network and Distributed System Security Symposium.
Szekeres, L., Payer, M., Wei, T., and Song, D. (2013). Sok:
Eternal war in memory. In Security and Privacy (SP),
2013 IEEE Symposium on, pages 48–62. IEEE.
UKessays.com (2015). Buffer Overflow At-
tacks And Types Computer Science Essay.
https://www.ukessays.com/essays/computer-
science/buffer-overflow-attacks-and-types-
computer.science-essay.php.
Wojtczuk, R. (2001). The advanced return-into-lib (c) ex-
ploits: Pax case study. Phrack Magazine, Volume
0x0b, Issue 0x3a, Phile# 0x04 of 0x0e.
SECRYPT 2017 - 14th International Conference on Security and Cryptography
334
