
Experiments and Analysis for Fractional Order Modelling of an EEG
Recording Process
Guillaume Becq, Alina Voda, Gildas Besançon, Pierre-Olivier Amblard and Olivier Michel
Univ. Grenoble Alpes, GIPSA-Lab, F-38000 Grenoble, France
CNRS, GIPSA-Lab, F-38000 Grenoble, France
Keywords:
Constant Phase Element, CPE, EEG, Electroencephalogram, Fractional Order System, Frequency-based
Identification, Head Phantom, Impedance Spectroscopy.
Abstract:
In this study, an original experimental setup is proposed to analyze the transfer function of an electroen-
cephalographic (EEG) measurement chain: this setup allows to control electrodes inserted into an electrolytic
medium, and observe the electrical potentials at different points with electrodes connected to an electroen-
cephalographic recording system. Experimental transfer functions are obtained that enable to characterize the
influence of the electrolyte, the electrode-electrolyte interfaces, and the medium itself. A theoretical model
containing so-called constant phase elements is then proposed and analysed to understand the behaviour of
the transfer function in Bode or Nyquist representations. Experimental and theoretical systems are finally
compared.
1 INTRODUCTION
Electroencephalographic recorders (EEG) are widely
used in hospital or experimental protocols and
their basic principles are described in several text-
books (Cooper et al., 1969), (Nunez and Srinivasan,
2006). They are nowadays simple to use and make
possible the recordings of huge amounts of data nec-
essary to observe neural activities, diagnose diseases
or understand brain functions. They have a good tem-
poral resolution and can be used to have a precise spa-
tial location, as in intracranial stereotaxic recordings
for example. However, depending on the electrodes
used to measure neural activities, such as silver elec-
trodes on the scalp, or platinum electrodes on the in-
tracranial recordings for instance, the recorded signals
are not the same in terms of amplitudes and dynamics.
Several studies have emphasized a modification of
the amplitude according to laws varying with non in-
teger powers of the frequency (Boonstra et al., 2009),
(Miller et al., 2009), (Logothetis et al., 2007), (Bé-
dard and Destexhe, 2009), (Dehghani et al., 2010),
(Ragheb and Geddes, 1990), (Becq et al., 2008), (Ma-
gin et al., 2011) by incriminating different parts of the
observed systems: some of them show that it is due to
neuronal activities, other ones that this is due to the
metallic electrodes, or finally that this can come from
the propagation medium.
In order to understand the influence of each part of
the system, experimental rigs can be tested. Among
them, so-called head phantoms have been developed
to mimic EEG measurements of brain signals inside
a head. As presented in (Leahy et al., 1998), several
systems such as cadaver heads, gelatin filled skulls, or
other chemical materials have been used to reproduce
the media of the head; dipoles are proposed to gener-
ate the signals mimicking the activity of a brain area
and currents of 1 s, 10 Hz sine waves are driven into
the conductor to evaluate the recordings. In (Baillet
et al., 2001), a similar setup is used with a 5 Hz si-
nusoid. In (Collier et al., 2012), an even more real-
istic head phantom is used with a 10 Hz, 30 s, 6.2V
peak-to-peak sine signal applied. In all these stud-
ies, the devices enable to study the performances of
source localization algorithms. However, the dynam-
ical properties of the different parts of the system
are not taken into account, and since impedances of
the biological tissues depend on frequencies, as de-
scribed in (Schwan and Foster, 1980) for example, it
is hard to evaluate the transfer function of the whole
system. Besides, the impedances of the electrode-
electrolyte interfaces, which are of high importance
in electrophysiology (Geddes, 1997), is not taken into
account. Modelisations of such systems with frac-
tional order systems are proposed in (Magin and Ova-
dia, 2010) and (Magin et al., 2011). Finally, nothing
is said about the effect of using elevated potentials
on the electrodes, that leads to reduction-oxidation re-
Becq, G., Voda, A., Besançon, G., Amblard, P-O. and Michel, O.
Experiments and Analysis for Fractional Order Modelling of an EEG Recording Process.
DOI: 10.5220/0006417905590566
In Proceedings of the 14th International Conference on Informatics in Control, Automation and Robotics (ICINCO 2017) - Volume 1, pages 559-566
ISBN: 978-989-758-263-9
Copyright © 2017 by SCITEPRESS – Science and Technology Publications, Lda. All rights reserved
559

actions, sources of physical phenomenons which can
transform electrodes and electrolytes.
In this article, an original experimental rig is pro-
posed to characterize the transfer function of the
medium and its coupling with the electrodes at differ-
ent frequencies. To that end, electrical potentials are
applied on electrodes inserted into a medium. Electri-
cal potentials are chosen in a range that do not in-
duce reduction-oxidation reactions at the electrode-
electrolyte interfaces. Signals are collected on an
EEG recorder, via other electrodes also inserted into
the medium. In this article, the influence of two differ-
ent media, an electrolyte or a sponge wet with an elec-
trolyte, are compared. An electrical circuit includ-
ing so-called Constant Phase Elements (CPE) (Diard
et al., 2013), (Jorcin et al., 2006), (Zoltowski, 1998)
in order to capture the non-integer order of the sys-
tem is proposed and its theoretical transfer function
and properties are calculated. This enables to fit the
experimental data and identify the parameters of the
theoretical proposed system, from the arc paths of the
transfer functions observed in the Nyquist representa-
tions.
The article is constructed as follows: first the ex-
perimental setup and related empirical transfer func-
tion estimates are presented in section 2. Then, the
theoretical transfer function based on a proposed elec-
trical circuit is studied in section 3 and compared with
the experimental recordings. Results are discussed in
section 4 before concluding.
2 EXPERIMENTAL SETUP,
MEASURES & ANALYSIS
2.1 Description of the Experimental
Setup
The general setup proposed for testing the EEG
recorder is described in Fig. 1: in short, signals are
simulated on a computer (Simu) and sent to a digital-
to-analog converter (DAC) as voltage inputs applied
to electrodes. These inputs electrodes (Elec in) are in-
serted into a medium (Med). Output electrodes (Elec
out) are also inserted into the medium to record some
signals. Input and output values on the medium are
recorded with an EEG recorder (EEG rec). Accord-
ing to linear system theory, the system is reduced to
Fig. 1. e) with different transfer functions H
i
from the
simulation into an input electrode X
in
to a recording
electrode X
i
.
The DAC is a National Instruments CRIO-9263,
voltage analog output module with 4 outputs, 16 bits,
100 KS/s per channel, mounted on a cDAQ-9181 eth-
ernet chassis. Signals are simulated in Python with
Scipy modules (Jones et al., 2016). They are binded
to an own-purpose library in C linked to the National
Instruments library interfacing the DAC. Python and
C codes are available in (Becq, 2016).
Home-made pure platinum electrodes are used in
this study in order to avoid reduction–oxidation re-
actions at the contact of the electrodes with elec-
trolytic solutions for potentials lower than E
◦
Pt
= 1.2V
at 25
◦
C (Didier, 1984). Each electrode consists of a
thin cylinder of platinum with a diameter of 0.5 mm
and a length of 1 cm, soldered on a copper wire. The
solder junction is covered by a thin layer of epoxy
resin for insulation.
Two media are tested to compare their influences
on the system: an electrolytic solution; a sponge fully
wet with an electrolytic solution. The electrolyte so-
lution is obtained from the dissolution of a tablet of
phosphate buffered saline (PBS) into pure water. A
synthetic tiler foam grout sponge, with dimensions
15.5 by 10.5 by 5.2 cm is used to test the influence
of a propagation medium. The sponge is washed with
pure water between experiments. The sponge, or the
solution, is contained in a home-made basin made
of polyethylene terephthlate glycol-modified (PETG)
slices stuck together with a silicon glue, as seen in
Fig. 1. This setup is simple, cheap and very con-
venient for working with liquids. PBS is a P4417
Sigma-Aldrich reference. The basic dissolution is one
tablet in 200ml of pure water. The dissolution used in
this study is 1/2 tablet in 1 l of pure water, so as to ob-
tain a weakly conductive solution. The temperature of
the room is checked with a thermometer and is about
24 to 25
◦
C.
Electrodes are inserted into the sponge or liq-
uid on a depth of approximatley 0.5 cm. Electrodes
are linearly spaced on 6 locations with d
1,2
= 1 cm,
d
1,3
= 3 cm, d
1,4
= 5 cm; d
1,Re f
= 6 cm; d
1,GND
= 8 cm
with the input electrode in 1; the output electrodes are
in 2, 3 and 4; the ground electrode (GND) is common
to the EEG recorder and the ADC; the reference elec-
trode of the EEG recorder is set in Ref; electrode 1 is
also connected to the EEG recorder.
The EEG recorder is a g.tec g.USBamp, with an
input voltage range of ±250 mV , no highpass filter,
a lowpass at 6.6 kHz, an input impedance > 10
10
Ω,
an analogic to digital conversion resolution of 24 bits
with a maximal sampling frequency of 38.4kHz per
channel, and 16 channels. Signals are recorded at
4.8kHz in this study.
ICINCO 2017 - 14th International Conference on Informatics in Control, Automation and Robotics
560

a) b) c)
Simu
DAC Elec
in
Med
Elec
out
EEG
rec
Simu
X
in
H
i
EEG rec
X
i
d) e)
Figure 1: Illustration of the proposed experimental setup for EEG recorder testing with different representations. a) Overall
view of the setup; b) Electrolytic solution and electrode positioning; c) Sponge experiment and positioning; d) Scheme of the
setup. e) Scheme of one equivalent system H
i
for one input electrode X
in
and one recording electrode X
i
.
2.2 Experimental Transfer Functions
Estimates and Analysis
Empirical transfer function estimates (ETFE) (Ljung,
1987) are obtained by impedance spectroscopy (Al-
Nazer et al., 2013) either by generating with the com-
puter a sequence of sine waves with amplitude vary-
ing from -0.1 to 0.1 V at different frequencies, [0.1,
0.125, 0.25, 0.5, 1, 2, 4, 8, 10, 16, 32, 64, 100, 128]
Hz, or by using a reproducible sequence of white
Gaussian noise with mean 0 V and standard deviation
0.1 V. For all methods the ETFE is the ratio between
the output signal over the input signal at different fre-
quencies. When working with pure frequencies, se-
quences of at least 10 periods are recorded and the
evaluation is made after removing transients, gener-
ally the first cycle of the trial for low frequencies. The
ETFE is obtained by dividing the Fourier coefficients
of the signals at the different frequencies of interest:
ˆ
H
i
( f ) =
ˆ
X
i
( f )
ˆ
X
in
( f )
When working with white noise, a sequence of
100 s is used. Half a second at the beginning and end
of the sequence are removed for data processing. A
method similar to Welch windowing (Welch, 1967)
with non overlapping windows of 1 s, 4800 samples,
is applied to estimate the Fourier coefficients X
i
( f ) of
each signal x
i
(t) for each frequency of interest. The
ETFE
ˆ
H( f ) is the mean of the ratio of these Fourier
coefficients obtained on windows indexed by k:
ˆ
H
i
( f ) =
1
N
N
∑
k=1
ˆ
X
i,k
( f )
ˆ
X
in,k
( f )
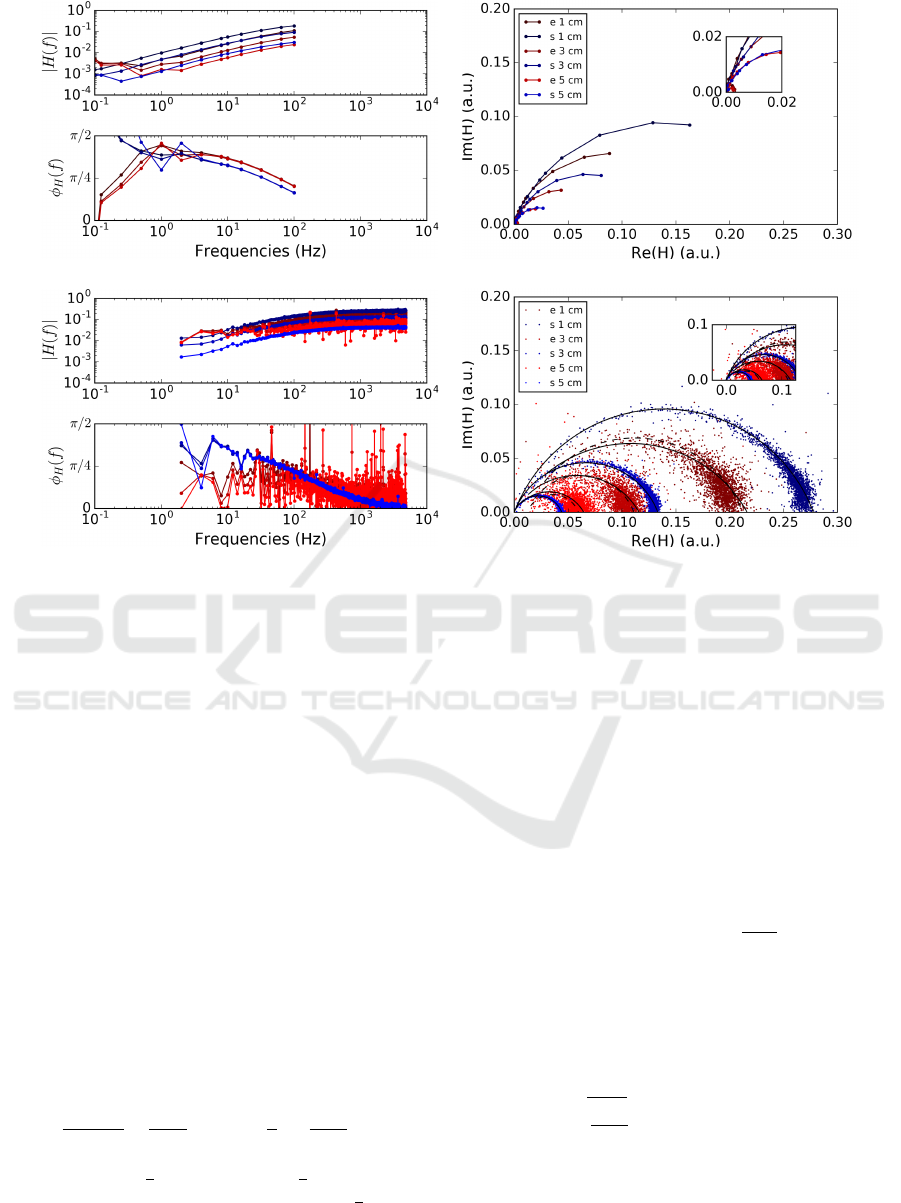
The empirical transfer functions obtained with
impedance spectroscopy on an electrolyte (e) or on
the sponge wet with the electrolyte (s) are represented
in the Bode and Nyquist representations of Fig. 2.
On all electrodes the transfer functions show be-
haviors of high pass filters. For the electrolyte alone
(e, red color), differences are observed on the Bode
amplitudes that decrease with distances from the elec-
trodes to the input. There is no modification of the
Bode phase with distances. Arcs are observed on
the Nyquist representation with varying centers and
radii. The same behaviors are observed with the
sponge wet with an electrolyte (s, blue color). On
the Bode representation, amplitudes are higher with s.
The white noise estimates show less variance with s.
On the Nyquist plot, dispersion of point clouds seems
less important with s. On the Bode representation,
there is a small shift in phase angle between the two
media. In the Nyquist representation and especially
in (d), there are slight differences in the tangents at
the origin at low frequencies, and always differences
in the real part at high frequencies.
These behaviors looks like transfer functions of
a first order high pass filters but with several differ-
ences: slopes of the attenuations of the amplitude at
low frequencies on the Bode representations are less
than -20 dB / dec; the limits of the phases at low fre-
quencies in the Bode representations tend to a value
smaller than
π
2
; the path in the Nyquist representation
is an arc but the center of this arc is not on the real
axis; equivalently, the path at the origin is not tangent
to the imaginary axis. In order to understand these be-
haviors, a theoretical model based on constant phase
elements is proposed in the next section.
Experiments and Analysis for Fractional Order Modelling of an EEG Recording Process
561
a) b)
c) d)
Figure 2: Empirical transfer functions estimated at different frequencies for the electrolyte alone (e) or the sponge wet with
the electrolyte (s): a) b) with sinusoid; c) d) with white noise; a) c) Bode plot of the transfer function for the electrodes 2, 3
and 4 at distances 1, 3, and 5 cm from electrode 1. Magnitudes (up) and phases (bottom) of the transfer functions are given
in function of the frequencies in Hz. b) d) Nyquist representation of the transfer function in arbitrary unit (a. u.). Fits, with
theoretical paths presented in section 3, are represented with black curves on d). All systems show general behaviors of high
pass filters.
3 THEORETICAL MODELLING
WITH CONSTANT PHASE
ELEMENTS
In the rest of the paper, X(p) and X (ω) are used to
represent the Laplace and Fourier transform of signal
x(t) with time t.
3.1 Constant Phase Elements and
General Models
Let us start with the simple model of impedance Z(ω)
of a constant phase element, as given in (Diard et al.,
2013), (Jorcin et al., 2006), (Zoltowski, 1998):
Z(ω) =
1
Q( j ω)
α
=
1
Qω
α
exp(− j α
π
2
) =
1
Qω
α
(c
α
− j s
α
)
with c
α
= cos
α
π
2
and s
α
= sin
α
π
2
.
The phase of this component is φ
Z
= −α
π
2
, is con-
stant, and explains its name. We replace resistors with
CPE components in voltage dividers generally used to
obtain first order high pass filters. Other complex cir-
cuits with CPE can be found in (Diard et al., 2013).
The general electrical scheme for a potential or
voltage divider is given in Fig. 3. a).
It is supposed that the input resistance when mea-
suring X
2
is high as compared to Z
2
. In this case, the
impedance Z(p) of the equivalent circuit from X
1
(p)
and the transfer function H(p) =
X
2
(p)
X
1
(p)
are related by:
H(p) = Z
2
(p) Z
−1
(p), or Z(p) = Z
2
(p) H
−1
(p)
If Z
2
(p) = R, the relation between Z or H, depend-
ing on the measurement made on the system is given
by:
|Z(p)| =
R
|H(p)|
φ
Z(p)
= exp (− j φ
H
(p))
|H(p)| =
R
|Z(p)|
φ
H(p)
= exp (− j φ
Z
(p))
(1)
For Z
2
(p) = R and Z
1
(p) = 1/( jC ω), the system
is a high pass filter of the first order.
ICINCO 2017 - 14th International Conference on Informatics in Control, Automation and Robotics
562

I
Z
1
i ≈ 0
Z
2
I
i ≈ 0
X1 X2
R
1
Q
R
2
a) b)
Figure 3: Examples of voltage divider: a) general model, b) resistive and high pass filter with CPE.
3.2 Introducing a Constant Phase
Element in a High Pass Filter
The proposed circuit to obtain a high pass filter with
a CPE is given in Fig. 3 b). This model is proposed to
take into account a resistive component in the medium
and a CPE that summarizes the electrode-electrolytic
interfaces for the input electrode X
in
and output elec-
trode X
i
. The development of the transfer function
leads to:
H(ω) =
R
2
R
1
+ R
2
+
1
Q( j ω)
α
=
R
2
Q( j ω)
α
(R
1
+ R
2
)Q( j ω)
α
+ 1
Let A(ω) = R
2
Qω
α
= A ω
α
with A = R
2
Q and
A
∗
(ω) = (R
1
+ R
2
)Qω
α
= A
∗
ω
α
.
H(ω) =
A(ω)(c
α
+ j s
α
)
(A
∗
(ω)(c
α
+ j s
α
) + 1)
H(ω) =
A(ω) (A
∗
(ω) + c
α
)
B
∗
(ω)
+ j
A(ω)s
α
B
∗
(ω)
B
∗
(ω) = 1 + 2 A
∗
(ω)c
α
+ A
2
∗
(ω)
H(ω) = C(ω) (A
∗
(ω) + c
α
) + jC(ω)s
α
(2)
Where C(ω) = A(ω)/B
∗
(ω)
Let f be the frequency such that ω = 2 π f . On one
hand, if the real part of the transfer function is denoted
by x and the imaginary part by y, which corresponds
to the respective axes in the Nyquist representation,
the path of the transfer function H( f ) can be given in
its parametric form with:
x( f ) = C( f )(A
∗
( f ) + c
α
)
y( f ) = C( f )s
α
(3)
On a second hand, the equation of a circle centered at
C with coordinates (x
C
,y
C
) and radius r is given by:
x
2
− 2 x
C
x + x
2
C
+ y
2
− 2 y
C
y + y
2
C
− r
2
= 0 (4)
Let a = R
2
Q(2π)
α
, a
∗
= (R
1
+ R
2
)Q(2π)
α
, and u =
f
α
. Combinations of the terms of the parametrization
(3) yields:
x
2
+ y
2
=
a
2
u
2
1 + 2 a
∗
uc
α
+ a
2
∗
u
2
−2x
C
x − 2 y
C
y = −2
x
C
au(a
∗
u + c
α
) + y
C
(aus
α
)
1 + 2 a
∗
uc
α
+ a
2
∗
u
2
Substituting these expressions in the circle equation
(4) gives:
a
2
u
2
− 2 x
C
au(a
∗
u + c
α
) − 2 y
C
(aus
α
) +
+(x
2
C
+ y
2
C
− r
2
)(1 + 2 a
∗
uc
α
+ a
2
∗
u
2
) = 0
Developing and reordering the terms in function of
the order of u yields:
a
2
− 2 a a
∗
x
C
+ a
2
∗
(x
2
C
+ y
2
C
− r
2
)
u
2
+ ···
··· + (−2 a c
α
x
C
− 2 a s
α
y
C
+ ···
··· + (x
2
C
+ y
2
C
− r
2
)2a
∗
c
α
)u + ···
··· + (x
2
C
+ y
2
C
− r
2
) = 0
If parametrization (3) follows a circle, this must be
satisfied for all u. This leads to the resolution of the
system:
a
2
− 2 a a
∗
x
C
+ a
2
∗
(x
2
C
+ y
2
C
− r
2
) = 0 (5)
−2a c
α
x
C
− 2 a s
α
y
C
+ (x
2
C
+ y
2
C
− r
2
)2 a
∗
c
α
= 0 (6)
(x
2
C
+ y
2
C
− r
2
) = 0 (7)
Using Eq. (7) in Eq. (5) gives: a
2
− 2aa
∗
x
C
= 0
which implies:
x
C
=
a
2a
∗
(8)
Using Eq. (7) in Eq. (6) and Eq. (8) gives:
c
α
x
C
+ s
α
y
C
= 0
y
C
= −
a
2a
∗
c
α
s
α
= −
x
C
tan(α
π
2
)
(9)
Finally, Eq. (8) and (9) in Eq. (7) yield:
r =
1
2
a
a
∗
1
s
α
=
x
C
s
α
(10)
This proves that the parametrization (3) follows a cir-
cle. One can notice that the ratio ρ =
a
a
∗
=
R
2
R
1
+R
2
does
not depend on Q, and that the location of x
C
depends
only on this ratio. In addition, we also have the simple
rules x
C
= s
α
r and y
C
= −c
α
r. At low frequencies,
the circle goes to the origin (for f = 0, x(0) =
0, y(0) = 0), and at high frequencies, it reaches the
Experiments and Analysis for Fractional Order Modelling of an EEG Recording Process
563

x = Re(H(f))
y = Im(H(f))
y
C
|α = 1
y
C
|α
y
C
|α = 1/2
(0,0)
(1 − α)
π
2
α
π
2
α
π
2
α
π
2
C
x
C
ρ
Figure 4: Theorical path of the transfer function for a high
pass circuit with a CPE (circle with radius and center de-
pending on the ratio of the resistors in the circuit and on the
α parameter of the CPE).
point (ρ,0) (for f → ∞, x( f ) →
a
a
∗
, y( f ) → 0).
These special features are emphasized in the Nyquist
plot of Fig. 4.
The angle α
π
2
is the angle between the radius
crossing the x-coordinate at x
C
and the radius crossing
the origin. By simple geometric relations, this angle
is also obtained between the tangent of the circle at
the origin and the x-coordinate axis.
3.3 Comparison of Fitted Theoretical
Paths With Experimental Data
Parameters of the models can be optimised to fit ex-
perimental data. Examples of fitted paths are pro-
posed in black curves in Fig. 2 d). Table 1 gives the
parameters used to fit experimental data.
Table 1: Possible fits for the parameters according to the
data given in Fig. 2.
α ρ α ρ
e 1 cm 0.77 0.28 s 1 cm 0.68 0.22
e 3 cm 0.77 0.13 s 3 cm 0.68 0.12
e 5 cm 0.77 0.04 s 5 cm 0.68 0.06
The coefficient Q is set to one to describe com-
pletely the circle but appropriate fits can be made if
necessary, for example by fitting special points on the
path depending on the frequency.
With these parameters, it seems that the introduc-
tion of the sponge changes the order of the constant
phase element as observed in Fig. 2 d). This corre-
sponds to the shift between the electrolyte setup and
the sponge setup, observed in the Bode representation
of the phase angle in Fig. 2 a).
Figure 5: Experimental setup to test easily some electrodes
with a sponge wet with electrolyte. Slits are cut into the
sponge and electrodes are inserted inside them. The elastic-
ity of the sponge enables to maintain electrodes in position.
A PETG basin maintains the sponge and electrolyte.
4 DISCUSSION
Using platinum electrodes and low potentials enable
to obtain the results presented in this study. Indeed, an
important part of the study was realized with weakly
golden pins for electrodes and lead to the conclusion
that platinum or nobel metals with high electrochem-
ical potentials are necessary to avoid random shifts in
voltage due to reduction-oxidation reactions and lead
to observable and understandable behaviors. How-
ever, in reality, EEG electrodes are sometimes weakly
covered or defectuous, and this generates artefacts
that are hard to correct. Understanding the model
could precise the effect of these artefacts and the cor-
rections to apply.
Concerning the choice of the medium, it is a long
time since sponge are studied as elementary nervous
systems, even if it is only a muscle system encap-
sulated in a complex body (Parker, 1919) or a more
complex system in current biology (Leys et al., 1999).
The conduction into these organisms is not done on a
wide range, say somes centimeters. Here we tested
only the conductivity induced by the structure of such
an organism with synthetic sponges, not for biolog-
ical purpose, but for practical one. Indeed, sponges
are good for practical usage to test electroencephalo-
graphic recordings. One easy way to use them is to
cut some slits with a cutter on a 1 or 2 cm depth, put
some electrodes inside and fill with conductive water.
The elastic structure of the sponge will maintain elec-
trodes inside the slits and allows to test EEG record-
ings as in the scheme proposed in Fig. 5.
An experimental technical point that can be dis-
cussed here is that it is difficult to wash a sponge
and it is hard to really clean it. A measurement of
the impedance may help but the composition of the
ionic elements inside the sponge is hard to evaluate.
A proper model and a specific wash design must be
conducted to elaborate something more precise.
Impedance spectroscopy with measurements at
different frequencies can be long, but enable to con-
trol the amplitude of the simulation in order to stay in
ICINCO 2017 - 14th International Conference on Informatics in Control, Automation and Robotics
564

the voltage range out of the oxydo reductive reactions.
Using white noise simulations or multiple com-
binations of wavelength can shorten the duration of
experiments. Interestings readings about impedance
spectroscopy are pointed out in (Al-Nazer et al.,
2013).
The ETFE obtained from sine waves are very pre-
cise for high frequencies but are less precise for low
ones. This is possibly due to the weak amplitude in
the low frequencies and the presence of noise in this
band. It is then hard to differentiate the tangent at
the origin of the transfer function path in the Nyquist
plane for the setup with electrolyte alone and the setup
with the sponge. On the contrary, the ETFE obtained
from white noise are more precise for low frequencies
but are more contaminated by noise on high frequen-
cies. With these ETFEs, differences of the tangents
at the origin can be obtained. Some improvements of
the setups can be made to improve these results.
This study can not conclude clearly on the modi-
fication of the order of the CPE and that another al-
ternative of the proposed model can be made to fit
the experimental data by taking into account a model
of the electrode by a CPE in parallel with a resis-
tor (R
p
). This model is well known in litterature but
with a capacitor and is proposed in (Robinson, 1968),
(Ragheb and Geddes, 1990) for example. This model
introduces a shift in the real part of the transfer func-
tion and the real part will tend to R
2
(R
p
+ R
1
+ R
2
)
for low frequency. A possible fit for the experimen-
tal data obtained with the sponge experiment, with a
shift and an α set to the same value as the experi-
ment with the electrolyte is given in Fig. 2 d) in black
dashed line. With this model, the introduction of the
sponge introduces a resistance in parallel with the
CPE. More works have to be followed to discrimi-
nate these two models. Other appropriate methods to
identify the system can be tested, with non integer ex-
ponents, like the ones proposed in (Djouambi et al.,
2007), (Djouambi et al., 2012) for example.
The differences in the dispersion of the data points
observed in the Nyquist plane in Fig. 2 between the
electrolyte setup and the sponge setup indicate that
the sponge improve the measures that are done. One
hypothesis is that the sponge improves the stability of
the electrodes in front of the electrolyte, in term of
movements and in term of the stability of the compo-
sition of the double layer of the metal electrolyte in-
terface. Complementary experiments must be done to
precise the influence of the medium in this improve-
ment of measures.
Another point is the equivalence of the proposed
model with the different part of the experimental
setup. If each electrode is modelised by a CPE, then
what we observed between the input and the output
of the system is the composition of two electrodes in
series, then two CPE. The equivalent circuit is given
in (Diard et al., 2013) and the equivalent impedance
is:
Z
e
(p) =
1
Q
1
p
α
1
+
1
Q
2
p
α
2
=
1
Q
1
p
α
1
1 +
Q
1
Q
2
p
β
where β = α
2
− α
1
with α
2
≥ α
1
. Either the order
is the same and β = 0, and an equivalent CPE of the
same order is obtained with Q
e
=
Q
1
Q
2
Q
1
+Q
2
, either one
order is less than the second and this one is prepon-
derant over the other on a given range of frequencies.
Finally, we have proposed results and discussions
on the transfer functions of the system. It is pos-
sible to switch to results and discussions with the
impedances, of the system, often proposed in other
studies, by using Eq. (1) and making some hypothe-
ses or tests on the value of R.
5 CONCLUSION
In this study an original system that can test the be-
havior of an EEG recorder observing simulated sig-
nals injected into a random medium is presented. The
system is described with an electrical circuit contain-
ing a constant phase element. Equations of the trans-
fer functions are analyzed to understand the theoret-
ical paths followed by the transfer function in Bode
or Nyquist representations. Comparison with exper-
imental results show that the proposed system and
model are pertinent for evaluating the non integer or-
der of some constant phase elements observed in the
system. Perspective of this study is the parametric
recursive identification of the system using methods
like in (Djouambi et al., 2012).
ACKNOWLEDGEMENTS
This project was funded in part from Institut Rhône
Alpin des Systèmes Complexes (IXXI). The authors
would like to thank Pierre Granjon, for excellent
discussions about impedance spectroscopy measure-
ments and analyses.
REFERENCES
Al-Nazer, R., Cattin, V., Granjon, P., Montaru, M., and
Ranieri, M. (2013). Broadband identification of bat-
tery electrical impedance for HEVs. IEEE Transac-
tions on Vehicular Technology, 62(7):2896–2905.
Experiments and Analysis for Fractional Order Modelling of an EEG Recording Process
565

Baillet, S., Riera, J. J., Marin, G., Mangin, J. F., Aubert, J.,
and Garnero, L. (2001). Evaluation of inverse meth-
ods and head models for EEG source localization us-
ing a human skull phantom. Phys. Med. Biol., 46:77–
96.
Becq, G. (2016). http://www.gipsa-lab.grenoble-
inp.fr/∼guillaume.becq/projets.html Python to
NI Codes. Technical report, Gipsa-lab, UMR 5216,
CNRS, INPG, UGA.
Becq, G., Bienkowski, G., Diard, J.-P., and Villard, C.
(2008). About MEA impedance measurement and
analysis. In Rakotondrabe and Chailet, N., editors, 6th
international meeting on substrate-integrated micro
electrode arrays, volume 5, pages 277–278. Springer-
Verlag.
Bédard, C. and Destexhe, A. (2009). Macroscopic models
of local field potentials and the apparent 1/f noise in
brain activity. Biophysics Journal, 96(7):2589–4608.
Boonstra, T. W., Houweling, S., and Muskulus, M. (2009).
Does asynchronous neuronal activity average out on a
macroscopic scale ? The Journal of Neurosciences,
29:8871–8874.
Collier, T. J., Kynor, D. B., Bieszczad, J., Audette, W. E.,
Kobylarz, E. J., and Diamond, S. G. (2012). Cre-
ation of a human head phantom for testing of elec-
troencephalography equipment and techniques. IEEE
TBME, 59(9):2628–2634.
Cooper, R., Osselton, J. W., and Shaw, J. C. (1969). EEG
Technology. Butterworth and co.
Dehghani, N., Bédard, C., Cash, S., Halgren, E., and Des-
texhe, A. (2010). Comparative power spectral analy-
sis of simultaneous electroencephalographic and mag-
netoencephalographic recordings in humans suggests
non-resistive extracellular media. Journal of compu-
tational neuroscience, pages 1–17.
Diard, J. P., Gorrec, B. L., and Montella, C. (2013). Hand-
book of electrochemical impedance spectroscopy.
Technical report, Bio-Logic.
Didier, R. (1984). Chimie Générale. Technique et Docu-
mentation, Lavoisier.
Djouambi, A., Charef, A., and Voda, A. (2007). Optimal ap-
proximation, simulation and analog realization of the
fundamental fractional order transfer function. Inter-
national Journal of Applied Mathematics and Com-
puter Science, 17(4):455–462.
Djouambi, A., Voda, A., and Charef, A. (2012). Recur-
sive prediction error identification of fractional order
models. Communications in Nonlinear Science and
Numerical Simulation, 17(6):2517–2524.
Geddes, L. A. (1997). Historical evolution of circuit mod-
els for the electrode-electrolyte interface. Annals of
Biomedical Engineering, 25:1–14.
Jones, E., Oliphant, E., Peterson, P., and al. (2001–
2016). Scipy: Open source scientific tools for python.
http://www.scipy.org/.
Jorcin, J.-J., Orazem, M. E., Pébère, N., and Tribollet,
B. (2006). CPE analysis by local electrochemical
impedance spectroscopy. Electrochimica Acta, 51(8-
9):1473–1479.
Leahy, R. M., Mosher, J. C., Spencer, M., and Huang, M. L.
J. D. (1998). A study of dipole localization accuracy
for MEG and EEG using a human skull phantom. Los
Alamos Technical Report LA-UR-98-1442.
Leys, S., Mackie, G., and Meech, R. (1999). Impulse con-
duction in a sponge. Journal of Experimental Biology,
202:1139–1150.
Ljung, L. (1987). System identification : theory for the user.
Prentice-Hall.
Logothetis, N. K., Kayser, C., and Oeltermann, A. (2007).
In vivo measurement of cortical impedance spectrum
in monkeys: Implications for signal propagation. Neu-
ron, 55(5):809–823.
Magin, R., Ortigueira, M. D., Podlubny, I., and Trujillo, J.
(2011). On the fractional signals and systems. Signal
Processing, 91(3):350–371.
Magin, R. and Ovadia, M. (2010). Modeling the cardiac tis-
sue electrode interface using fractional calculus. IFAC
Proceedings Volumes, 39(11):302–307.
Miller, K. J., Zanos, S., Fetz, E. E., den Nijs, M., and Oje-
mann, J. G. (2009). Decoupling the cortical power
spectrum reveals real-time representation of individ-
ual finger movements in humans. The Journal of Neu-
rosciences, 29:3132–3137.
Nunez, P. L. and Srinivasan, R. (2006). Electric fields of the
brain. Oxford university press.
Parker, G. H. (1919). The Elementary Nervous System. J. B.
Lipinncott Company The Washington Square Press.
Ragheb, T. and Geddes, L. A. (1990). Electrical properties
of metallic electrodes. Medical and Biomedical Engi-
neer and Computing, pages 182–188.
Robinson, D. A. (1968). The electrical properties of metal
microelectrodes. Proc. IEEE, 56:1065–1071.
Schwan, H. P. and Foster, K. R. (1980). RF-field inter-
actions with biological systems: Electrical properties
and biophysical mechanisms. Proc. IEEE, 68(1):104–
113.
Welch, P. D. (1967). The use of fast Fourier transform
for the estimation of power spectra: A method based
on time averaging over short modified periodograms.
IEEE TAU, 15(2):70–73.
Zoltowski, P. (1998). On the electrical capacitance of in-
terfaces exhibiting constant phase element behaviour.
Journal of Electroanalytical Chemistry, 443:149–154.
ICINCO 2017 - 14th International Conference on Informatics in Control, Automation and Robotics
566
