
Detection of Electroencephalography Artefacts using Low
Fidelity Equipment
Patrick Schembri, Richard Anthony and Mariusz Pelc
Department of Computer and Information Systems, University of Greenwich, Greenwich London, U.K.
Keywords: Artefacts, Classification, Brain Computer Interface, EEG, Electroencephalography.
Abstract: The use of Electroencephalography (EEG) signals in the field of Brain Computer Interface (BCI) has gained
prominence over the past decade, with the availability of diverse applications especially in the clinical
sector. The major downside is that the current equipment being used at medical level is specialized,
complex and very expensive. Our research goals are to further increase accessibility to this technology by
providing a unique approach in data analysis techniques, which in return will allow the usage of cheaper and
simpler EEG hardware devices targeted for end users. We use non-invasive BCIs designed on EEG, mainly
due to its fine temporal resolution, portability and ease of use. The main shortcoming of EEG is that it is
frequently contaminated by various artefacts. In this paper we provide vital groundwork by identifying and
categorizing artefacts using low fidelity equipment. This work forms part of a wider project in which we
attempt to use those artefacts constructively, when others try to filter them out. The main contribution is to
create awareness of the extent to which artefacts can be encountered, identified and categorized using off-
the shelf equipment. Our results illustrate that we are able to adequately identify and categorize the most
commonly encountered artefacts in a non-clinical environment, using low fidelity equipment.
1 INTRODUCTION
This paper discusses the artefacts of a non-invasive
BCI (Brain Computer Interface) on the basis of EEG
(Electroencephalography) where the signals will be
extracted from the electromagnetic (EM) brain
functions without the use of muscular activity.
Initially EEG was targeted for use in clinical
applications with patients that have medical
conditions such as Lou Gehrigs disease (Allison et
al., 2012). However over the past decade the use of
biomedical signals has also increased significantly in
non-clinical applications. This has led to the
development of a number of devices that can be
controlled by signals emitted from the brain.
At the present time, human BCI research has
been developing into two main areas; invasive and
non-invasive. The most prevalent invasive
techniques are called Electrocorticography (ECoG)
or intracortical recordings, which have their
electrodes in direct contact with the cerebral cortex
while the most prevalent non-invasive technique is
called Electroencephalography (EEG) which has its
electrodes placed along the scalp surface (Dornhege
et al., 2007). The qualitative difference between
these areas is that invasive BCI has a much better
signal quality with higher amplitudes and spatial
resolutions; it has a high signal-to-noise ratio and is
less susceptible to artefacts; however it requires a
surgical intervention for electrode placement. On the
other hand non-invasive BCI has a much weaker
signal and is prone to a number of different artefacts.
However it has an excellent temporal resolution
(Ball et al., 2009) and does not require any surgery.
In addition to using non-invasive BCI based on
EEG, our research also makes use of low cost off the
shelf equipment. The aim is to increase accessibility
to this technology by providing a unique approach in
data analysis techniques, which in return will allow
the usage of cheaper and simpler EEG hardware
devices targeted for end users. This paper does not
imply that the low fidelity equipment being used
could replace medical equipment; as a matter of fact
it does not have any certification; therefore it should
be employed sensitively for non-clinical trials.
(Frey, 2016) states that “Open-hardware initiative
does not aim at medical applications, hence it
should be employed in sensitive contexts.”
An artefact is a signal that is detected by EEG
equipment, which is not of cerebral origin but from
Schembri, P., Anthony, R. and Pelc, M.
Detection of Electroencephalography Artefacts using Low Fidelity Equipment.
DOI: 10.5220/0006398500650075
In Proceedings of the 4th International Conference on Physiological Computing Systems (PhyCS 2017), pages 65-75
ISBN: 978-989-758-268-4
Copyright © 2017 by SCITEPRESS – Science and Technology Publications, Lda. All rights reserved
65
various different sources. In the context of EEG,
artefacts are unwanted since they mask the brain
wave signals; however they could potentially be
used as a primary interface. According to the
glossary of the International Federation of Clinical
Neurophysiology (IFCN), the term artefact is
described as “A potential difference due to an
extracerebral source, recorded in EEG tracings”;
which is expanded to “A modification of the EEG
caused by extracerebral factors such as alterations
of the media surrounding the brain, instrumental
distortion or malfunction, and operational errors”
(Noachtar et al., 1999). Artefacts have always been
given great importance in the context of EEG due to
the undesirable affect that these have on the signal of
cerebral origin.
The work presented here is part of a larger EEG-
based project, and thus it is important to recognise
and understand the artefacts that are detectable.
These artefacts are usually an unwanted signal in the
context of EEG; however we are interested in using
them as part of a control interface. In this paper we
prepare the groundwork for filtering and using these
artefacts, through categorization of artefacts, and
their manifest characteristics, using specific low
fidelity equipment.
2 EMPIRICAL INVESTIGATION
OF EEG ARTEFACTS USING
OFF-THE-SHELF EQUIPMENT
Our work is concerned with exploring the
capabilities and limitations of low cost off the shelf
equipment which in return will facilitate and
increase accessibility for EEG applications. We aim
to compensate for the low fidelity aspect of this
equipment with enhanced software filtering and
analysis. This particular part of the work sets the
foundations for further work by investigating the
way in which various artefacts are detected,
identified and categorized with low fidelity
equipment.
A way in which an electrode (input1) is
connected relative to another electrode (input2) is
called a derivation. A collection of derivations are
called a montage and there are several different ones
in popular use. The intention of using a specific
montage is to keep the experiments tractable and to
avoid unnecessary complexity. Moreover other
types of montage; even the more complex such as
Laplacian and Common Average Reference; can be
derived from the collected data, since montage
reformatting is achieved by performing a simple
mathematical operation. In fact (Fisch, 1999) states
that “for this reason, digital EEG systems store the
original EEG signal in a referential montage
containing all electrodes”. This is of course possible
as long as all the electrodes that need to be
combined have in some way been referred to each
other in the original recording.
For instance when labelling a channel montage
as Fp1-A1, a mathematical expression is being
created which implies that the signal displayed will
be Fp1 minus A1. If a recording has been obtained
from Fp1-A1 and Fp2-A1 then Fp1-Fp2 can be
derived from:
(Fp1 - A1) - (Fp2 – A1) =
Fp1 - Fp2 + A1 - A1 = Fp1 - Fp2
(1)
Although montage reformatting is possible to be
performed instantaneously, this is ideally used for
recorded sessions and is not suggested for real-time
streaming.
2.1 Equipment Used
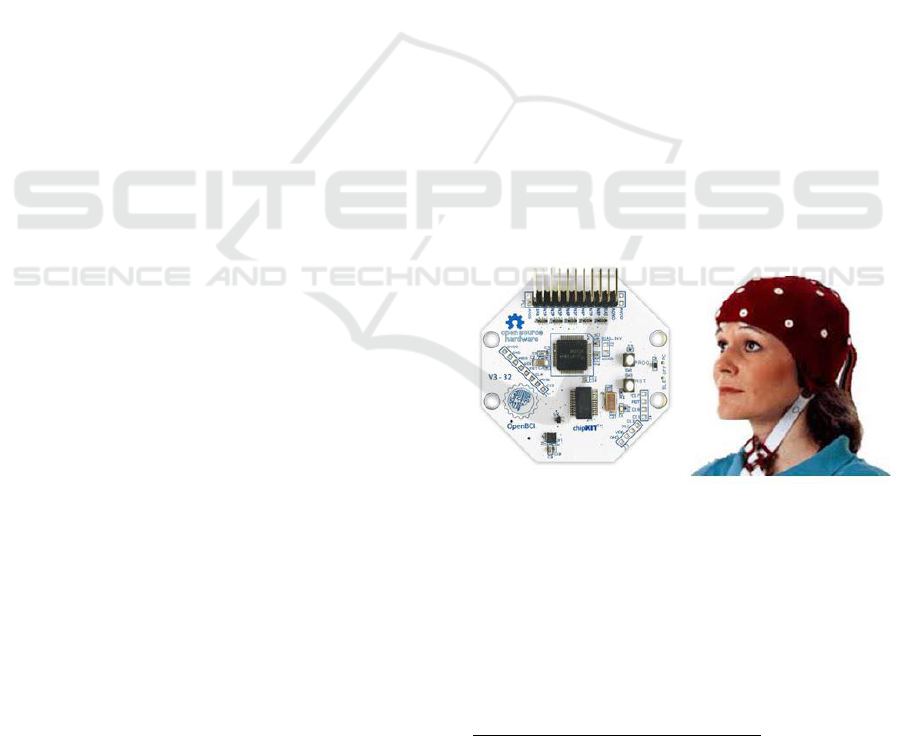
The work reported herein is based on an OpenBCI
1
32-bit board connected with an Electro-Cap
2
using
the international 10/20 system for scalp electrode
placement in the context of EEG experiments. A
basic overview of the equipment being used is
shown in Figure 1.
Figure 1: OpenBCI Board and Electro-CAP.
The OpenBCI 32-bit’s board microcontroller is the
PIC32MX250F128B
3
which includes a 32-bit
processor with a maximum speed of 50MHz; storage
of 32KB of memory and is Arduino compatible.
The board uses the ADS1299
4
IC developed by
Texas Instruments, which is an 8-Channel, 24-Bit,
simultaneous sampling delta-sigma, Analogue-to-
1
http://openbci.com/
2
http://electro-cap.com/
3
http://www.microchip.com/wwwproducts/en/en557425
4
http://www.ti.com/product/ADS1299
PhyCS 2017 - 4th International Conference on Physiological Computing Systems
66

Digital Converter used for bio potential
measurements such as in EEG and
Electrocardiography (ECG). The 24-bit resolution
gives a huge range of microvolts (µV) that covers +-
187mV (187000µV); the working is shown in
section 2.2. When considering that EEG data ranges
are typically between +-100µV, it illustrates that it is
able to provide a broad spectrum of flexibility and
scalability. Moreover this chip is capable of
supporting up to 16,000Hz although the transfer of
that much data through an Arduino would be
impracticable. There is the ability to use the SD card
for faster sample rates, which is discussed below.
The board comes with eight bio potential input
channels which can be increased to sixteen channels
with the addition of a Daisy Module; which plugs
itself onto the existing OpenBCI 32-bit board. Our
current experiments do not make use of the daisy
module, although future experiments may need these
extra channels.
The system comes with a pre-programmed USB
dongle for wireless communication which
communicates with the low cost RFDuino
5
RFD22301 microcontroller built on the OpenBCI
board. This microcontroller can communicate
wirelessly with any device compatible with
Bluetooth Low Energy (BLE). In addition a local
Secure Digital (SD) slot is built-in the board, which
gives it the ability to store recorded data on SD
memory card. This is particularly useful when
requiring improved portability and highest data
rates.
An additional feature which is included in the
OpenBCI board is a 3-axes accelerometer from ST
with model LIS3DH
6
. This accelerometer is capable
of 16 bit data output and of measuring accelerations
with output data rates from 1 Hz to 5.3 kHz. This
can prove to be quite useful; such as, for sensing
change in orientation of the head or sensing rough
motion. In these cases the value from the
accelerometer would suggest that motion artefacts
would be within the EEG data. In our experiments
this information was not required, since the board
was firmly placed on the desk. However in the
future we are planning on using the OpenBCI
Ultracortex MK4 cap, which has the ability of
attaching the board to the actual headset, where the
data from the accelerometer would be extremely
valuable. Figure 2 depicts a graphical representation
of these components.
5
http://www.rfduino.com/
6
http://www.st.com/en/mems-and-sensors/lis3dh.html
Figure 2: OpenBCI Board Components.
The Electro-Cap being used in our experiments has
the fabric which is made from elastic spandex and
has recessed pure tin wet electrodes directly attached
to the fabric. The term wet electrodes type, implies
that the use of an electrolyte gel is required to make
effective contact with the scalp; otherwise it may
result in impedance instability.
2.2 Experimental Setup
The EEG signals where sampled at 250Hz (this
being OpenBCIs default value) while the sampling
precision was 24-bit. The recordings where stored
anonymously as raw data in text, comma separated
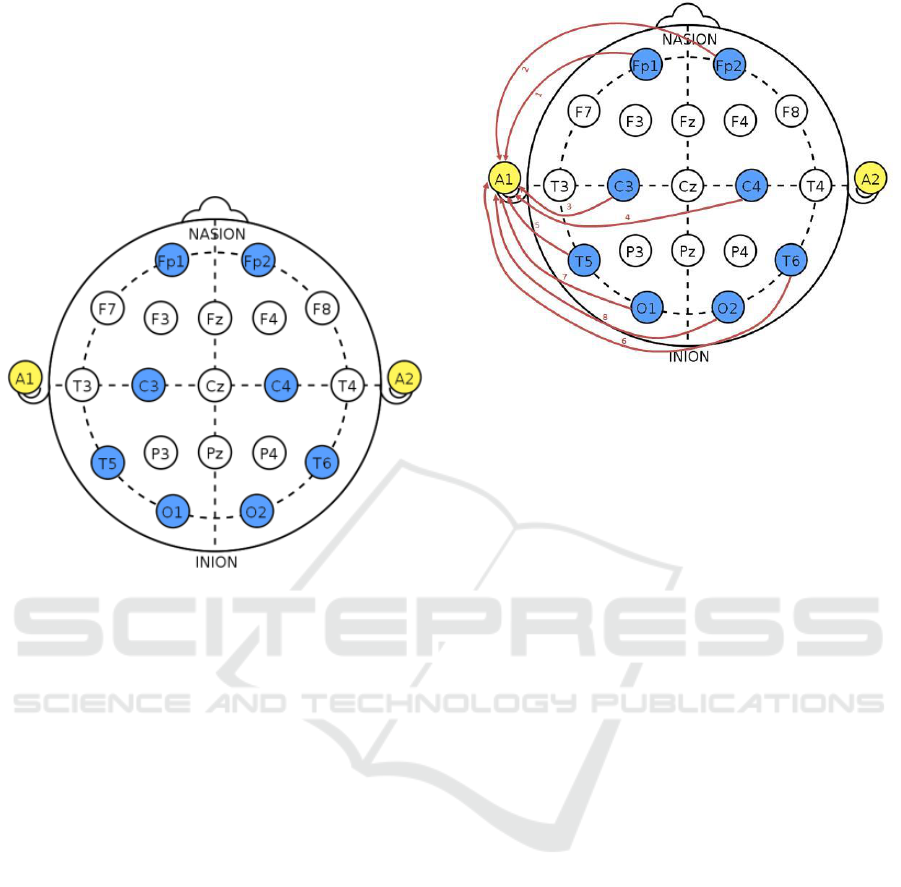
value (csv) files. Eight EEG electrodes where used
in different regions of the scalp according to the
International 10-20 System as shown in Figure 3.
This system is the de facto standard for the
placement of electrodes along the head. Each
electrode is assigned a letter to identify the lobe and
a number to identify the hemispheric location. The
letters F, P, T and O stand for Frontal, Parietal,
Temporal and Occipital lobes. In addition, letter C
refers to the central area of the brain. The even
numbers represent the electrodes positioning on the
right hemisphere, while the odd numbers represent
the electrodes positioning on the left hemisphere.
The Xz stands for a zero and represents an electrode
placed on the midline such as Fz, Cz and Pz. In
addition the letter A can represent the reference
electrode which will measure the potential
difference between itself and the other electrodes
and/or the ground electrode for common mode
rejection.
The equipment we are using supports the use of
eight electrodes. The electrode positions Fp1, Fp2,
C3, C4, T5, T6, O1 and O2 are selected because
they provide good coverage for detecting these
artefacts. These are referenced to the electrode A1 as
follows: Channel 1: Fp1; Channel 2: Fp2; Channel
3: C3; Channel 4: C4; Channel 5: T5; Channel 6:
T6; Channel 7: O1; Channel 8: O2 as shown in
Figure 3. A referential montage was selected to
Detection of Electroencephalography Artefacts using Low Fidelity Equipment
67
analyse how artefacts are exposed with this setup,
even though no single reference electrode is ideal for
all situations. Nonetheless and if required, other
types of montage can be reconstructed from the
chosen montage by executing a simple mathematical
operation; as previously explained. The reference
electrode was placed on the left earlobe A1 as shown
in Figure 4.
Figure 3: Electrode placement following the International
10-20 system.
EEG signals where obtained from a healthy human
subject; male in the age group between 30 and 40
years old and on three different sessions with a few
days apart. Before the start of the experiments, the
subject was asked to calm down in a seated position
and relax for a few minutes. The subject was seated
one meter away from the equipment. The researcher
and his equipment where situated on the left side of
the subject. Then, the subject was instructed on a
series of tests such as muscle movement that are
designed to detect the artefacts which are discussed
in Section 3.
Three trials where conducted for these
experiments. The first session results and recordings
where archived. The second session was done on a
separate day with the same conditions of the first
session and the results where archived for
comparisons. These two sessions were carried out to
familiarize the user with the equipment and the
methodology of the experiments. The third session
was done a day later with the same conditions of the
first and second session and the results are shown in
this paper. During the recording the subject received
a 2 second beep sound to perform the requested trial
and a 1 second beep sound to stop.
Figure 4: Referential Montage used.
2.3 Processing
The data that was transmitted from the RFDuino
module found on the OpenBCI board is considered
as ‘raw’ EEG data in ADC counts. These where
transferred as 24-bit integer, since it’s the native
format used by the ADS1299 chip. Since this is an
unusual format, it was immediately converted via
the OpenBCI open-source JAVA function
‘interpret24bitAsInt32’ into a 32-bit signed integer
(Audette, 2014).
Subsequently the scale factor was required,
which is the multiplier used to convert the EEG
values from counts to scientific units like volts. This
is found by following the formula in the ADS1299
datasheet table number 7:
Scale Factor = V
REF
/ (2
23
-1) / Gain * 1000000
(2)
The datasheet also states that the voltage
reference input is hardware bound to 4.5volts, while
we used the maximum and default gain factor of 24-
bit. Thus the formula (2) can be reformed into:
Scale Factor = 4.5v / (2
23
-1) / 24 * 1000000
(3)
Hence the scale factor value is 0.02235 per
count. Therefore the 32-bit signed integer is
multiplied by the scale factor and we get the EEG
data values in microvolts (µV). This is the actual
stored data in the csv file. The full scale of +-
187mV (187000µV) discussed in Section 2.1 is
achieved by 2
23
* 0.02235 = +-187485.388µV.
As previously mentioned the ADS1299 chip is
capable of a sample rate of up to 16,000Hz; however
in our experiments we used OpenBCIs default rate
of 250Hz especially when considering that the data
was being transmitted wirelessly through the
RFDuino module.
PhyCS 2017 - 4th International Conference on Physiological Computing Systems
68

The captured raw data was imported in
MATLAB R2014a
7
via the csvread command into a
MATLAB matrix and any unnecessary rows and
columns were removed. These consisted of the first
five rows which are superfluous comments; the first
column which stored the sample index / packet
counter and the last three columns which stored the
auxiliary data of the accelerometer.
The MATLAB array was later imported into
EEGLAB
8
for processing and for offline qualitative
and quantitative analysis. The first process was to
apply a 50Hz (60Hz in some countries) notch filter
to eliminate the environmental electrical
interference, which was only omitted for the
50/60Hz artefact experiment. In addition a high pass
filter was applied at 0.5Hz to remove the DC offset
and a low pass filter of 49Hz was applied to remove
any signal harmonics and unnecessary frequencies
which are not beneficial in our experiments. As an
alternative a band-pass filter of 0.5Hz-49Hz could
have been chosen, however it was not selected since
this type of filter does not attenuate all frequencies
outside the range. In fact the filter’s frequency
response function is not very steep; it doesn’t
completely cut-off at the required frequency, but
instead it rolls off more gently with the frequency.
The result from this processing yields a rich EEG
signal for our experiments which can be analysed
with different tools. The screenshots presenting the
EEG signal (see Figures 5-15) where plotted by
using the EEGLAB Plot: Channel Data (Scroll)
menu option. The frequency-time domain
screenshots where produced by the Time-Frequency
transforms: Channel-time frequency menu option.
The plot Event Related Spectral Power (ERSP) was
employed since it is a statistical measure; the mean
of a distribution of single-trial time/frequency
transform (Neuper & Klimesch, 2006). In our
processing we used the Fast Fourier Transform
(FFT) option; 400 time points for the time-frequency
decomposition and the frequency was set between
one and forty which provides us with enough
information for artefacts detection. The baseline was
set to the default of 0 for pre-stimulus and the single
trial DIV baseline option was used. Subsequently the
choice of channel number and time range in relation
to the experiment being analysed where entered
(such as Channel 1 for FP1; time range 5000ms –
9000ms).
The spectrogram frequency-domain screenshots
were produced in Matlab; outside of EEGLAB. The
7
https://www.mathworks.com/products/matlab.html
8
https://sccn.ucsd.edu/eeglab/
data was filtered using Butterworth filter design of
the second order. First a notch filter was used
followed by a low pass and a high pass filter; with
the same values used for EEGLAB. The actual code
for the filtering and the spectrogram are shown in
the appendix section.
3 ARTEFACTS - RESULTS
Although a number of research papers have been
published showing different types of artefacts such
as (AYDEMIR et al., 2012) and (Begum, 2014);
these were presented with a “black box” approach or
using medical equipment, or otherwise, mentioned
in a different context. What we present in this paper
are results that are relevant to our own specific low
fidelity hardware.
An EEG device is very sensitive and it is easily
susceptible to disruption from other electrical
activities. Moreover some artefacts are easily
distinguishable while others closely resemble
cerebral activity and are very challenging to be
recognized. Artefacts are usually categorized as
physiological (biological) and non-physiological
(extra physiological) (Fisch, MD, 2000). The
classification mentioned below is not rigorous; for
instance, if the subject makes a movement, this may
lead to artefacts originating as electrode artefact.
Even though signal artefacts caused by non-brain
wave signals can be problematic when studying
brain waves directly, the signal artefacts themselves
could be used directly as command signals within an
interface.
3.1 Physiological Artefacts
Physiological artefacts are bioelectrical signals that
are generated from the user’s body excluding the
brain. These are usually embedded along the
electrical cerebral bio-signals in an EEG session.
The physiological artefacts include, but are not
limited to:
3.1.1 Ocular Artefacts
Ocular artefacts are essentially a result from the
eyeball acting as a dipole which becomes pertinent
when it develops into a moving electrical field such
as when the subject opens and closes his eyes and/or
the EMG potentials from muscles in and around the
orbit. These generate signals that are detected
predominantly by electrodes Fp1/Fp2 and F7/F8.
Detection of Electroencephalography Artefacts using Low Fidelity Equipment
69
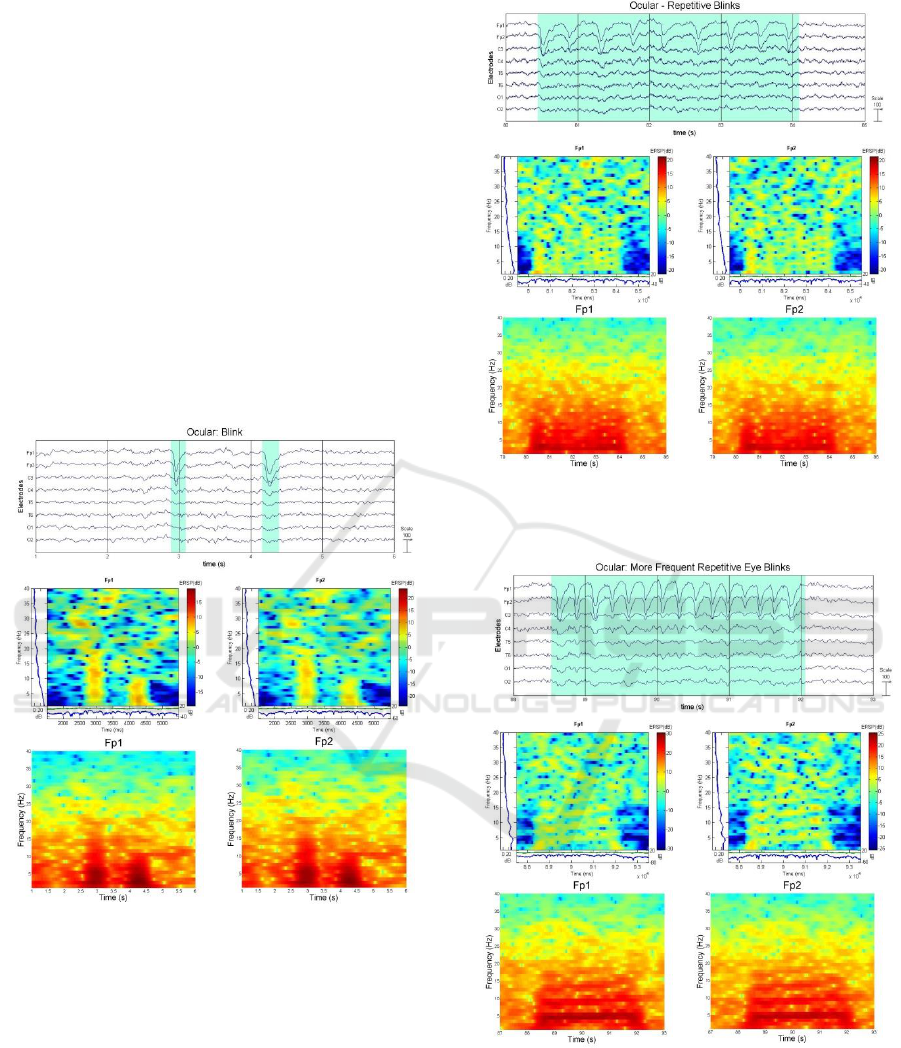
1) Blink: blink/blinking which is the most
common ocular artefact, occurs spontaneously and is
very challenging for the subject to control even for
short periods of time. When the subject blinks, the
eyeball triggers an instinctive upward movement
(Bells phenomenon) and hence produces a positive
potential in the frontal lobe which is displayed in
EEG as a transient, diphasic, synchronous slow
wave (Misra & Kalita, 2005) (Stern, 2005)
(Sovierzoski et al., 2008) as shown in Figure 5. This
image also shows that, the faster the blink the
shorter the wavelength, as depicted by the first blink
occurrence which was faster than the second blink.
When the subject performs a number of repetitive
blinks, the displayed EEG could mimic a triphasic
wave or resemble rhythmic delta activity as shown
in Figure 6. Additional and more frequent blinking
can simulate theta activity as shown in Figure 7.
Figure 5: Ocular Artefact - Eye Blink predominantly on
Electrodes Fp1 and Fp2 (Plot, ERSP, and Spectrogram).
Figure 6: Ocular Artefact – Repetitive Eye Blinks (Plot,
ERSP, and Spectrogram).
Figure 7: Ocular Artefact – More Repetitive Eye Blinks
(Plot, ERSP, and Spectrogram).
2) Eye Flutter: Eye Flutter produces an ocular
artefact that is more rhythmic, with higher frequency
and lower amplitude as shown in Figure 8.
PhyCS 2017 - 4th International Conference on Physiological Computing Systems
70
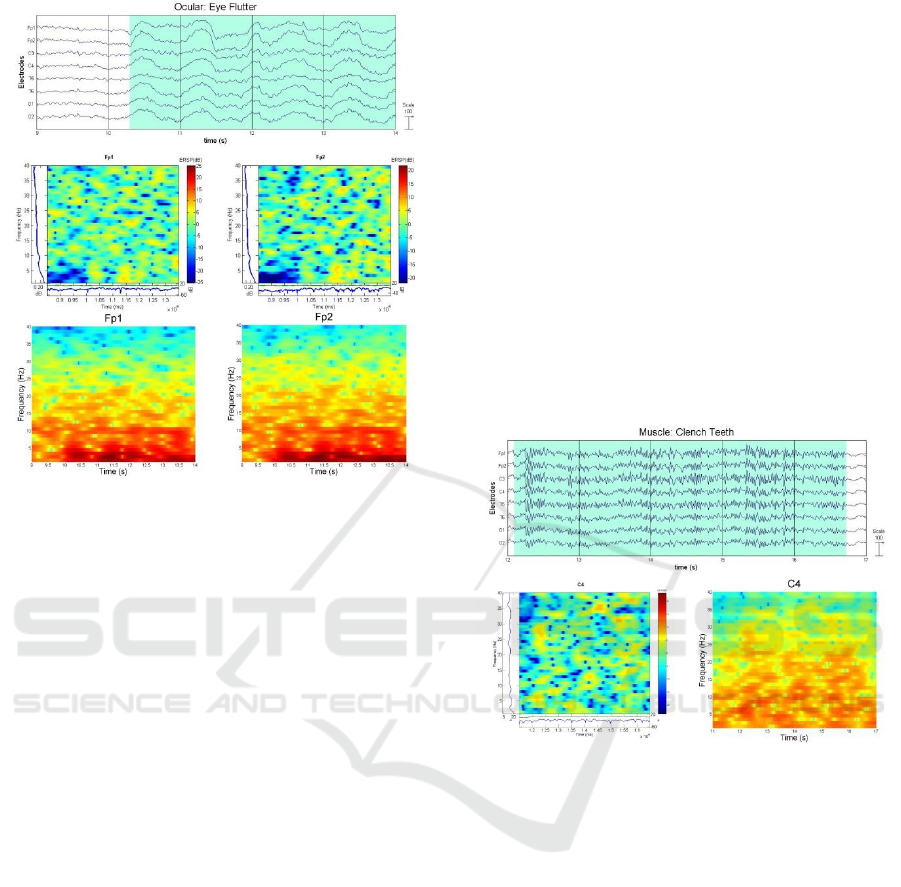
Figure 8: Ocular Artefact – EyeFlutter (Plot, ERSP, and
Spectrogram).
3) Lateral Eye Movement: Lateral Eye
movement artefact is mostly detected in a bipolar
longitudinal montage using Fp1-F7 and Fp2-F8 and
may start off with a single sharp muscle potential
called lateral rectus spike. In this type of montage a
left lateral eye movement will have a positive
potential in electrode F7 and an opposite negative
potential in electrode F8. In our referential montage,
the frontal origin of eye movement artefacts
remained indistinguishable due to the reference
electrode (A1) being contaminated by eye
movements (Fisch, MD, 2000).
4) Slow Roving Eye Movement: Slow Roving
eye movement differs from lateral eye movement
since no saccades occur; consequently resulting in
no abrupt changes. On a bipolar montage these are
reflected as smooth lateral movements with phase
reversing. On a referential montage using low
fidelity equipment, this artefact was not detected.
3.1.2 Muscle Artefacts - EMG
(Electromyography) Activity
EMG activity produces artefacts that are due to
muscle contraction and are the most common and
significant noise source in the context of EEG.
Although EMG in itself is useful for
electromyography; they are considered noise in
EEG, since they overlap and obscure the EEG signal
due to their higher amplitude and frequency. If,
however, this signal is passed through a low-pass
filter set at 35Hz or less, this will change their form
and caution is required since these may transpire as
beta activity or like abnormal epileptiform spikes.
The extent of a muscle artefact depends on the
duration of the muscle activity, which might be less
than a second and/or throughout the entire session
(Stern, 2005) (Fisch, MD, 2000) (Misra & Kalita,
2005).
1) Surface EMG: Surface EMG activities
generally occur in regions with underlying muscle
such as the masseter and temporalis muscle, which
affect the frontal and temporal electrodes. These
may also disseminate and diffuse to other channels.
Electrodes Fz, Cz and Pz can provide a reasonably
pure EEG signal. Figure 9 shows an EMG effect
when the subject clenches his teeth. ERSP
screenshot doesn’t show any recognizable activity.
Figure 9: Muscle Artefact – Clench Teeth (Plot, ERSP,
and Spectrogram).
2) Glossokinetic: Glossokinetic is an artefact
arising from the movement of the tongue. It is
similar to the eyeball movement in ocular artefacts,
though less sharp. The tongue functions as a dipole
where the tip acts as a negative with respect to the
positive base. This results in the surging of diffuse
delta like activity, which is frequently supplemented
by muscle artefact. The tongue has a DC potential
and equipment running on DC amplifiers will not
record its potential as is the case in the equipment
being used for this experiment.
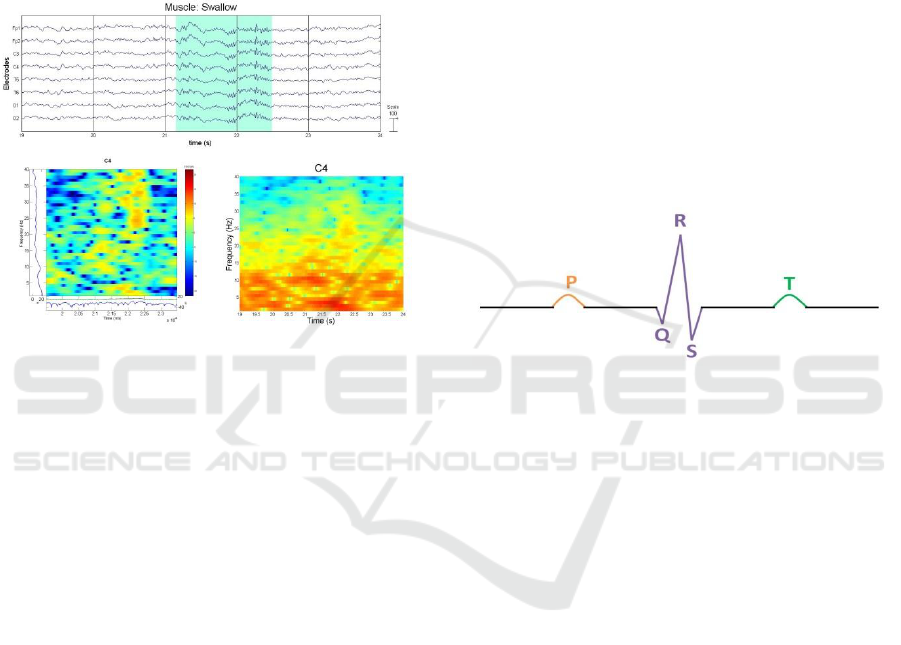
Figure 10 shows the effect of swallowing in our
subject which affects the oropharyngeal muscle.
This experiment could have been included in the
Surface EMG section, since no tongue potential is
being recorded, but is being listed here for
classification reasons.
Detection of Electroencephalography Artefacts using Low Fidelity Equipment
71
3) Intermittent Photic Stimulation (IPS):
Intermittent Photic Stimulation (IPS) / is a
photomyogenic / photomyoclonic response to a
visual stimulation where the subject eyes are
presented with intermittent flashes of light. This
results in an involuntary time linked facial muscle
response to the flash of light which affects the
frontal and periorbital regions, specifically the
frontalis and orbicularis muscles (Shamsaei, n.d.).
At this stage in our work we don’t include this.
Figure 10: Muscle Artefact – Swallow (Plot, ERSP, and
Spectrogram).
3.1.3 Movement Artefacts
Movement during an EEG session may produce two
distinct artefacts; instrumental from the movement
effect on the electrodes and their leads as discussed
in the Equipment Artefacts section below; and
biological through the generation of electrical fields
from muscle contraction; EMG activity; as discussed
in the Muscle Artefacts section above.
3.1.4 Cardiac Artefacts
Electrocardiography (ECG) is the process of
recording electrical activity from the heart. The heart
produces a considerable electrical field that spreads
to the base of the skull, which is detectable in an
EEG session. This artefact is easily detected in a
referential montage since there is ample
interelectrode distance between the reference which
is located on the ear lobe and the other electrodes
which are located on the scalp. In addition this
artefact is most prominent in subjects with a short
neck. This artefact appears as a QRS complex which
represents three graphical deflections in an ECG
diagram. The QRS complex is preceded by a P wave
and followed by a T wave as shown in Figure 11.
With clinical EEG equipment using a referential
montage setup; a poor QRS complex was formed.
This was due to the distance from the heart where
the P wave and T wave are not visible (Fisch, MD,
2000) (Stern, 2005). ECG artefact may be reduced
or removed by adding a second reference; however
it will only work if both reference electrodes are able
to detect a pulse (Spriggs, 2010). Unfortunately we
were unable to reproduce this artefact using low
fidelity equipment. It is true that the artefact is a
poorly formed QRS complex which is most
prominent in short necks and could have been easily
concealed within the noise; but that does not negate
the fact that we should have at least encountered it
even as a low amplitude signal. We have tried
several types of filters but without any apparent
result. We were however able to produce an ECG
signal on purpose; not as an artefact; with a different
set-up, which however is beyond the scope of this
paper.
Figure 11: QRS Complex.
3.1.5 Pulse Wave Artefact
Pulse artefact mainly occurs when electrodes are
placed over a pulsating artery manifesting a regular
pulse beat. These pulsations instigate periodic slow
waves that can be misidentified as EEG activity.
There is a direct link between ECG and pulse waves;
where the QRS complex happens right before (about
200ms) the pulse waves. In our experiments the
electrodes where not placed over a pulsating artery
and thus it did not show in our experiments.
3.1.6 Skin Potential
Skin potentials where discussed in Non-
Physiological Artefacts, explicitly under Equipment
Artefacts which included Perspiration and Salt
bridges.
3.2 Non-Physiological Artefacts
Non-Physiological artefacts are externally generated
outside the user’s body such as artefacts arising from
environmental electrical interference and artefacts
relating to the equipment being used.
PhyCS 2017 - 4th International Conference on Physiological Computing Systems
72
3.2.1 Environmental Electrical Interference
Environmental Electrical Interference: 50/60Hz
Artefact; The most common electrical interference
artefacts usually emanate from electrical devices and
in close proximity to power lines. The greatest
contributor is the alternating current (AC) with a
monomorphic frequency of either 60Hz (ex. United
States) or 50Hz (ex. Europe). These artefacts can be
introduced either electromagnetically, where the
strength of the field is determined by the current
flowing through cables or by the equipment such as
transformers and TV power supplies; and
electrostatically due to the capacitance property of
objects where the subject or electrodes pick up
capacitance potentials from other sources which are
in their proximity such as the movement of any
charged bodies or objects (ex. plastic, rubber,
synthetic fibres) near the subject (Fisch, MD, 2000)
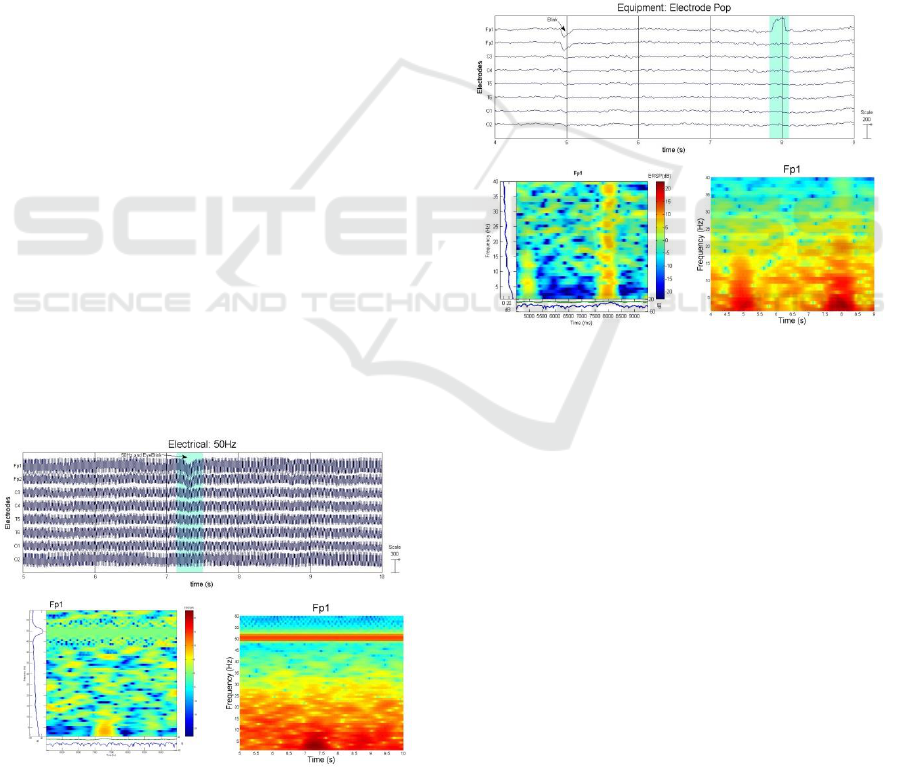
(Binnie et al., 1982). Figure 12 shows the effect of a
50Hz noise on our EEG signal.
This artefact can be reduced by grounding the
equipment, moving the subject away from power
lines and sources that can generate electrostatic
interference and keeping electrodes impedance to
less than 5KΩ which is the leading cause of the
50/60Hz artefact (Spriggs, 2010). Should these
methods not suffice; the artefact can be eliminated
by a notch-filter (or similar) which will only remove
the 50Hz or 60Hz activity from the signal. The filter
should only be used if necessary.
Radio Frequency / Mains-Borne: Other electrical
interferences which are less prominent include
Radio Frequency when they are modulated in a
lower frequency and Mains-Borne interference
arising from fluctuating power supplies.
Figure 12: Electrical Artefact: 50Hz (Plot, ERSP, and
Spectrogram).
3.2.2 Equipment Artefacts
A number of different artefacts can be caused from
the recording electrodes and the equipment being
used. Electrode artefacts can manifest as two
dissimilar waveforms; low frequency rhythms
amidst a scalp area and brief transient morphology
which would be limited to one electrode (Stern,
2005).
Electrode Pop: Electrode Pop can occur
occasionally when there is an instantaneous change
in the electrical potential between the electrode and
the scalp, where it is typically followed by a sudden,
high amplitude spike in the EEG recording (Barlow,
1986) as shown in Figure 13. This may occur when
electrodes are not firmly attached and/or when direct
pressure is applied on the electrodes.
Figure 13: Equipment Artefact: Electrode Pop (Plot,
ERSP, and Spectrogram).
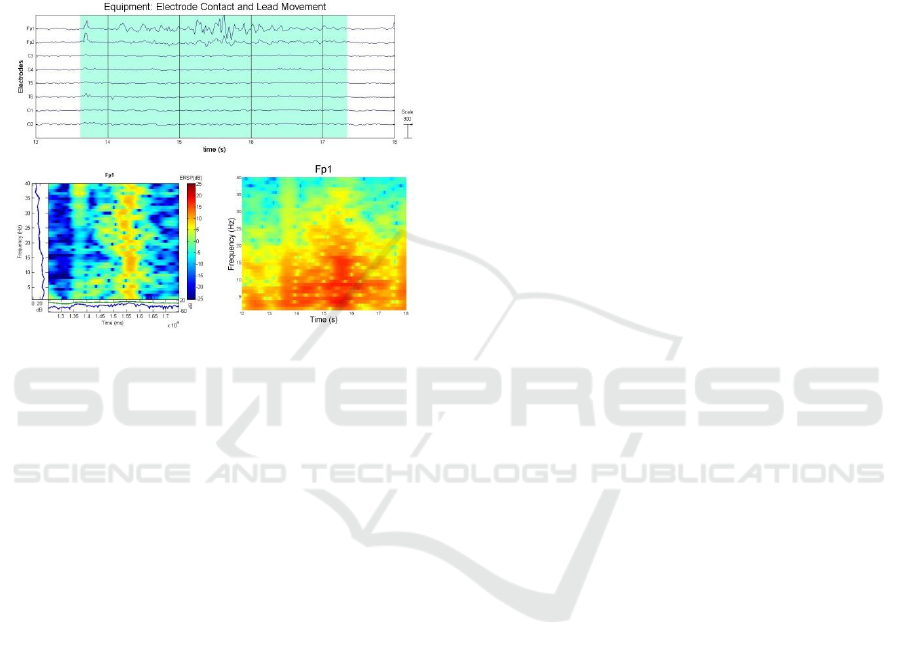
Electrode Contact and Lead Movements: A weak
Electrode Contact and Lead Movements generate a
different artefact that has a less sustained
morphology compared to electrode pop as shown in
Figure 14. The weak electrode contact results in
impedance instability, which will produce waves
with fluctuating amplitude and morphology;
although if there is a context of rhythmic movement
such as from tremors, the resulting waves may be
rhythmic as well. Lead movements do not resemble
any true EEG activity where the morphology of the
wave is incoherent (Stern, 2005).
Salt Bridge: A Salt Bridge artefact can occur
when smearing the electrolyte gel between two
electrodes or by applying an excessive amount of
electrolyte gel, which may result in an inadvertently
overlap, thus creating a short circuit between the
electrodes. This artefact is usually channel specific
and manifested as a low amplitude wave compared
to the background. Salt bridge artefact will
Detection of Electroencephalography Artefacts using Low Fidelity Equipment
73
eventually be prevented by use of dry electrodes;
which we plan to do in our future experiments.
Perspiration: Perspiration artefact although not
as stable, is similar to a salt bridge artefact where the
salinity between electrode locations will merge the
affected electrodes as a single entity. It is usually
manifested as a slow wave that is typically greater
than 2 seconds in duration which is out of the
frequency scope of EEG (Stern, 2005) (Fisch, MD,
2000).
Figure 14: Equipment Artefact: Electrode Contact and
Lead Movement (Plot, ERSP, and Spectrogram).
Salt Bridge and Perspiration artefacts can be easily
recognized in an EEG session and should be
resolved prior to commencement. The salt bridge
artefact is eliminated by cleaning the excess
electrolyte between the affected electrodes and
wiping the subjects forehead with a spirit solution,
while the perspiration artefact can be eliminated by
providing a cooler environment and reducing the
emotional stress of the subject. The experiments
reported here where based on a referential montage,
where these artefacts where not present. The lack of
these findings suggests that an electrolyte bridge is
only present amongst electrodes such as in a bipolar
montage.
4 CONCLUSION
Non-invasive BCIs designed on EEG provides fine
temporal resolution, portability and ease of use
however the signal is frequently contaminated by
various artefacts. EEG processing and analysis
require accurate information and it is vital that these
artefacts are recognized and classified so that it
would be possible to eliminate or prevent them from
occurring, or otherwise, attempt to use them
constructively.
Previous investigations in this research area
where made using expensive medical EEG
equipment and were usually categorized using
different type of montages, which made it
challenging for comparisons. Moreover only a few
of these artefacts have been documented
successfully using low fidelity equipment and this
documentation has been ad hoc and not categorized
properly.
Due to the proliferation of cheap EEG
equipment, including user-made equipment such as
(Wang et al., 2016), an evident necessity to validate
the equipment’s suitability was present. Moreover in
recent times, a number of researchers and end-users
are using low fidelity equipment as a “black box”
approach (Lecoutre et al., 2015), without any
qualitative testing on the equipment being used.
Part of our contribution was to create awareness
of what type of hardware components are being
utilized in low fidelity equipment, vis-à-vis the
results achieved. This would ultimately facilitate the
possibilities of using off-the-shelf EEG equipment
as a cheap alternative to medical EEG equipment. It
is important to note that this paper does not imply
that low fidelity equipment should replace medical
equipment; our purpose is to assess the suitability of
such equipment for non-clinical trials.
In this paper, a successful approach in identifying
and classifying artefacts using low fidelity
equipment on a referential montage is presented.
The promising results achieved show that the most
common artefacts observed in a non-clinical
environment are being effectively identified and
categorized while using the aforementioned
equipment.
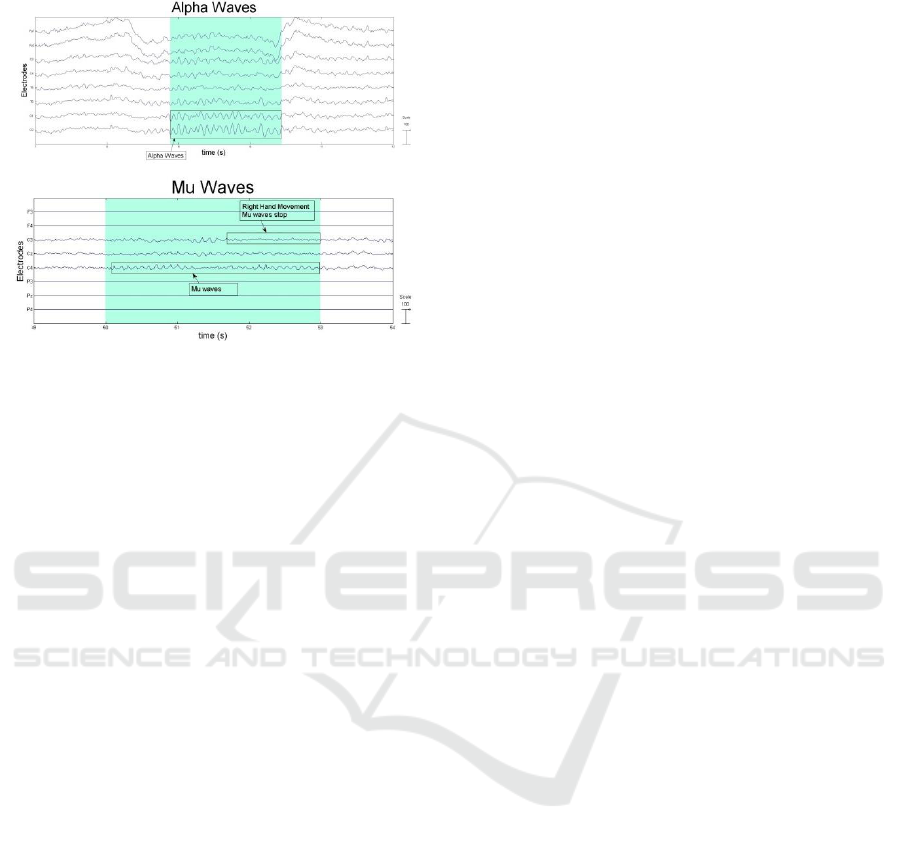
5 FUTURE WORK
Future research work includes the capability of low
fidelity equipment, to accurately capture Mu and
Alpha waves/rhythms which can be processed to
perform tasks such as motor control functions. Some
initial results are shown in Figure 15, where the
Alpha waves are predominantly seen in the occipital
lobe, specifically on O1 and O2 electrodes, whereas
the Mu waves are predominantly found around the
central area of the brain known as “central sulcus”,
specifically on C3, Cz and C4 electrodes in our
figure. In addition we are also interested in exploring
the idea of using some of these artefacts
PhyCS 2017 - 4th International Conference on Physiological Computing Systems
74
constructively in concurrence with actual brain wave
signals.
Figure 15: Initial results for Alpha & Mu Waves.
REFERENCES
Allison, B.Z. et al., 2012. Towards Practical Brain-
Computer Interfaces. Springer.
Audette, C., 2014. Data Format for OpenBCI V3. [Online]
Available at: “https://github.com/OpenBCI/OpenBCI-
V2hardware-DEPRECATED/wiki/Data-Format-for-
OpenBCI-V3” [Accessed February 2017].
Aydemir, O., Pourzare, S. & Kayikcioglu, T., 2012.
Classifying Various EMG and EOG Artifacts in EEG
Signals., 2012.
Ball, T. et al., 2009. NeuroImage. Signal quality of
simultaneously recorded invasive and non-invasive
EEG.
Barlow, J.S., 1986. Automatic Elimination of Electrode-
Pop Artifacts in EEG's. IEEE Transactions on
Biomedical Engineering, Vol. BME-33, No. 5.
Begum, B.S., 2014. A Review on Machine Learning
Algorithms in Handling EEG Artifacts. The Swedish
AI Society (SAIS) Workshop SAIS, 14.
Binnie, C.D., Rowan, A.J. & Gutter, T.H., 1982. A
Manual of Electroencephalographic Technology.
Cambridge University Press.
Dornhege, G. et al., 2007. Toward Brain-Computer
Interfacing. Massachusetts Institute of Technology.
Fisch, MD, B., 2000. EEG Artifacts. LSU Medical Center.
Fisch, B.M., 1999. Basic Principles of Digital and Analog
EEG. Elsevier.
Frey, J., 2016. Comparison of an Open-hardware
Electroencephalography Amplifier with Medical
Grade Device in Brain-computer Interface
Applications. In PhyCS., 2016. SCITEPRESS –
Science and Technology Publications.
Lecoutre, L. et al., 2015. Evaluating EEG Measures as a
Workload Assessment in an Operational Video Game
Setup. In PhyCS., 2015. SCITEPRESS – Science and
Technology Publications.
Misra, U.K. & Kalita, J., 2005. Clinical
Electroencephalography. Elsevier.
Neuper, C. & Klimesch, W., 2006. Event-Related
Dynamics of Brain Oscillations. Elsevier.
Neuroscience, S.C.f.C., 2016. EEGLab. [Online]
Available at: "http://sccn.ucsd.edu/eeglab/"
Noachtar, S. et al., 1999. A glossary of terms most
commonly used by clinical electroencephalographers
and proposal for the report form for the EEG findings.
International Federation of Clinical Neurophysiology.
Chapter 1.5.
Shamsaei, G.R., n.d. Review Of Clinical
Electroencephalography. Jundishapour University of
Medical Sciences.
Sovierzoski, M.A., Argoud, F.I.M. & Azevedo, F.M.d.,
2008. Identifying Eye Blinks in EEG Signal Analysis.
In IEEE., 2008.
Spriggs, W.H., 2010. Essentials of Polysomnography.
Jones and Bartlett Publishers, LLC.
Stern, J.M., 2005. Atlas of EEG Patterns. Lippincott
Williams & Wilkins.
Wang, P., Li, S., Shao, M. & Liang, C., 2016. A Low-Cost
Portable Real-Time EEG Signal Acquisition System
Based on DSP. International Journal of Signal
Processing, Image Processing and Pattern
Recognition, pp.239-46.
APPENDIX
Matlab code that includes filtering used for
displaying spectrogram screenshots.
fs = 250;
nfl = 49;
nfh = 51;
fl = 49;
fh = 0.5;
order = 2;
%Butterworth notch filter
[bn,an]=butter(order,[nfl
nfh]/(fs/2),'stop');
%Butterworth low pass filter
[b,a]=butter(order,lp/(fs/2),'low');
%Butterworth high pass filter
[b,a]=butter(order,fh/(fs/2),'high');
%Spectrogram
spectrogram(eegdata_f,hanning(256),2
55,[1:40],250,'yaxis');
Detection of Electroencephalography Artefacts using Low Fidelity Equipment
75
