
A Characterization of Student’s Viewpoint to Learning and its
Application to Learning Assistance Framework
Toshiro Minami
1
, Yoko Ohura
1
and Kensuke Baba
2
1
Kyushu Institute of Information Sciences, Dazaifu, Fukuoka, Japan
2
Fujitsu Laboratories, Kawasaki, Japan
Keywords:
Text Mining, Text Analysis, Term-usage, Educational Data Mining, Lecture Data.
Abstract:
Due to the advancement of popularization of university education, it becomes more and more necessary for
university staff to help students by enhancing their motivations to learn in addition to training study skills.
We approach to this problem from lecture data analytics. We have been investigating students’ answer to a
term-end retrospective questionnaire, and found students’ attitude in learning and their academic performance
correlate significantly. On the basis of this finding, in this paper, we propose a framework for assisting students
to improve their learning attitude. It consists of four participants; lecturer, assisting staff including librarian,
data analysts, and learning assistance system built on top of learning management system. We discuss how the
results of our previous studies can be utilized to assist students in this framework. Further, we introduce two
indexes for measuring the weights of a student viewpoint between lecture and themselves, and between good
points and bad points. These indexes show how a student’s viewpoint to the class is located in comparison
with other students’ viewpoints.
1 INTRODUCTION
Due to the popularization of university education, it is
often pointed out that not only the knowledge but also
the learning abilities of students has been decreasing.
In order to deal with such situation, universities have
been paying a great amount of efforts. Most univer-
sities in Japan, for example, set up the faculty devel-
opment (FD) programs and force the professors to at-
tend and try to raise the professors’ educational abil-
ity. They also introduce remedial courses for students
who need to learn preparatory materials, and enhance
the courses for the first year students to get used to the
style of teaching in universities. However, students’
academic skills do not seem to improve accordingly.
According to our observation of how students
learn in universities, the main problem of this issue is
not on professor/lecturer’s side such as teaching skill,
class management, or something, but on student’s side
such as diligence, motivation, eagerness, and other at-
titudes to learning. Thus, enhancement of students’
attitudes to learning is inevitable in order to achieve
high academic performance of students.
Considering the varieties of students, we take an
approach based on data analytics, which consists of
two steps: (1) to make a student’s learner model
mainly from lecture-related data, so that the model
includes attitudes to learning by proposing new con-
cepts and measuring indexes for them, and get tips for
the students how to learn and the tips for lecturers how
to teach, and (2) to advise each student according to
his or her learner model as well as advising lecturers
and students as a whole.
To proceed such an approach, we propose a
framework for assisting students with better academic
achievement. Enhancing student’s attitude to learning
is a very important function of this framework. We
also discuss in what way data analytics relate with
the framework for better assistance to students’ learn-
ing. Our approach has an advantage in terms of un-
derstandability of humans. We prefer to choose the
understandable method rather than applying the es-
tablished and more sophisticated methods that are less
understandable for us.
As a part of this approach, we have been ana-
lyzing the answer texts of a term-end questionnaire,
which asked the students to evaluate themselves and
the lectures/lecturer by retrospectively looking back
the class (Minami and Ohura, 2013a). Such data are
considered to be appropriate to analyze the students’
attitudes to the lectures. In the previous studies, we
have found that the students with high examination
Minami, T., Ohura, Y. and Baba, K.
A Characterization of Student’s Viewpoint to Learning and its Application to Learning Assistance Framework.
DOI: 10.5220/0006389706190630
In Proceedings of the 9th International Conference on Computer Supported Education (CSEDU 2017) - Volume 1, pages 619-630
ISBN: 978-989-758-239-4
Copyright © 2017 by SCITEPRESS – Science and Technology Publications, Lda. All rights reserved
619

scores use the words which indicate their wide point
of view. By contrast, the students with low grades use
the words closely related to the main topics of lecture.
Such studies of educational data analysis have
been conducted in the research field of Educational
Data Mining (EDM) (Romero and Ventura, 2007).
For example, Romero et al. (C. Romero and Her-
vas, 2008) gave a comparative study of data mining
algorithms for classifying students using data from e-
learning system. Its major interest is on predicting the
student’s outcome. Our focus is on the student’s psy-
chological tendency in learning, such as eagerness,
diligence, seriousness. Many studies in EDM use the
target data which are obtained from learning manage-
ment systems (LMSx). By contrast, we intend to ob-
tain our target data in everyday lectures.
Goda et al. (K. Goda and Mine, 2013) proposed a
method of text analysis, where texts are provided by
students as the reports in the everyday lectures, which
consists of three components: previous, current, and
next. Our data are different from them. They come
from homework, exercise, and term-end examination,
together with term-end examination, which are able
to obtain in any ordinary courses. Another difference
of our approach is that we do not set the estimation of
the student’s achievement as the main aim. Our major
aim is to know the student’s attitude to the lectures
and their seriousness to learning.
Ames et al. (Ames and Archer, 1988) studied in
the similar motivation to ours. They investigated the
students’ attitudes to the class and learning by ana-
lyzing the answers to questionnaire items. However,
their underlying data were obtained by asking the stu-
dents to choose the rate from 1 to 5 for each question
item. In our case, even though 2 of our question items
are asking to rate from 0 to 100, other questions are
asking to write the students’ own thought in a free-
text format.
Our data analysis style is also different from the
major studies in EDM. Most of them somehow intend
to analyze the big data, and the data obtained auto-
matically as log data. By contrast, we would rather
take the approach of dealing with small data, because
our target data themselves may be very small (Minami
and Ohura, 2012b)(Minami and Ohura, 2013a). Also,
the data we deal with are somewhat representing hu-
man students, and we, as the staff in an educationalor-
ganization like university, have to educate all of them.
Thus, we have to take attention to all the data as well,
even if they are located in the far-away areas from the
central area, because they represent one or more stu-
dents.
The rest of the paper is organized as follows.
In Section 2, we describe an outline of the main
concept of Learning Assistance Framework (LAF),
which provides the students with learning assisting
service. In Section 3, we show some of our results
in our previous studies, and discuss how they could
be reflected in LAF. In Section 4, we define two in-
dexes which measure the term-usage of the students,
and investigate how the students’ viewpoints are char-
acterized on the basis of the results in Section 3. Fi-
nally, in Section 5, we conclude the discussions and
findings in this paper and present our future direction.
2 LEARNING ASSISTANCE
FRAMEWORK
In this section, we describe the concept of learning
assistance framework (LAF). LAF should be con-
structed so that it helps the lecturers know better about
their students, as well as it helps the students get more
appropriate advice and enjoy better learning environ-
ment, and thus have better academic performance.
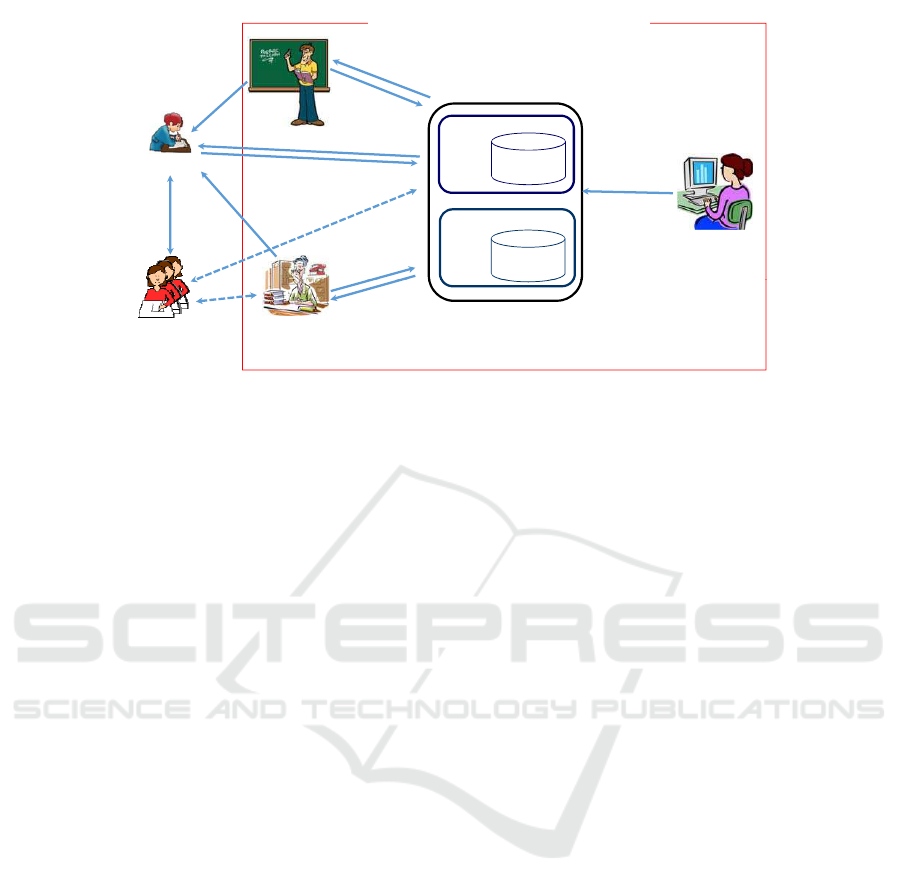
Figure 1 shows how an LAF works. The figure is
separated into two main areas, that is, the students in
the left area and LAF in the right area. LAF consists
of 4 major components, or participants: lecturer, sup-
porting staff (SS), learning assistant system (LAS),
and data analyst (DA). LAS can be developed as an
extension to a learning management system (LMS)
(e.g., (Moodle, a; Blackboard)) by adding an advi-
sory information system (AIS) as is illustrated in the
figure. LAS may be developed separately from LMS
if it is more convenient for the university.
The concept of LMS are already used popularly in
many educational organizations, such as universities.
Typical LMS has the functionalities such as manage-
ment of class members, allowing the lecturer to pro-
vide course materials to the students, students’ sub-
mission of homeworks, and assignment/examination
setting and scoring, and many more.
In the framework proposed in this paper, the AIS
part is added on top of the fundamental LMS core
functions, as is shown in Fig. 1. For example, Moodle
provides with the facility for adding plugins (Moo-
dle, b), with which the user can extend the materials
dealing with the system, such as special testing func-
tions and streaming videos. The AIS part has its own
database (AISDB), which keeps the data used for ad-
vising students in learning as well as the data provid-
ing the lecturers with the information about the stu-
dents, which does not be provided in ordinary LMSs.
The lecturer and a librarian are working as the
front-end advising staff. In the figure, the lecturer not
only gives lectures to the students, but also work as
the main adviser of students, for the lecture, for other
A2E 2017 - Special Session on Analytics in Educational Environments
620
Learning
AssistantSystem
AIS
AISDB
Lecturer
Lecture
Advice
Learnin
g
Material
LectureData
Student/LectureͲ
relatedInfo.
LearningAssistantFramework
LMS
LMSDB
AISDB
Student
Report
g
Communication
Consultation
Data
Consultation
Advice
DataAnalyst
DataMining
Other
Students
Supporting
Staff
(Librarian)
Student/LectureͲ
relatedInfo.
Figure 1: Outline of Learning Assistance Framework (LAF).
courses, and for learning in general. It is possible
to assign the roles of lecturer and adviser to different
staff. Then, the lecturer can be more concentrated to
provide good lectures and the adviser can give good
advice to students by spending more time in under-
standing and analyzing the status of the students.
The lecturer uses the functions of LAS by provid-
ing lecture data (by LMS) and getting information re-
lating to students (by AIS). The student-related infor-
mation helps the lecturer with advising each student
as well as all the students of the courses the lecturer is
responsible for. The lecture-related information will
be helpful in recognizing about his/her lectures.
Librarians play an important role as a major sup-
porting staff in this framework. Their role is to assist
the lecturers by providing students with consultation
service, and advice the students such as what learning
material is appropriate, how to study, how to do their
homework. In order to play such a role, librarians
will access to the LAS for getting information/data
about students and lectures. The librarians are sup-
posed to provide the LAS with consultation data as
well. They make record data for consultations, which
will be used as the case data in the latter consultations
as well as those to help the lecturers and students.
The data analyst (DA) located in the right-most
area of the figure also plays an important role as back-
end adviser for students. Different from LMS, AIS
deals with other types data such as about attitudes,
behaviour, and something, which are more subjective
than those of LMS. Thus, the data and algorithms for
AIS should be maintained regularly, and DA is re-
sponsible for it.
DA’s job includes maintaining AISDB, such as
collecting, updating, integrating data; data analysis
for extracting appropriate information about students’
characters, attitudes, interests, and others; and com-
munication with other participants; lecturers and SSs.
By setting DA as a different staff, the lecturer is able
to concentrate more on the front-end jobs such as the
lectures and advising students.
There are some lecturers who have sufficient
knowledge and skill in data analytics. In such cases, it
should be better for the lecturers to analyze their data
by themselves. Then, the DA helps them by provid-
ing with the analysis results of other classes so that
the lecturers can compare their classes with others,
and they can recognize the relative positions of their
classes.
A lecturer is also able to capture attitude of his/her
student not only in his/her class, but also in other
classes by using information provided by the DA.
Such information should be very useful in order to
deliver good lectures and to advise students for the
lecturer.
Security issue is very important in LAF because
the data dealt with the system and other human par-
ticipants are private data of students. One possible
way to cope with this problem is using renumbered
IDs instead of using the students’ IDs, and does not
use the students’ names and other privacy data by the
supporting staff and the DA, and only the lecturers are
allowed to know the students’ original IDs and names
because they have to evaluate the students and thus
they need such private information.
In the figure, the DA is represented as a person.
Some university has Institutional Research (IR) divi-
sion which is responsible for data analytics and the
staff records various types of data in the university
including the data relating to students such as aca-
demic performance, consultation records. The staff
in IR may be able to play the role of DA. In such a
A Characterization of Student’s Viewpoint to Learning and its Application to Learning Assistance Framework
621

case, DA staff may be allowed to deal with the orig-
inal data concerning students. There are a variety of
options for the university, from setting up a division
for the role of DA to setting up no DA who works as
expert for data analysis.
The students located in the left-most area are main
users, or customers, of LAF. The one at the left-top
area represents the student who takes a lecture of the
lecturer and study under the support from LAS. The
student will communicate with other students indi-
rectly by using LAS as well as directly by talking,
exchanging messages, and other means.
In the rest part of this paper, we will discuss the
issues such as what kinds of data for AIS are useful,
how to change the questionnaire we have been using
in order to create more suitable data, and other issues.
3 FINDINGS IN OUR ANALYSIS
AND THEIR APPLICATION TO
AIS
In this section, we present some findings in our pre-
vious studies for lecture data, and show what sort of
information relating to student’s attitude is obtained.
We also discuss how these findings could be used in
the framework of LAF. Firstly in Section 3.1, we de-
scribe the target lecture data we use for analysis. The
target data were obtained as answers to a term-end
questionnaire which asked the students to evaluate the
course and the students themselves by looking back
what they did in the course. Some questions asked to
answer by number and others asked to answer in free
text. In Section 3.2, we show the findings in investi-
gating the correlation between the numerical answers
and the students’ examination scores. In Section 3.3,
we deal with the free-text data, and investigate the
correspondence between the students and the terms
they used. In Section 3.4, we investigate the answer
texts from contrasting questions for evaluation, that
is, lectures vs. students themselves, and good points
vs. bad points.
3.1 Target Data
The data used in this paper came from a course in
2009 named “Exercise for Information Retrieval” in
a junior (2 year) college. The students were in year
2 and are going to graduate. The number of regis-
tered students was 35. The course was compulsory
for librarian certificate. Thus, the students of this
course were more motivated than other courses. The
major aim of the course for the students was to be-
come expert information searchers so that they had
enough knowledge about information retrieval, and
also had enough skills in finding appropriate search
engine sites and search keywords by understanding
the aim and the background of the retrieval. The
course consists of 15 lectures.
Also, homework was assigned at every lecture.
Its aim was to make the students review what they
had learned in the lecture and to study preliminary
knowledge for the next lecture. At the same time, the
students were requested to write a lecture note every
time, which also aimed to force the students review
what they had learned. The homework score shall re-
flect the frequency and quality of the submitted home-
work.
The term-end examination of the course consisted
of 3 questions. The aim of these questions was to
evaluate the skills on information retrieval, including
the skills for planning and summarizing. These skills
are supposed to have learned and trained in the course,
through their exercises in the classes and while they
do homework. We consider the score of term-end ex-
amination as a measure for student’s academic perfor-
mance.
We also asked the students to answer the ques-
tions as the overall evaluation of them for the course.
The questionnaire we deal with in this paper asked 12
questions. The questions stared with asking to eval-
uate the course: (Q1) what they have learned in the
course, and if they are useful, (Q2) what are the good
points of the lectures, (Q3) what are the bad points
that should be corrected, (Q4) score the course as a
whole, with the numbers from 0 to 100, where the
pass level is 60 as in the same way to the examination
score,
Then, the questions asked to evaluate the student
herself: (Q6) what are the good points of the stu-
dent herself regarding learning attitudes and efforts in
learning during the course period, (Q7) what are the
bad points that should be corrected of the student her-
self, (Q11) score the student herself by considering
her efforts and attitude in the course, with the num-
bers from 0 to 100 as in the same way in (Q4).
The amount of data used in this paper is very
small. Therefore, it is impossible to extract useful in-
formation which is applicable in other classes. Our
main aim of analysis of these small data is to find
new analysis methods as many as possible as the first
step to data analysis of lecture data we use in this pa-
per. Then, we would apply the methods found in the
first step to the data obtained from other classes. The
methods are evaluated according to their applicability
to other classes, usefulness of the extracted informa-
tion for lecturers in advising students.
A2E 2017 - Special Session on Analytics in Educational Environments
622

3.2 Analytics for Numerical Answers
In this subsection, we show our finding in the previ-
ous studies (Minami and Ohura, 2012a; Minami and
Ohura, 2012b; Minami and Ohura, 2013b; Minami
and Ohura, 2013a) of numerical data regarding the
answers to the questionnaire.
We started with investigating the correlation be-
tween the self-evaluation scores (which is obtained
from (Q11)) and the examination scores. The result
shows that the students who have high examination
scores evaluate themselves from a very low scores up
to a very high ones, which means that those students
who evaluate low would have the self-image that “I
am the person who can do better than what I have
been doing”. These students have a good desire of
self-improvement.
By contrast, the students who have poor perfor-
mance seem to believe in themselves without evi-
dence, and evaluate themselves something like, “I do
fairly well in my study”. Another possibility is that
they actually recognize very well about their poor ef-
forts and poor performance. Still, or maybe because
of it, they wanted to believe that they were not very
poor in their efforts, instead of admitting their poor
efforts. In this way, they could avoid facing what they
really were, and kept their prides. As a result of such a
phenomenon, the correlation coefficient between the
self-evaluation scores and the examination scores be-
comes a negative value of −0.1.
Considering the phenomenon we found in this
study, one possible service for AIS is asking the stu-
dents to evaluate themselves and the lectures from
time to time, and monitor their evaluation values. The
system puts a mark on a student who evaluates with
extremely high or low values, so that the lecturer can
recognize it easily. Lecturer can encourage the stu-
dent if his/her self-evaluation score is too low, and ad-
vise the student to correct their attitude to the course if
his/her self-evaluation score is too high in comparison
with his/her efforts.
3.3 Analytics of Word Usage
In this subsection, we show some of the results we
obtained in our previous analytics of word usage of
students in the answer text to the question (Q1) (Mi-
nami and Ohura, 2014; Minami and Ohura, 2015b;
Minami and Ohura, 2015a).
As we see the words that appear frequently in the
texts, we recognize that the words related to the lec-
tures appear in high frequencies. For example, the
word “Search” appears 88 times in the answers for
(Q1), which is the most frequently used one among
all words. Also, the words “Information” and “Li-
brary” appear in the list. The lecture-related words are
6 (20%) among 30 words, whereas 4 (29%) among 14
words with frequencies more than 10.
In a correspondence analysis between the students
and the terms they used, we divided the students into
5 groups. The member of the group with the highest
average examination score characteristically used the
technical terms and the terms from broader points of
view, in comparing Japan and the world such as “For-
eign”, “National”, and “Japan”. It is interesting to see
that the terms which are relating to the homework as-
signments do not appear in this group. Thus, we can
say that the students in this group attended the lectures
with the attitude of learning in a broad perspective.
Contrastingly, the students in the group with the
lowest average examination score used quite a lot of
frequently-used general terms, and did not use techni-
cal terms at all. It is interesting to see that many stu-
dents used a lot of terms they have learned during the
lectures, e.g., “Learn”, “Master”, “Study”, “Useful”,
and “Use”. Thus, the students in this group look very
diligent and eager to learn superficially, however they
are not. Presumably, they took too much attentions
to the terms themselves which are closely related to
the main topics of the course, and did not pay much
attention to their background, their relation to other
concepts, and their values in our social life.
One possible service for AIS is to monitor the
terms the students use in answers to occasional ques-
tionnaires, and advise the student when his/her view-
points to the topics in the course seem to be too dif-
ferent from other students.
For example, let us suppose students are asked to
answer the question about the terms relating to the
course. If the terms used by a student are extremely
different from the ones expected by the lecturer, AIS
puts a mark on the student, and the lecturer starts con-
sidering what are wrong with the student. By refer-
encing other information about the attitudes and be-
haviour of the student, the lecturer can advise the stu-
dent in an appropriate way.
3.4 Analytics of Terms in Answer-texts
to the Contrasting Questions
This subsection deals with analytics of terms in the
answer-textsfor the questions asking from contrasting
points of view. The question (Q2) asked the students
what are the good point of the lectures, LG in short,
and (Q3) asked the bad points of the lectures that need
to be improved, LB in short. Similarly, (Q6) asked
the good points of the student herself (SG), and (Q7)
asked the bad points that need to be improved (SB).
A Characterization of Student’s Viewpoint to Learning and its Application to Learning Assistance Framework
623
We would like to investigate what kinds of terms
are used in which kinds of evaluation questions, for
lecture, self/student, good point, bad point, and try
to find out the students’ viewpoints in these evalua-
tions. We proceed the analysis according to our pre-
vious study (T. Minami and Baba, 2017).
Let n be the number of students (n = 35 in our
case), and let S = {s
1
, s
2
, . . . , s
n
} be the set of stu-
dents. Each student s
i
(i = 1, 2, . . . , n) answers to
the questions (Q2), (Q3), (Q6), and (Q7). Let Q =
{LG, LB, SG, SB} be the set of questions, and let
Ans
i,q
be the answer text (string of characters) of
the students s
i
∈ S for the question q ∈ Q. Note that
Ans
i,q
=“” means that the student s
i
did not answer to
the question q.
By applying the morphological analyzer, i.e., KH
coder (Higuchi) and MeCab (Kudo), to the text
Ans
i,q
, we are able to create the set of “terms”,
{t
1
, t
2
, . . . , t
m
i, j
}, where each term t
i
is of the form
w ∶ p, where w is a word and p is its part of speech
(PoS). We will sometimes identify the term w∶ p with
the word w in this paper.
Let T
i,q
be the set of terms obtained from Ans
i,q
and #
i,q
t be the number of occurrences, or frequen-
cies, of the term t in the text Ans
i,q
. Note #
i,q
t repre-
sents the number of the occurrences of the term t in
the bag of words of Ans
i,q
, and thus, #
i,q
t = 0 if t ∉ T
i,q
.
We also define T
i
=
⋃
q∈Q
T
i,q
, #
i
t =
∑
q∈Q
#
i,q
t, T
q
=
⋃
s
i
∈S
T
i,q
, and #
q
t =
∑
s
i
∈S
#
i,q
t. Then, let T =
⋃
q∈Q
T
i
or =
⋃
s
i
∈S
T
q
.
Now we extend Q = {LG, LB, SG, SB} to Q =
{LG, LB, SG, SB, L, S, G, B, All} so that T
L
= T
LG
⋃
T
LB
and #
L
t = #
LG
t + #
LB
t. We also define T
S
, T
G
, and T
B
in the same way. Further, T
All
= T
L
⋃
T
S
and #
All
t =
#
L
t + #
S
t. We may omit the suffix ALL sometimes for
brevity.
In our case #T = 605,
∑
t∈T
#t = 1322, and thus, a
word appears about 2.2 times in average. The most
frequently appearing term is the verb “do” with 72
times, and 361 (about 60%) terms appear only once.
In order to investigate how terms are used in con-
trasting answer-texts, we introduce an index, which
quantifies how much is a term used comparativelybe-
tween two texts. Let t be a term (∈ T). The LS-index
of t is defined as follows:
ι
LS
(t) =
#
L
t −#
S
t
#
L
t +#
S
t
(1)
By definition, −1 ≤ ι
LS
(t) ≤ 1, and ι
LS
(t) = 1 iff t ap-
pears only in L, i.e., t appears either one of LG or LB
and it does not appear SG nor SB. Also, ι
LS
(t) = −1
iff t appears only in S, and ι
LS
(t) = 0 iff t appears in
the same number in L as in S, or #
L
t = #
S
t. Similarly,
we define:
ι
GB
(t) =
#
G
t −#
B
t
#
G
t +#
B
t
(2)
/
6
*
%
1
1
/*
/%
/1
1*
11
1%
6*
61
6%
/*b
/%b
/b*
/b*b
/b1
/b%b
1*b
/b%
6b*b
6b*
6b1
6b%b
6b%
6*b
1%b
6%b
/6,QGH[
*%,QGH[
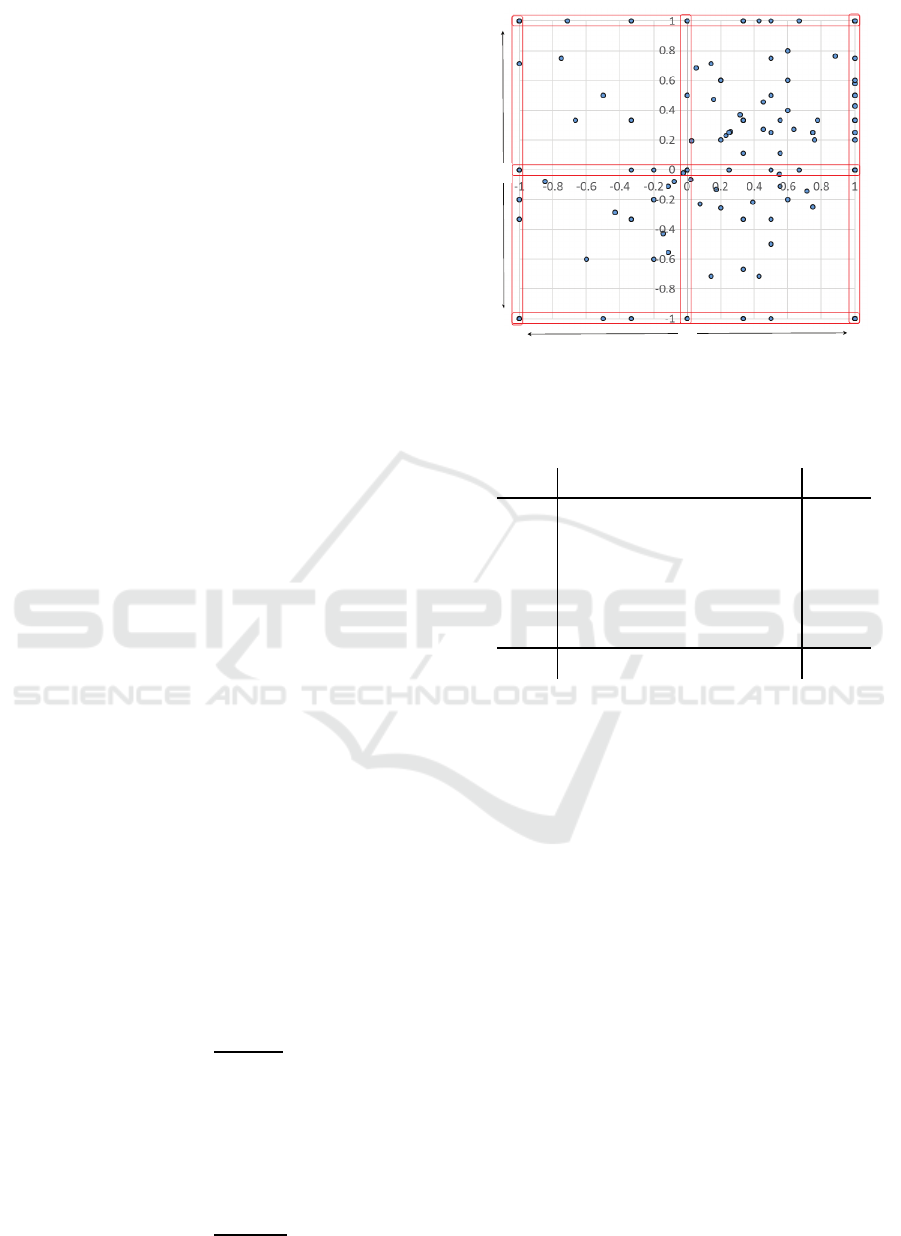
Figure 2: Distribution of Terms with LS (x-axis) and GB
(y-axis) Indexes.
Table 1: Frequencies for Combined Types of LS and GB.
S S’ N L’ L Sum
G 70 4 10 9 158 251
G’
1 6 2 36 13 58
N 10 2 16 3 18 49
B’
4 16 0 18 0 38
B
88 3 9 6 103 209
Sum 173 31 37 72 292 605
Figure 2 shows how terms are located 2-
dimensionally between LS and GB indexes. We di-
vide the terms into 25 groups by combining 5 groups
both for LS (x-axis) and for GB (y-axis), namely, S,
S’, N, L’, and L for LS, and G, G’, N, B’, and B
for GB. Precisely, we define the groups as follows:
S = {t ∈ T ∣ ι
LS
(t) = −1}, S
′
= {t ∈ T ∣ −1 < ι
LS
(t) < 0},
N = {t ∈ T ∣ ι
LS
(t) = 0}, L
′
= {t ∈ T ∣ 0 < ι
LS
(t) < 1},
and L = {t ∈ T ∣ ι
LS
(t) = 1}. We define G to B in
a similar way, and finally we define from SG to LB
by combining the two group types. For example,
S
′
G
′
= {t ∈ T ∣ −1 < ι
LS
(t) < 0, 0 < ι
GB
(t) < 1}.
Even though it is easy to see how terms are dis-
tributed, Figure 2 is misleading because one point
may represent a lot of terms with the same LS and
GB index values. For example, the point located at
the right-top corner, which represents the terms with
the value 1 for both LS and GB index, represents 158
terms; which is the maximum among 25 types.
Table 1 shows the actual numbers of terms for
each type. From the table, we can see most (nearly
70%) terms are located at the 4 corners (namely LG,
SG, SB, and LB types), and #LG> #LB> #SB> #SG in
their numbers of terms. Note that the number of terms
A2E 2017 - Special Session on Analytics in Educational Environments
624

of a type also indicates the amount of viewpoints, and
thus, how widely it is evaluated from.
These results show that students use more terms
regarding (probably, pay more attention to) lectures
than students themselves. Further, they use more
terms, or pay more attention, to good points than bad
points for lectures, and they pay more attention to bad
points than good points for themselves.
A possible interpretation of these results is that the
students are generally generous to others and they try
harder to find goodpoints than bad points as they eval-
uate the lectures and the lecturer,and at the same time,
they try hard to find something to be improved as they
evaluate themselves. It should be very interesting to
investigate further on this issue.
Regarding the possible application(s) in LAS, the
analysis method itself is important. By applying the
method, we obtain the characteristic feature of a term
between two contrasting concepts, or viewpoints.
4 ANALYTICS OF TERM-USAGE
OF STUDENTS REGARDING LS
AND GB
In this section, we analyze how the terms are used
by students on the basis of the studies described in
the previous subsections as the next step toward un-
derstanding students’ viewpoint. We start with defin-
ing the indexes for a student, which show what sort
of terms she used in regard with the lecture-student
(LS) and good-bad (GB) points of view. The indexes
are defined by using the LS and GB index values for
terms.
Two approaches are possible in order to capture
students’ attitudes to learning. One is a direct way;
by asking questions about their attitude, for example.
Our approach is an indirect way; by asking questions
about different types of questions and trying to find
their attitudes by analyzing answers of students. We
are able to capture how students recognize about their
own attitude to learning from the direct approach,
whereas we may be able to capture the students’ at-
titude what they do not recognize. It is preferable to
capture the students’ attitude by combining these two
approaches.
4.1 View-index for LS and GB
Firstly, we define the view-index of a student between
L and S (index for LS) is the average of the index
values of the terms she used in the answer texts (i.e.,
All). Formally, for s
i
∈ S (i = 1, 2, . . . , n) and for r ∈
{LS, GB}, we define v
r
(s
i
) as follows:
v
r
(s
i
) = mean
t
j
∈T
i
ι
r
(t
j
)#
i
t
j
=
∑
t
j
∈T
i
ι
r
(t
j
)#
i
t
j
∑
t
j
∈T
i
#
i
t
j
. (3)
By definition, v
r
(s
i
) = ±1 iff ι(t
j
) = ±1 for all t
j
∈ T
i
,
respectively. The former case means that the student
s
i
uses the terms that appear only in L if r = LS, and
only in G if r = GB, and the latter case means she uses
only those terms in S if r = LS and those in B if r = GB.
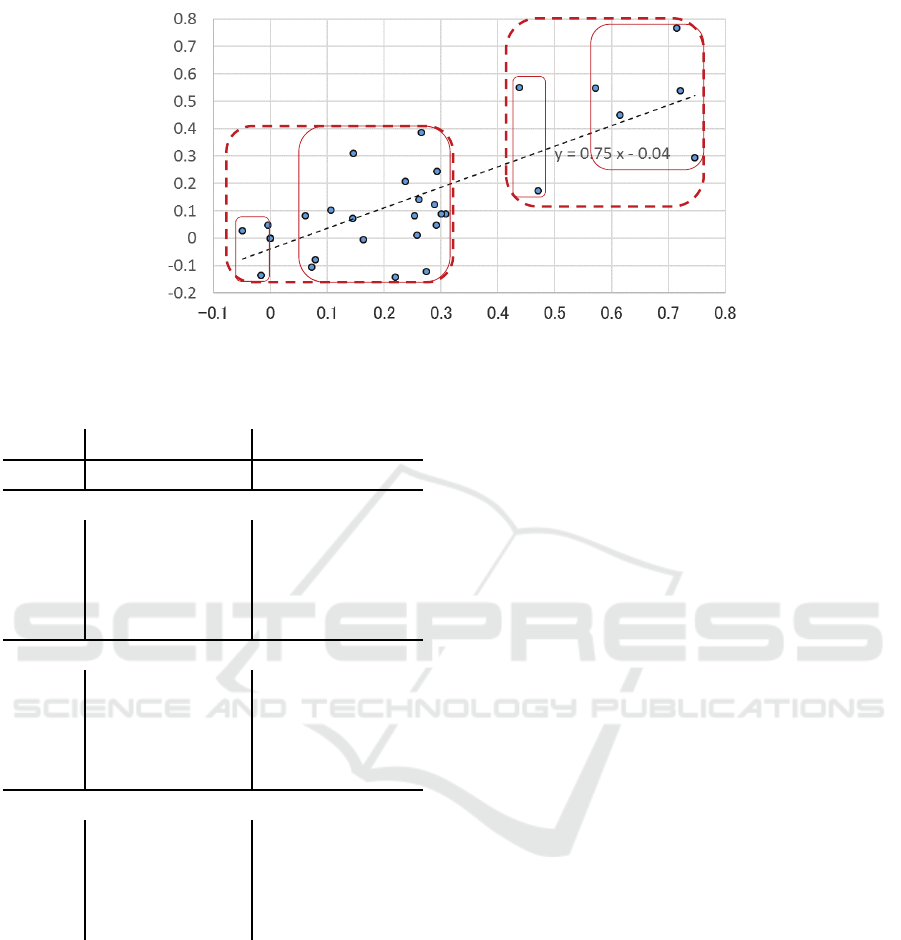
Figure 3 shows the correlation between the view-
indexes of students for LS and GB. As is easy to see,
they are correlated strongly with the correlation co-
efficient r = 0.78. Thus, we can say that the student
using the terms that are used mainly in evaluating lec-
tures tends to use the terms that are used more in good
evaluations than in bad evaluations. In other words,
the student using the terms that are relatively more
used for evaluating students themselves tends to use
the terms that are used rather in bad evaluations.
Even with such a high correlation between the
view-indexesfor LS and GB, some students have sim-
ilar view-indexes for LS and have quite different in
view-indexes for GB. For example, the view-indexes
for LS of St01 and St23 are similar; 0.71 for St01 and
0.75 for St23. For the view-indexes for GB, St01 has
0.77, which means that St01 seems to pay much at-
tention to good points. In comparison with St01, St23
has 0.29 in the view-index for GB, which is a little
bit greater than the average value of 0.137. Thus, we
may say that St23 evaluated from a more balanced
viewpoints than St01.
4.2 Investigation by Grouping
In order to clarify the differences between students,
we divide the students into groups, and compare them.
As we can see, the gap between a student and the next
one in their view-index for LS takes the maximum
value at the gap between St02 and St05. The view-
indexes of St02 and St05 are 0.44 and 0.31, respec-
tively. Thus, their difference, or gap, is 0.13. Now, we
have two groups LH and LL using the threshold value
0.4. The former group consists of the students who
have the LS view-indexes greater than 0.4, whereas
the latter consists of those who have less than 0.4.
As we recognize that each group seems to be con-
sisted with two subgroups divided by a relatively big
gap in each group. Therefore, we divide each group
into two subgroups at the gap having the biggest value
in the group. For group LH, the maximum gap is the
one between St20 and St18: the amount of the gap is
0.10. By using this gap, we divide the group LH into
two subgroups LHH and LHL. Similarly, we divide
A Characterization of Student’s Viewpoint to Learning and its Application to Learning Assistance Framework
625
ϮϬϭϳͬϯͬϭϯ
ϭ
^ƚϬϮ
^ƚϬϱ
^ƚϭϴ
^ƚϮϬ
^ƚϭϮ
^ƚϮϭ
^ƚϬϯ
^ƚϭϬ
>,
>>
>,,
>>,
>,>
>>>
^ƚϬϭ
^ƚϮϯ
Figure 3: Correlation between view-indexes for LS (x-axis) and GB (y-axis).
Table 2: Statistical properties of the groups of students.
Prop.
LLL LLH LL LHL LHH LH
Size 3 19 22 2 5 7
LS view-index (×100)
Max
−0.4 31 31 47 75 75
Min −0.5 6 −0.5 44 57 44
Average
−2 21 18 46 67 61
Range
5 25 36 3 18 31
GB view-index (×100)
Max
5 39 39 55 77 77
Min
−13 -14 -13 17 29 17
Average −2 8 7 36 52 48
Range
18 53 40 38 47 59
Examination Score
Max
80 99 99 82 64 82
Min
75 29 29 66 27 27
Average 77.0 70.0 70.9 73.7 48.1 55.4
Range
5 70 70 16 37 55
the group LL into LLH and LLL by using the gap be-
tween St03 and St10. Note that we ignore the students
having the value 0 in both indexes for LS and GB be-
cause they did not answer at all to all the questions in
consideration.
Table 2 shows statistical information about the
groups. Regarding the range of the LS view-index,
the groups LL and LH have similar values. For sub-
groups, the ranges of the subgroups with upper value
are much larger than those with lower value in each
group of LL and LH.
Regarding GB view-index, LH group has much
higher values than LL group in terms of the maxi-
mum, minimum, and average values. Range for LH
is also bigger than that of LL group. Regarding sub-
groups, the upper subgroups LLH and LHH have big-
ger ranges than the lower subgroups LLL and LHL,
respectively. The ranges of upper subgroups are sim-
ilar.
Regarding examination scores, LL group has a lit-
tle bit higher values than LH group. As for subgroups,
the upper group has lower average examination score
and larger range in each groups LL and LH.
Considering some subgroups include just a small
amount of students, the results obtained in this analy-
sis may not be applicable to other data. However, the
analysis method itself should be applicable to other
data as well. From our experience in our previous
studies, characteristic feature(s) often become(s) clear
by dividing the members into groups, and compare
these groups.
Table 3 shows the 10 terms mostly used by the
student who have the maximum and the minimum
view-index values for GB in each subgroup. Note
that the terms with least frequency in each student
are part of the terms among those with the same fre-
quency. The terms in the table are in the form “En-
glish(Japanese):PoS”, where “Japanese” is the origi-
nal word in Japanese and “English” is its correspond-
ing English word or expression. The “PoS” part
shows the part of speech of the word. Note that
the English part is of the form “To+Verb” such as
“ToSearch” in “ToSearch():n” shows that the word is
“Sahen-noun”. Sahen-noun is a special type of noun
which turns into its verb form by adding “suru (mean-
ing do)” at the end of it. For example, by adding
“suru” to “ToSearch(, read Kensaku):n” we have the
verb from “Kensaku-suru (search-do)”, which means
“to search”.
Let us take St07, as an example, who belongs to
the LLL group, where the members used the mostly
A2E 2017 - Special Session on Analytics in Educational Environments
626
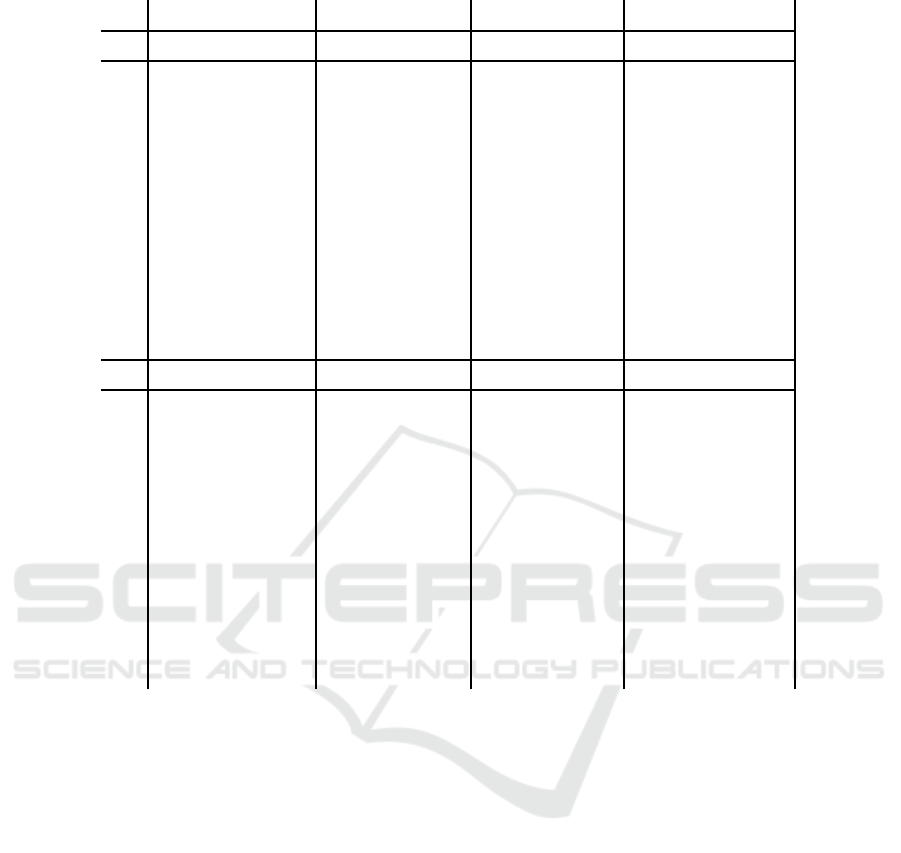
Table 3: Top 10 mostly used terms of the students with the maximum and minimum GB view-index values in each subgroup.
LLL LLH LHL LHH
Max St10 # St24 # St02 # St01 #
1 Time(Ł):adv 3 Do():v 8 ToSearch():n 4 Investigate():v 2
2 Assignment():n 3 Can():v 5 Lecture():n 3 Can():v 2
3 Setup():v 2 Library(Ł):n 5 Become():v 2 Know(m):v 2
4 Do():v 2 ToSearch():n 4 Information():n 2 Do():v 1
5 Do():v 1 Homework(h):n 4 Do():v 1 Some():n 1
6 ToExercise(K):n 1 ToIntroduce():n 4 Investigate():v 1 Proverb():n 1
7 Words(P):n 1 Not():o 3 Usually(i):adv 1 SoMuch():adv 1
8 Homework(h):n 1 NotMuch():adv 2 PC(PC):o 1 Amazing():adj 1
9 Study():n 1 Think(v):v 2 NotMuch():adv 1 Many():adv 1
10 0():v 1 ToDevise(Hv):n 2 0():adv 1 Benefit():n 1
Min St07 # St12 # St18 # St23 #
1 Do():v 12 Not():o 4 Do():v 4 Become():v 1
2 Homework(h):n 7 Homework(h):n 3 Can():v 4 Opportunity(@):n 1
3 Think(v):v 6 Do():v 2 Become():v 3 No():adj 1
4 Lecturer():n 5 Become():v 2 ToSearch():n 3 Now():adv 1
5 Not():o 4 See():v 2 Homework(h):n 3 Homework(h):n 1
6 Exist():v 4 Think(v):v 2 ToIntroduce():n 3 See():v 1
7 Can():v 3 Time(Ł):adv 2 Not():o 3 Know(m):v 1
8 Me(ł):n 3 Many():adj 2 Lecture():n 2 Library(Ł):n 1
9 Contents(e):n 3 Can(o):v 2 Think(v):v 2 ToSolve():n 1
10 Good():adj 3 Not():o 2 Good():adj 2 ToPrepare():n 1
self-oriented, or self-referencing, terms. Her view-
index value for GB is the minimum in the group,
which means that the terms she used have tendencies
to be used in the texts for bad evaluation.
However, she does not disappointed with herself.
On the contrary, she seems to believe in herself. Her
answer text to (Q7), or SB, is as follows: “It was
too late to find out the intention of the lecturer about
the homework assignments. Further, it is the worst
thing that I complained about it and what the lecturer
thought about. However, once I have recognized my
failure, I will not fail again. Truly it is my own re-
sponsibility what I can see and learn from what are
presented. Here after, I will infer the intention of oth-
ers and try to act accordingly. ” In the answer text,
she admitted what she did was wrong, and at the same
time, she decided to correct her way of action. Thus,
the use of terms for negative evaluation does not di-
rectly mean the student who uses is negative.
As the second example, let us choose St01, who
represents lecture-oriented and good-evaluation stu-
dents. The terms appearing in the list are generally
positive ones. Actually, she answered to the question
(Q2), or LG, only among the four questions. This is
the reason why she have such high values for view-
indexes for LS and GB.
As the third example, let us choose St10, who rep-
resents the most SG-oriented students, who are differ-
ent from the majority of students. Her answer to (Q6),
or SG, just praised herself that she did her homework
by taking a long time. The terms appearing in her
most frequently used terms list show she is highly in-
terested in the time and homework assignment.
As the fourth example, let us choose St23, who
represents lecture-oriented and bad-evaluation stu-
dents. She only answered to the lecture-related ques-
tions, i.e., (Q2) and (Q3). This is the reason why she
is lecture-oriented. Regarding the answer to (Q2), or
LG, her answer, and thus her viewpoint, is an ordinary
one. However, her answer to (Q3), or LB, is different
from other students. She mentioned a small quiz at
the beginning of every lecture, and complained about
it. There are no students who mentioned it, thus the
terms she used have strongly negative value in GB in-
A Characterization of Student’s Viewpoint to Learning and its Application to Learning Assistance Framework
627
^ƚϬϮ
^ƚϬϱ
^ƚϭϴ
^ƚϮϬ
^ƚϭϮ
^ƚϮϭ
^ƚϬϯ
^ƚϭϬ
>,
>>
>,,
>>,
>,>
>>>
^ƚϯϰ
^ƚϬϰ
^ƚϮϰ
^ƚϮϱ
^ƚϯϱ
^ƚϬϭ
^ƚϮϯ
^ƚϯϭ
^ƚϯϯ
^ƚϯϬ
^ƚϭϭ
^ƚϭϳ
^ƚϭϵ
^ƚϭϰ
^ƚϬϯ
^ƚϭϱ
^ƚϬϲ
^ƚϭϯ
^ƚϯϮ
^ƚϮϮ
^ƚϮϵ
^ƚϮϴ
^ƚϮϳ
^ƚϮϲ
^ƚϬϴ
^ƚϬϳ
^ƚϬϵ
Figure 4: Correlation between View-index for LS (x-axis) and Examination Score (y-axis) of Students.
dex, and here view-index value for GB becomes bad-
oriented accordingly.
4.3 Correlation Analysis between
View-index for LS and Examination
Score
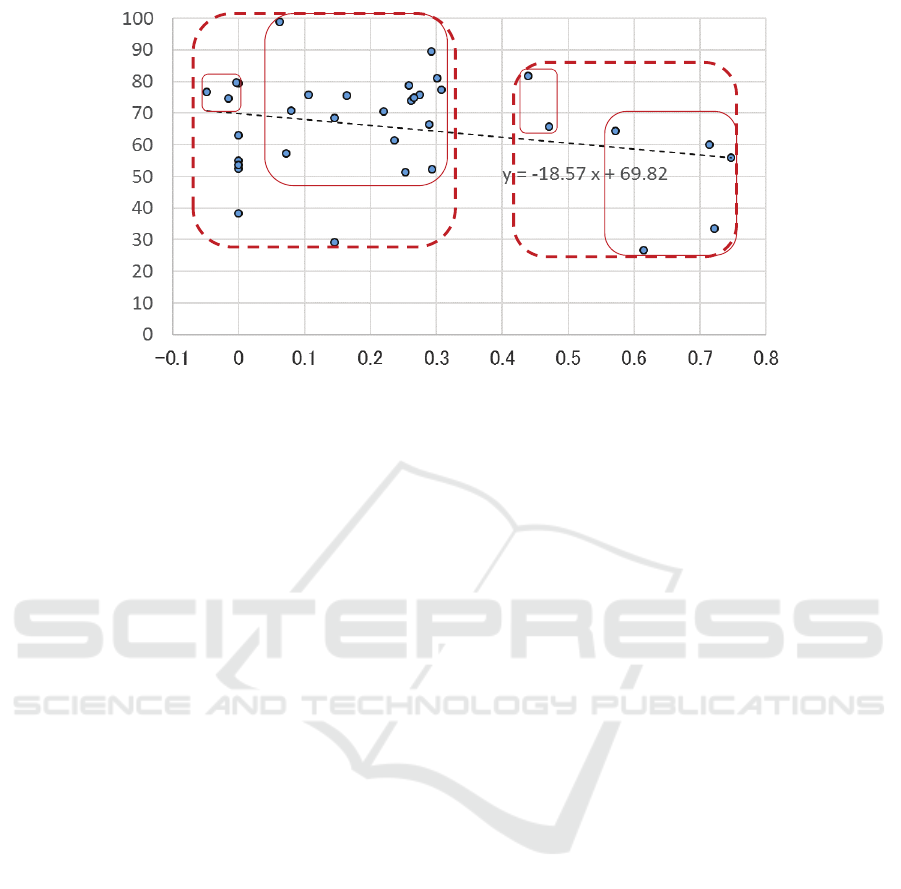
Figure 4 shows the correlation between the view-
index for LS and examination score. As we can see,
they have a weak negative correlation with correla-
tion coefficient r = −0.26. Thus, examination score
decreases as view-index for LS increases. In other
words, examination score increases as students care
more about themselves than lectures.
This result probably means that the students who
are more interested in their current status tend to retro-
spectively assess themselves, and thus, they do more
effort to correct their everyday attitudes. Such charac-
ters might be resulted in better academic performance
and increase of examination score.
Another notable finding in the figure is that the
range of examination scores are wide for those stu-
dents who have similar values in their view-index for
LS. For example, the maximum examination score in
LL group is 99 of St03 and the minimum examination
score is 29 of St32, and thus, the range is 70.
This result inspires that there are many factors that
relate to the examination score and student’s view is
one of them. The possible factors may include the
student’s potential ability in learning, amount of time
used for homework, the amount of concentration dur-
ing lectures, diligence in studying.
4.4 Data Analytics for AIS
In this paper, we have dealt with the questionnaire,
and investigated its answer texts. The questionnaire
was done when a series of lectures was almost fin-
ished, and it asked the attending students to retrospec-
tively evaluate by looking back the lectures and the
students themselves.
In this section, we discuss how to improve the
questionnaire in order to make it more useful for LAF.
The eventual goal of our LAF is not only to provide
useful information to the lecturer and the supporting
staff so that they are able to advise students appropri-
ately, but also to help the students with understanding
their exact status, and the students themselves solve
their problems, and improve their academic perfor-
mance. However, we set the main role of LAF to an
information providing for advising students in learn-
ing at the moment.
The process from the questionnaire to the advice
to students consists of the following steps:
Step 1: Questionnaire → Answer-text
Step 2: Answer-text→ Viewpoint/Attitude to learning
Step 3: Viewpoint/Attitude → Advice for improve-
ment
In Step 1, the teacher of the class asks the stu-
dents to answer the questions. It is more convenient
to answer in a Web site than delivering question and
answer sheets. Regarding the frequencies of the ques-
tionnaire, we have asked once in a course at the end
of the lectures. In order to make LAS work more ef-
fectively, the questionnaire should be done more and
earlier. Our idea is to have questionnaire once in 3 to
4 lectures. Then, the teacher is able to obtain informa-
tion about students from the early lectures to the end,
so that he/she can give timely advices to the students.
A2E 2017 - Special Session on Analytics in Educational Environments
628

Step 2 is the analysis and analytics step. On the
basis of our previous studies and the study in Sec-
tion 4 are possible candidates for this step. We would
proceed our studies in this direction so that the results
are applied to the framework of LAF, and will be used
in this step.
In Step 3, the professors advice the students on the
basis of their viewpoint and attitude to learning, ob-
tained in Step 2. The advices will be provided to the
students as a whole, as well as to each student individ-
ually. Also, the understanding of students’ viewpoints
and attitudes will help the professors for improving
their teaching style.
5 CONCLUDING REMARKS
It becomes more and more important for universities
to motivate students in learning in order to increase
their academic performance. An aim of this paper
is to propose a learning assistance framework (LAF),
which consists of three types of human assistant: lec-
turer, supporting staff, data analyst, together with a
learning assistant system (LAS). Students are able to
study under the supports from LAF.
Another aim of this paper is to investigate how the
results of data analytics could be effectively used in
LAF. We showed some of our findings in our previous
studies and discussed howthey could be applied in the
services provided by LAF.
Further, as a part of developing methods for data
analytics, we pursued a case study of data analytics
for answer texts from contrasting questions. By using
the index defined for measuring the balance of usage
between two contrasting texts, we have characterized
the students in their term usage.
The contributions of the study in this paper in-
clude not only the findings from specific data, but also
to show usefulness of the methods of analysis.
For further studies, we have to investigate the fol-
lowing topics: (1) To develop a method to devise new
ideas further, and to perform refinement of dedication
to the study of student’s viewpoints, efforts, and atti-
tudes to learning. (2) By collecting data from a va-
riety of courses, to analyze them, and to verify if the
results of the study in this paper and those in our pre-
vious studies are also holds, or not. (3) To generalize
and formalize the analysis methods, and to integrate
them into an automated data analysis system, so that
at least a part of data analysis are performed automat-
ically and the data analyst are able to spend their time
in other topics.
ACKNOWLEDGMENT
This work was supported in part by JSPS KAKENHI
Grant Number JP15K00310.
REFERENCES
Ames, C. and Archer, J. (1988). Achievement goals in the
classroom: Students’ learning strategies and motiva-
tion processes. In Journal of Educational Psychology,
Vol.80, No.3, pp.260–267.
Blackboard. Anz blackboard. http://anz.blackboard.com/
[2017.2.10].
C. Romero, S. Ventura, P. E. and Hervas, C. (June 2008).
Data mining algorithms to classify students. In 1st In-
ternational Conference on Educational Data Mining
(EDM 2008), pp. 8–17.
Higuchi, K. Kh coder. http://khc.sourceforge.net/en/
[2017.3.13].
K. Goda, S. H. and Mine, T. (2013). Automated evaluation
of student comments on their learning behavior. In
12th International Conference on Advances in Web-
Based Learning (ICWL 2013), pp. 131–140.
Kudo, T. Mecab: Yet another part-of-speech
and morphological analyzer (in japanese).
http://taku910.github.io/mecab/ [2017.3.13].
Minami, T. and Ohura, Y. (2012a). An attempt on effort-
achievement analysis of lecture data for effective
teaching. In Database Theory and Application (DTA
2012), in T.-h. Kim et al. (Eds.): EL/DTA/UNESST
2012, CCIS 352, Springer-Verlag, pp. 50–57.
Minami, T. and Ohura, Y. (2012b). Towards development of
lecture data analysis method and its application to im-
provement of teaching. In 2nd International Confer-
ence on Applied and Theoretical Information Systems
Research (2ndATISR 2012), 14pp.
Minami, T. and Ohura, Y. (2013a). Investigation of stu-
dents’ attitudes to lectures with tex-analysis of ques-
tionnaires. In 4th International Conference on E-
Service and Knowledge Management (ESKM 2013),
7pp.
Minami, T. and Ohura, Y. (2013b). Lecture data analy-
sis towards to know how the students’ attitudes affect
to their evaluations. In 8th International Conference
on Information Technology and Applications (ICITA
2013), pp. 164–169.
Minami, T. and Ohura, Y. (2014). A correlation
analysis of student’s attitude and outcome of lec-
tures –investigation of keywords in class-evaluation
questionnaire–. In Advanced Science and Technology
Letters (ASTL), Vol.73 (FGCN 2014), pp. 11–16.
Minami, T. and Ohura, Y. (2015a). How student’s atti-
tude influences on learning achievement? –an analysis
of attitude-representing words appearing in looking-
back evaluation texts–. In International Journal of
Database Theory and Application (IJDTA), Science
& Engineering Research Support Society (SERSC),
Vol.8, No.2, 2015, pp. 129–144.
A Characterization of Student’s Viewpoint to Learning and its Application to Learning Assistance Framework
629

Minami, T. and Ohura, Y. (2015b). Towards improv-
ing students’ attitudes to lectures and getting higher
grades –with analyzing the usage of keywords in
class-evaluation questionnaire–. In The Seventh In-
ternational Conference on Information, Process, and
Knowledge Management (eKNOW 2015), pp. 78-83.
Moodle. Moodle - open-source learning platform. In
https://moodle.org/ [2017.3.13].
Moodle. Moodledocs. In
https://docs.moodle.org/dev/Main
Page [2017.3.13].
Romero, C. and Ventura, S. (2007). Educational data min-
ing: A survey from 1995 to 2005. In Expert Systems
with Applications, Vol. 33, Issue 1, pp. 135–146.
T. Minami, Y. O. and Baba, K. (2017). Estimating student’s
viewpoint to learning from lecture/self-evaluation
texts. In Proc. The Ninth International Conference on
Advanced Cognitive Technologies and Applications
(COGNITIVE 2017), Feb. 2017, pp. 38–43. IARIA.
A2E 2017 - Special Session on Analytics in Educational Environments
630
