
Future Land Use Change Dynamics in Natural Protected Areas
Madrid Region Case Study
Marta Gallardo
1
and Javier Martínez-Vega
2
1
Department of Geography, University of Murcia, Santo Cristo 1, 30001 Murcia, Spain
2
Institute of Economics, Geography and Demography, Spanish National Research Council,
Albasanz 26-28, 28037 Madrid, Spain
Keywords: Land Use Changes, Land Use Scenarios, Natural Protected Areas, Region of Madrid, Spain.
Abstract: Natural protected areas are declared to safeguard their environment, goods and services. However,
sometimes they are affected by land use changes related to human activity, which affects their ecosystem
functions and their sustainability. Problems such as fragmentation or low habitat connectivity are some of
its consequences. Developing future land use scenarios is essential if a preventive approach to the
management of protected areas is to be adopted. In this paper, three different land use change scenarios in
natural protected areas in Madrid region are modelled: a “business as usual” scenario, an economic crisis
scenario and a green scenario. All protected areas are studied, from National and Nature Parks to Special
Areas of Conservation and Special Protection Areas; changes in a buffer area of 5 km around PAs are also
studied. The CLUE model (based on logistic regression) is used. Biophysical, socio-economic and
accessibility factors and incentives and restrictions are considered. In recent decades, the region of Madrid
has experienced intense urban and infrastructure development (48,332 ha). Protected areas have been
affected by this urbanization process (almost 5,000 ha) and its surroundings (30,000 ha). These findings
should alert land use planners and the managers of protected areas to the potential threats.
1 INTRODUCTION
Natural protected areas occupy nowadays 15.4% of
the land area and of continental and inland waters,
3.4% of the global ocean area, 8.4% of marine areas
covered by national jurisdictions and 10.9% of
coastal waters (Juffe-Bignoli et al. 2014). In Spain,
from 1990 to 2013 the number of protected natural
areas multiplied by 7 and their surface area tripled
(EUROPARC-España 2014). Over 27% of the
surface occupied by terrestrial ecosystems are
protected by national, European or worldwide
networks. Within the EU, Spain is the largest
contributor to the Natura 2000 network.
In spite of their importance, Protected Areas
(PAs) are increasingly under threat from factors such
as climate change (Ruiz-Mallén et al. 2015), land
use / land cover (LULC) changes (Martínez-
Fernández et al. 2015), deforestation (FRA 2010),
forest fires (Chuvieco et al. 2013), habitat
fragmentation (Dantas de Paula et al. 2015),
propagation of invasive species (Lei et al. 2014),
urban pressure (McDonald 2013) and public use
(López Lambas and Ricci 2014).
Land-use change is a matter of concern for the
scientific community. Spatio-temporal analysis can
be used for a number of purposes (Lambin et al.
2001): (1) to observe LULC changes in the past and
explore the factors explaining them, (2) to simulate
possible environmental and socio-economic impacts,
and (3) to assess the influence of political
alternatives in order to improve planning.
However, little is known about LUCC trends at
different protection levels. Recent studies have
focused on analysing changes in protected areas of
differing importance and in the unprotected areas
around them (Romero-Calcerrada et al. 2004; Ruiz-
Benito et al. 2010; Hewitt et al. 2016). It is
important to simulate future land-use scenarios so
that a dual approach can be adopted in preventive
planning for protected areas and their surroundings
(Martinuzzi et al. 2015). The simulated scenarios
and initial knowledge of their consequences for
landscape structure could be a good starting-point
370
Gallardo, M. and Martinez-Vega, J.
Future Land Use Change Dynamics in Natural Protected Areas - Madrid Region Case Study.
DOI: 10.5220/0006387903700377
In Proceedings of the 3rd International Conference on Geographical Information Systems Theory, Applications and Management (GISTAM 2017), pages 370-377
ISBN: 978-989-758-252-3
Copyright © 2017 by SCITEPRESS – Science and Technology Publications, Lda. All rights reserved
for discussion and for reaching agreements between
local communities and managers of protected areas.
The objective of this paper is to simulate LULC
in 2025 in PAs and their surrounding areas in the
region of Madrid using the free software CLUE,
based on logistic regression. LUCC that took place
between 1990 and 2006 and the changes expected by
2025 are analysed in order to determine trends and
threats arising inside and around PAs.
2 STUDY AREA
The Madrid region covers an area of 8,027 km
2
and
in 2016 had a population of 6,436,996 inhabitants
(http://www.madrid.org/iestadis, last accessed
February 18, 2017). It is the most densely populated
region in Spain with about 800 inhabitants /km
2
.
In the region of Madrid, PAs occupy 329,164 ha,
equivalent to 41% of the region’s total surface area
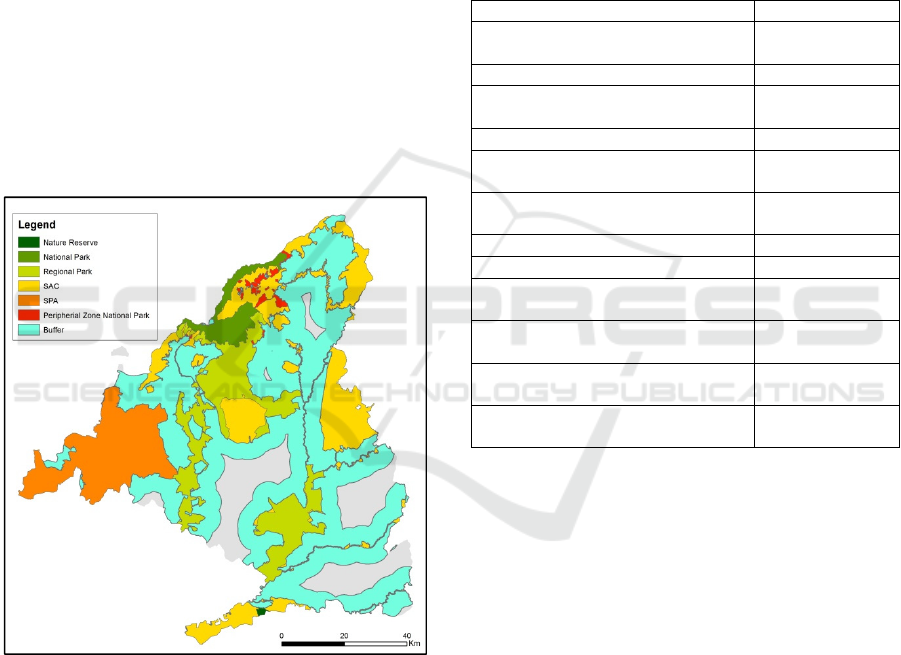
(Figure 1).
Figure 1: Study area. Different types of protected areas
and buffer. Madrid region, Spain.
Table 1 shows these PAs, listing them in order of
protection – from greatest to least. 15% of the
Madrid Region is protected in SACs (Special Areas
of Conservation), 12% in Regional Parks (RP), 10%
in an SPA (Special Protection Area), about 3%
belongs to a National Park (NP) and the remaining
1% is occupied by the Peripheral Protection Zone
(PPZ) around this National Park and by a Nature
Reserve (NR). All the PAs studied contain terrestrial
ecosystems typical of the Mediterranean
biogeographic region.
A 5-km buffer zone around all the PAs in the
region was took into account. It occupies 372,865
km
2
, this is 46% of the region’s area. Its aim is to
mitigate threats to the PAs and as such it plays a
strategic role in the conservation of biodiversity.
About 13% of the region’s land surface falls outside
the scope of the study. Most of it is occupied by the
city of Madrid and by other towns within the
metropolitan area.
Table 1: Natural protected areas considered in the study.
Protected area Designation year
El Regajal-Mar de Ontígola Nature
Reserve
1994
Sierra de Guadarrama National Park 2013
Cuenca Alta del Manzanares
Regional Park
1985
Sureste Regional Park 1994
Curso medio del río Guadarrama
Regional Park
1999
Cuenca del río Lozoya y Sierra
Norte SAC
1998 / 2014*
Cuenca del río Manzanares SAC 1998 / 2014*
Cuenca del río Guadalix SAC 1998 / 2014*
Cuencas de los ríos Jarama y
Henares SAC
1998 / 2014*
Vegas, Cuestas y Páramos del
Sureste de Madrid SAC
1998 / 2014*
Encinares de los ríos Alberche y
Cofio SPA
1990
Peripheral Protection Zone
Guadarrama National Park
2013
* For the SACs, two dates are given in the “Designation
year” field. The first refers to the year when the regional
government proposed to the EU that the area be declared
an SAC. This marked the beginning of their commitment
to preventive protection in order to conserve the
biodiversity of the area’s habitats. The second date is the
actual date of the declaration, after which the
corresponding management plans were approved.
3 DATA AND METHODOLOGY
Regarding to the information related to PAs, two
sets of geographical data were selected: the updated
perimeters and their corresponding attributes for the
Nationally Designated Protected areas (NDP) in the
Madrid region and the Natura 2000 Network areas
(Nn2000), both downloaded from the Spanish
Ministry of Agriculture, Fisheries, Food and
Environment (MAPAMA) web page (last accessed
February 1, 2017). In order to find the dates for final
approval of the SACs, the cartography was linked
Future Land Use Change Dynamics in Natural Protected Areas - Madrid Region Case Study
371

with the Common Database on Designated Areas
(CDDA) of the European Environment Agency
(http://www.eea.europa.eu/data-and-
maps/data/natura-6#tab-european-data, last accessed
February 1, 2017).
Regarding to the information needed to develop
the LULC scenarios, maps from CLC project for the
years 1990, 2000 and 2006 were downloaded
(http://centrodedescargas.cnig.es/CentroDescargas/b
uscadorCatalogo.do?codFamilia=02113, last
accessed February 1, 2017). We did not consider the
most recent map (CLC 2012) because it is still under
review.
A collection of auxiliary geographic data was
taken into account in order to map the driving
factors and the restrictive and incentive factors
during design of future LULC scenarios. A Digital
Elevation Model (raster 30 m GMES RDA, EU-
DEM) was used to generate altitude and slope maps.
Roads, rivers and railway stations (Numerical
Cartographic Base 1:100,000, obtained from the
Spanish National Geographical Institute) were
considered to calculate cost of transport and
distances to the city of Madrid, to other cities, to the
airport and to the roads themselves. Other
information used was the lithological map of
Madrid, the map of public-utility forest areas
(Regional Government of Madrid), PA zoning in the
region (Autonomous Body for National Parks) and
specific legislation on land and territorial planning
(General Urban Land Plan for Madrid for 1997, Law
9/2001 of 17 July on land in the Region of Madrid,
Law 9/1995 of 28 March on measures for territorial
policy, land and planning, and Law 3/1991 of 7
March on roads in the Region of Madrid).
CLC vector maps were converted to 50*50m
pixel size raster format. To simulate future LULC in
2025, a simplification of CLC legend was made,
from CLC level 3 to seven categories was made: (1)
urban fabric, (2) industrial and commercial, (3)
arable land and permanent crops, (4) heterogeneous
agricultural areas, (5) forests, (6) shrubs and
herbaceous vegetation, and (7) others (open spaces
with little vegetation, wetlands and water bodies).
Using CLUE three different scenarios were
developed: (a) “business as usual” scenario, (b)
economic crisis scenario and (c) green scenario. The
first one, shows what would happen if the past trend
observed during 1990-2000-2006 was to continue
until 2025. The crisis scenario shows what would
happen if the economic crisis in Spain and the region
of Madrid was to continue until 2025. The green
scenario shows what would happen if there were
more active reforestation policies and if greater
importance was placed on the natural environment.
It does, however, take into account that Madrid is an
urban region and that built-up areas will continue to
grow. This means on the one hand, that greater
protection is offered to natural uses than in the past
and, on the other, that greater growth is assigned to
built-up land (for more information see Gallardo
2014; Gallardo et al. 2016).
LULC and driving factors were related by means
of logistic regressions (LR). Previously, correlations
between the selected variables were observed by a
Pearson’s correlation analysis. The future demand
for each land use was assigned specifying the
number of hectares for each land use in 2025, based
on what had happened in previous years. For the
trend scenario, each LULC type evolves according
to the observed past trend. For the economic crisis
scenario, experts’ opinion was included as input
data. A questionnaire was distributed among 117
experts that were asked about how much the
different LULC types could grow or decrease under
an economic crisis scenario and where these LULC
changes could preferentially be located. Finally, the
green scenario was calculated as a halfway scenario
between the trend and the economic crisis scenarios
for agricultural and artificial LULC types while for
forest and shrub and pastures, an increase of about
13 and 0.2 %, respectively, comparing to 2006 is
defined.
Calibration processes were taken into account in
order to improve the scenario results. This was done
in different ways: changing the future
demand/extension of each LULC, changing the
conversion matrix, selecting the driving factors, etc.
Taking the sequence of maps 1990-2000 as a base, a
simulation of a land-use model in 2006 was carried
out and compared it with the real map for 2006. The
amount of land-use change, the driving factors used
and/or the size or weight of the neighbourhood were
changed in order to obtain a better result. For
validation, comparisons in terms of quantity and
location were analysed. Kappa statistics, K Location
(location) and K Histogram (quantity) (Pontius
2000; Van Vliet 2009) was used. Results were
compared with a null model and a random model.
Values and maps of hits, misses and false alarms
were obtained (Eastman 2012; Sangermano et al.
2012). (See Gallardo, 2014)
PAs were analysed regarding to their level of
priority. Areas that overlapped are classified as areas
of greatest protection. In descending order, the level
of priority is as follows: (1) Nature Reserve, (2)
National Park, (3) Regional Park, (4) SAC, (5) SPA,
GAMOLCS 2017 - International Workshop on Geomatic Approaches for Modelling Land Change Scenarios
372
(6) Peripheral Protection Zone in Sierra de
Guadarrama National Park.
A 5-km buffer of unprotected area around each
PA, joining up areas that are adjacent to each other
was established. From this buffer land that might be
protected for other reasons (public-utility forest,
public waters, roads, etc.) was excluded.
Cross-tabulation matrices (Pontius 2004) were
drawn to obtain values and maps of changes
between 1990-2006 and 2006-2025, comparing the
results with the protected areas depending on their
level of priority and with the 5-km buffer.
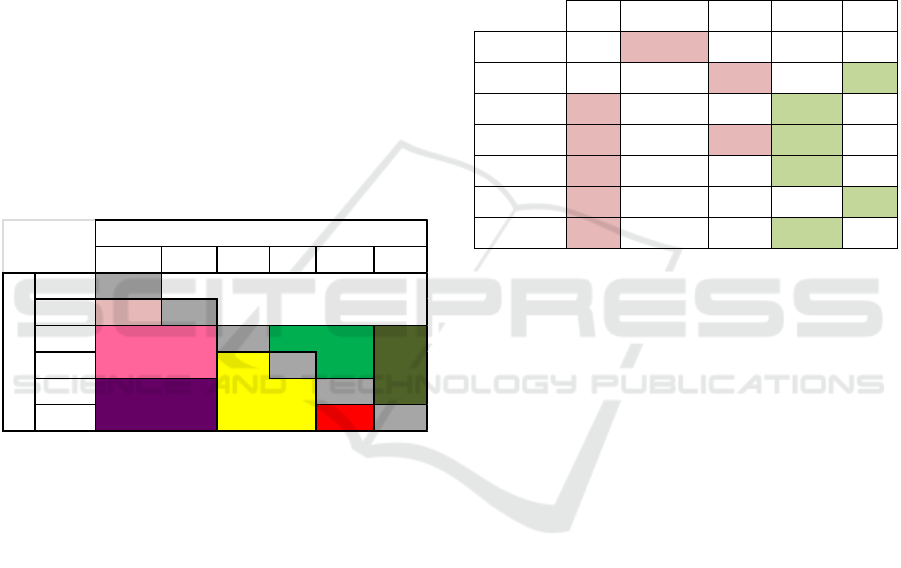
Table 2 shows the reclassification made in order
to analyse five different processes: a)
Artificialization (ART1 and ART2), b) Agricultural
land intensification and natural areas plowing (INT-
AGR), c) Agricultural land abandonment and natural
vegetation colonization (A-AGR), d) Forest
regeneration (FRG), and e) Natural vegetation
degradation (DEGR).
Table 2: Cross-tabulation matrix showing the land use
processes analysed.
4 RESULTS
Table 3 shows the percentage by zone (types of PAs
and their surroundings) of a given change process
(from categories i, j to categories l, m) that took
place between 1990 and 2006 regarding to the total
LULC change, a period of intense change. It refers
to shows which processes are more intense in each
PA.
There are large differences depending on the
degree of protection enjoyed by the different PAs.
The Regional Park, Peripheral Protection Zone,
Special Protection Area and Special Area of
Conservation were the most affected by the growth
of urban areas. In the surrounding area, almost 69%
of the change is related with urban growth. During
these years, 10% of the urbanization was developed
inside PAs and 60% in their neighbourhoods.
However, the principal process in the PAs with
highest degree of protection is the intensification of
the agriculture in the Nature Reserve and the forest
regeneration in the National Park. Its management
plans prioritize these processes. It is also remarkable
the abandonment of land and its recolonization by
natural vegetation in the context of a traditional
dryland agriculture crisis. This process is less
intense in the buffer area because most of the
abandoned agricultural land is now urbanized.
Table 3: Principal processes that took place between 1990
and 2006 in protected areas and their surroundings, in
percentage of total change.
1990-2006 ART INT-AGR DEGR A-AGR FRG
NR 1,01 97,97 0,00 1,01 0,00
NP 0,00 0,00 28,24 0,00 71,76
RP 42,45 13,87 6,08 35,34 1,69
SAC 27,34 11,33 25,03 20,70 14,56
SPA 30,84 4,78 14,59 35,23 15,56
PPZ 40,60 0,00 0,00 0,00 59,40
BUFFER 68,90 4,56 3,32 18,71 3,78
NR Nature Reserve, NP National Park, RP Regional Park,
SAC Special Area of Conservation, SPA Special
Protection Area, PPZ Peripheral Protection Zone.
Artificialization (ART), Agricultural land intensification
and natural areas plowing (INT-AGR), Agricultural land
abandonment and natural vegetation colonization (A-
AGR), d) Forest regeneration (FRG), and e) Natural
vegetation degradation (DEGR).
Figure 2 show the location of LULC changes
and their processes in the different PAs and in its
surroundings, between 1990 and 2006. Inside the
PAs, a change gradient according to its hierarchy is
shown. In the Natural Reserve there has almost been
no change as a result of its strict regulation. In the
National Park there has been an exchange between
natural land use classes: natural vegetation losses are
associated probably with forest fires, and on the
other hand, gains in this land use are related with a
policy of promotion of forest ecosystems. It should
be noted that the National Park Sierra de
Guadarrama has recently been declared (2013);
however, its mountains were formerly included in
the Natural Park of Peñalara and in the Regional
Park of Cuenca Alta del Manzanares, both with an
strict legislation regarding to land use changes.
5.000 ha have been urbanized in the three
Regional Parks. This change is related with forest
losses in the North and with agrarian losses in the
South and East of the region. In the Regional Park
UICALHASPF
U
IC INT-UR
AL
HA
SP
FDEGR
FR RG
A-AGR
t2
t1
NO
ART1
ART2
INT- AGR
Future Land Use Change Dynamics in Natural Protected Areas - Madrid Region Case Study
373
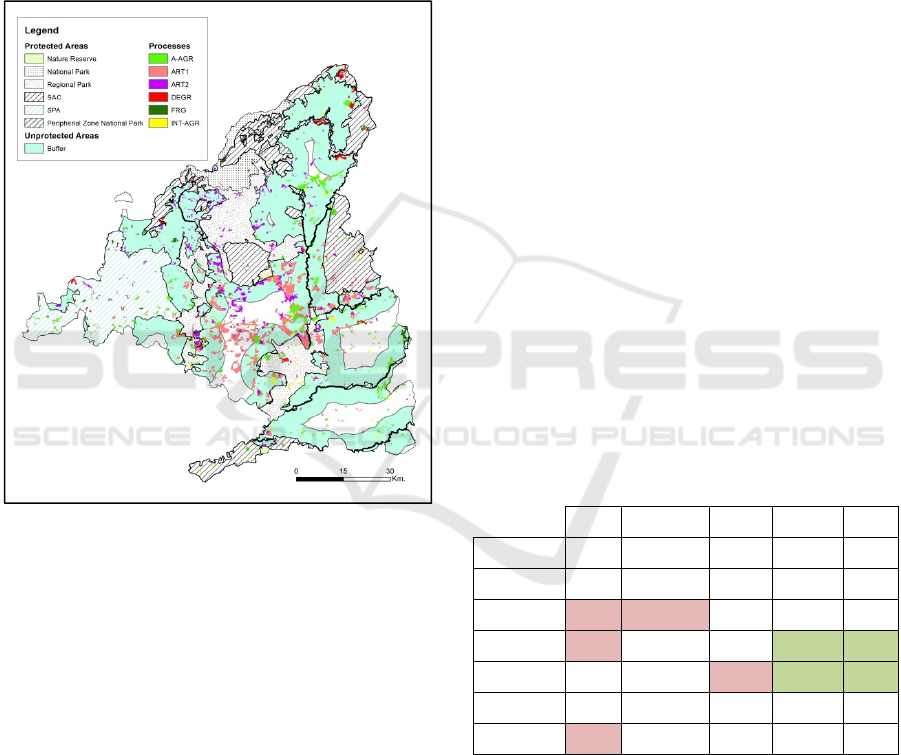
Parque Regional del Sureste, it is noteworthy a
forest fire that destroyed almost 200 ha of pine forest
in 2003.
SAC near to Madrid have also been affected by
new urban, industrial and infrastructure areas. The
more distant ones, located in mountain
environments, have increased their forest lands
related with the agriculture abandonment. In
addition, they have also recorded important forest
fires: in 1995, a forest fire burned more than 1.000
ha of pine trees in Somosierra.
Figure 2: Land use change dynamics occurred in the
Region of Madrid between 1990 and 2006. Sources:
CLC1990, CLC2006 and perimeters of Protected Areas
(MAPAMA). Own elaboration.
In this period, one of the most dynamic PAs has
been the SPA Encinares de los ríos Alberche y
Cofio, located in the Southwest of the region. More
than 1.200 ha of agricultural land has been
abandoned. In addition, fires have burned hundreds
of hectares of pine forest. Finally, about 600 ha of
forest and agricultural land have been urbanized.
The largest patch is a new development of single-
family homes built near the San Juan reservoir.
Since 1990 no agreement has been reached between
local and regional governments to approve a
management plan in this PA. Local governments
have taken advantage and they have modified their
urban planning in favor of this type of transitions.
Biggest LULC changes are located outside the
PAs. The buffer registered the largest new
urbanizations (more than 30.000 ha). In the north,
this new developments are located in former forest
ecosystems and in the south they occupy former
agriculture lands. PAs managers consider this urban
pressure as their main threat.
Tables 4 to 6 show the percentage of total LUCC
change that might take place between 2006 and the
three different scenarios run to year 2025.
Logistic regression was evaluated using the
receiver operating characteristics (ROC), which
varied between 0.763 (for Heterogeneous agriculture
land use) and 0.852 (Urban land use). Locations of
artificial uses are more related with driving factors
associated with distances and accessibilities. Travel
cost to the city of Madrid and distances to other
cities and to the airport are the explanatory variables
which defines the location of urban uses. Location of
industrial and commercial uses is related with the
accessibility to highways and other cities and the
airport and with distances to rivers and train
network. Agriculture lands, forests and shrub and
pastures are more related with the typology of soils,
slope and distance to rivers.
A Kappa value of 0.868 was obtained comparing
the real 2006 LULC map with the “business as
usual” scenario run to year 2006. K Location was
0.869 and K Histogram 0.925. The worst-calibrated
land use was the industrial and commercial use (just
35% of hits), while the others had over 60% of hits.
Table 4: Principal processes that might take place between
2006 and 2025 in the business as usual scenario, in
protected areas and their surroundings, in percentage of
total change.
2006-2025 ART INT-AGR DEGR A-AGR FRG
NR 0,00 0,00 0,00 0,00 0,00
NP 0,00 0,00 0,00 0,00 0,00
RP 38,57 51,51 0,00 9,91 0,01
SAC 55,56 0,00 0,00 25,34 19,10
SPA 0,05 0,00 1,54 88,13 10,28
PPZ 0,00 0,00 0,00 0,00 0,00
BUFFER 99,44 0,00 0,00 0,55 0,00
In the “business as usual” scenario (table 4) there
is no land use change expected in the Nature
Reserve and National Park. Changes in the Regional
Park may be related with an intensification of
agriculture (51.51% of the total change) and
artificialization (38.57%). In the Special Area of
Conservation and Special Protected Area will likely
be an increase of colonization of natural vegetation
due to land abandonment and also a forest
GAMOLCS 2017 - International Workshop on Geomatic Approaches for Modelling Land Change Scenarios
374
regeneration process. In the surrounding area the
most important process may be the artificialization
(almost 100% of the total change). It should be
noted that, unlike in the past years, there might be
not a big increase in the artificialization because
restriction on PA planning has taken into account in
the scenario development. It is expected that
restrictions might be respected in the future. This has
not occurred during the period 1990-2006.
Table 5: Principal processes that might take place between
2006 and 2025 in the economic-crisis scenario, in
protected areas and their surroundings, in percentage of
total change.
2006-2025 ART INT-AGR DEGR A-AGR FRG
NR 0,00 0,00 0,00 0,00 0,00
NP 0,00 0,00 0,00 0,00 0,00
RP 99,65 0,00 0,07 0,00 0,28
SAC 0,87 10,20 74,09 12,12 2,72
SPA 0,00 0,00 3,23 87,62 9,14
PPZ 0,00 0,00 0,00 0,00 100,00
BUFFER 98,58 0,03 0,02 1,37 0,01
Table 6: Principal processes that might take place between
2006 and 2025 in the green scenario, in protected areas
and their surroundings, in percentage of total change.
2006-2025 ART INT-AGR DEGR A-AGR FRG
NR 0,00 0,00 0,00 0,00 100,00
NP 0,00 0,00 0,00 0,00 0,00
RP 9,74 0,00 0,00 18,22 72,05
SAC 12,12 0,00 0,00 2,93 84,95
SPA 0,01 0,00 1,19 55,11 43,69
PPZ 0,00 0,00 0,00 0,00 100,00
BUFFER 67,64 0,00 0,00 7,56 24,79
In the economic-crisis scenario and green
scenario there might be no change in the PAs with
highest protection. However, in the first one
artificialization will likely be the principal process in
the Regional Park and degradation might be the
most important process in the Special Area of
Conservation. It highlights also the change to natural
vegetation in the Special Protection Area with an
important natural colonization process and in the
Peripheral Protection Zone where the only change
might be an increase of forest regeneration.
In the green scenario the most important
processes in the different PAs may be related with
the abandonment of the agriculture and the
regeneration of the vegetation. It is expected that
policies promoted by PAs managers will encourage
these processes
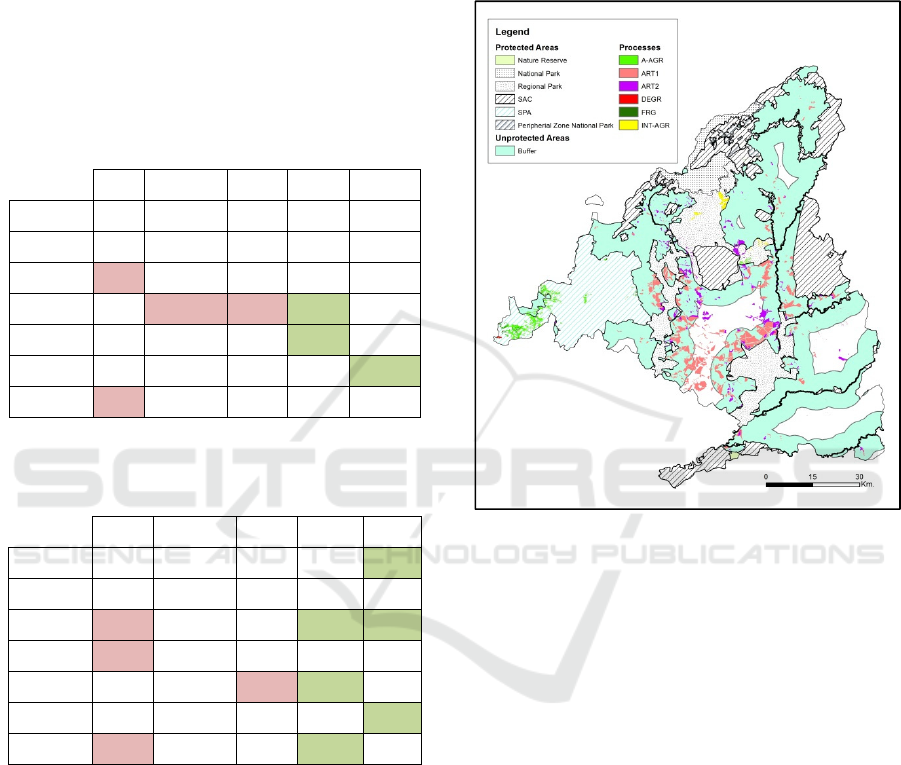
Figure 3 show the location of expected LULC
changes between 2006 and 2025 in the “business as
usual” scenario.
Figure 3: Land use change dynamics expected in the
Region of Madrid between 2006 and 2025 under a
“business as usual” scenario. Sources: CLC1990,
CLC2006, perimeters of Protected Areas (MAPAMA) and
other auxiliary geographic data. Own elaboration.
In figure 3 is remarkable the expected
progression of forest ecosystems on agriculture
lands (almost 4.000 ha) and the natural regeneration
of vegetation (almost 500 ha) in the SPA located in
the Southwest of the region. This process is also
expected to occur in the south of the Regional Park
Cuenca Alta del Manzanares.
In this PA, 900 ha of urbanization is expected,
associated with the accessibility provided by A6 and
M607 highways.
In the PA neighborhoods, highlights the
expected urban and industrial increase.
In this area almost 28.000 hectares might be
added to the current urban area. The impacts that
will likely generate (soil sealing, biodiversity loss,
fragmentation, habitat isolation) are subject of
concern for environmental groups and PAs
managers.
Future Land Use Change Dynamics in Natural Protected Areas - Madrid Region Case Study
375

5 DISCUSION OF THE RESULTS
In order to update our study, it would be very useful
to have access to CLC2012. However, there has
been a change in the elaboration of its methodology,
so at the present time CLC2012 can only be
compared with CLC2006 version 18.5.
Another topic for discussion is the size of the
buffer. A width of 10 km is often used in the
literature, (Bruner et al. 2001; Figueroa and
Sánchez-Cordero 2008; Martinuzzi et al. 2015). In
the case of the region of Madrid, a 10km buffer
would be a complex solution because, with the
territorial distribution of its PAs, much of the
regional surface area would be within that buffer and
it would include ecosystems that are very different
to those represented in the PAs that were urbanised
many decades ago. Other works have used a
dynamic buffer (1km inside and 1km and 5km
outside the PA, Spracklen et al., 2015).
Scenarios show that in year 2025 it can be
expected no LULC changes in the Nature Reserve,
National Park and Peripheral Protection Zone,
except in the green scenario which will likely be
forest regeneration in the first and last ones. It can be
expected that in a green scenario, local production
and local markets may get more relevance and
diminish the need for transportation of food.
However, in an urban region such as Madrid, it is
expected that agriculture lands with biophysical
limitations (edaphic, topographical and climatic)
will be abandoned, despite the fact that local markets
may be encouraged. If this scenario comes true,
management plans will promote the regeneration of
natural vegetation.
The results obtained in our research are in line
with the findings of previous studies on land use
change in similar or nearby areas (Hewitt and
Escobar 2011; Díaz-Pacheco and Gutiérrez 2013;
Gallardo and Martínez-Vega 2016). They are also in
line with the results of future scenarios in protected
areas and their surroundings in the region of Madrid
(Ruiz-Benito et al. 2010) and in the USA
(Martinuzzi et al. 2015)
6 CONCLUSIONS
In general, agricultural areas contributed most to the
growth of urban areas. Although in relative terms
persistence is very high inside the PAs, the increase
in built-up area is a worrying process from an
ecological point of view. Naturalisation of
abandoned agricultural land is less worrying from
the ecological point of view. Revegetation affected
over 10,000 ha, about 3% of the area studied. Both
processes occurred with greater intensity in the areas
around the PAs.
In urban areas such as the Madrid region the
spill-over effect of protected areas should be
monitored. It is clear that they attract urban
developments to less protected areas around them.
Transformation of their agricultural and natural
habitats may have irreversible effects on
biodiversity. Fragmentation brings with it longer
exterior and interior edges. It can also create external
threats for protected areas such as invasion by exotic
species or the propagation of forest fires. These
threats increase the potential ecological vulnerability
of these spaces.
ACKNOWLEDGEMENTS
This research received funding from the Spanish
National R&D project DISESGLOB (CSO2013-
42421-P). Marta Gallardo was sponsored by a JAE-
Predoc Grant from the Spanish National Research
Council (CSIC).
REFERENCES
Bruner AG, Gullison RE, Rice RE, da Fonseca GAB.
2001. Effectiveness of Parks in Protecting Tropical
Biodiversity. Science 291: 125-128
Chuvieco E, Martínez S, Román MV, Hantson S, Pettinari
L. 2013. Integration of ecological and socio-economic
factors to assess global vulnerability to wildfire. Glob
Ecol Biogeogr 23(2):245-258. doi:10.1111/geb.12095
Dantas de Paula M, Groeneveld J, Huth A. 2015. Tropical
forest degradation and recovery in fragmented
landscapes. Simulating changes in tree community,
forest hidrology and carbon balance. Global Ecology
and Conservation 3:664–677.
doi:10.1016/j.gecco.2015.03.004
Díaz-Pacheco J, Gutiérrez J. 2013. Exploring the
limitations of CORINE Land Cover for monitoring
urban land-use dynamics in metropolitan areas.
Journal of Land Use Science.
doi:10.1080/1747423X.2012.761736
Eastman JR. 2012. IDRISI Selva. Guía para SIG y
procesamiento de imágenes. Clark University,
Worcester
Figueroa F, Sánchez-Cordero, V. 2008. Effectiveness of
natural protected areas to prevent land use and land
cover change in Mexico. Biodivers Conserv 17:3223–
3240. doi:10.1007/s10531-008-9423-3
GAMOLCS 2017 - International Workshop on Geomatic Approaches for Modelling Land Change Scenarios
376

FRA. 2010. Global Forest Resources Assessment 2010.
FAO, Rome. http://www.fao.org/docrep/013/i1757e/
i1757e.pdf. Accessed 22 January 2017
Gallardo M. 2014. Cambios de usos del suelo y simulación
de escenarios en la Comunidad de Madrid (Changes
in land use and simulation scenarios in the region of
Madrid). Universidad Complutense, Madrid
http://eprints.ucm.es/25253/. Accessed January 2017
Gallardo M, Martínez-Vega J. 2016. Three decades of
land-use changes in the region of Madrid and how
they relate to territorial planning. Eur Plan Stud 24(5):
1016-1033 doi.10.1080/09654313.2016.1139059
Hewitt R, Escobar, F. 2011. The territorial dynamics of
fast-growing regions: Unsustainable land use change
and future policy challenges in Madrid, Spain. Appl
Geogr 31(2):650–667. doi:10.1016/
j.apgeog.2010.11.00
Hewitt, R., Pera, F. and Escobar, F. 2016. Cambios
recientes en la ocupación del suelo de los parques
nacionales españoles y su entorno. Cuadernos
Geográficos 55(2), 46-84.
Juffe-Bignoli D, Burgess ND, Bingham H, Belle EMS, de
Lima MG, Deguignet M, Bertzky B, Milam AN,
Martinez-Lopez J, Lewis E, Eassom A, Wicander S,
Geldmann J, van Soesbergen A, Arnell AP, O’Connor
B, Park S, Shi YN, Danks FS, MacSharry B, Kingston
N. 2014. Protected Planet Report 2014. UNEP-
WCMC, Cambridge https://portals.iucn.org/library/
sites/library/files/documents/2014-043.pdf. Accessed
22 January 2017
Lambin EF, Turner BLI, Geist HJ, Agbola SB, Angelsen
A, Bruce JW, Coomes OT, Dirzo R, Fischer G, Folke
C, George PS, Homewood K, Imbernon J, Leemans R,
Li X, Moran EF, Mortimore M, Ramakrishnan PS,
Richards JF, Skänes H, Steffen W, Stone GD, Svedin
U, Veldkamp TA, Vogel C, Xu J. 2001. The causes of
land-use and land-cover change: moving beyond the
myths. Glob Environ Change 11:261–269.
doi:10.1016/S0959-3780(01)00007-3
Lei C, Lin Z, Zhang Q. 2014. The spreading front of
invasive species in favorable habitat or unfavorable
habitat. Journal of Differential Equations 257:145-
166. doi:10.1016/j.jde.2014.03.015
López Lambas ME, Ricci S. 2014. Planning and
management of mobility in natural protected areas.
Procedia Soc Behav Sci 162:320-329.
doi:10.1016/j.sbspro.2014.12.213
Martínez-Fernández J, Ruiz-Benito P, Zavala MA. 2015.
Recent land cover changes in Spain across
biogeographical regions and protection levels:
Implications for conservation policies. Land Use
Policy 44:62-75.
doi:10.1016/j.landusepol.2014.11.021
Martinuzzi S, Radeloff VC, Joppa LN, Hamilton CM,
Helmers DP, Plantinga AJ, Lewis DJ. 2015. Scenarios
of future land use change around United States’
protected areas. Biol Conserv 184:446-455.
doi:10.1016/j.biocon.2015.02.015
McDonald RI. 2013. Implications of Urbanization for
Conservation and Biodiversity Protection. In: Levin
SA (ed.) Encyclopedia of Biodiversity, 2nd edn.
Academic Press, Amsterdam, p 231–244
Pontius Jr RG. 2000. Quantification error versus location
error in comparison of categorical maps.
Photogramm
Eng and Remote Sens 66:1011-1016.
Romero-Calcerrada R, Perry GLW. 2004. The role of land
abandonment in landscape dynamics in the SPA
Encinares del rio Alberche y Cofio, Central Spain,
1984–1999. Landsc Urban Plan 66:217–232.
doi:10.1016/S0169-2046(03)00112-9
Ruiz Benito P, Cuevas JA, Bravo de la Parra R, Prieto F,
García del Barrio JM, Zavala MA. 2010. Land use
change in a Mediterranean metropolitan region and its
periphery: assessment of conservation policies through
CORINE land cover data and Markov models. For
Syst 13(3):315–328
Ruiz-Mallén I, Corbera E, Calvo-Boyero D, Reyes-García
D. 2015. Participatory scenarios to explore local
adaptation to global change in biosphere reserves:
Experiences from Bolivia and Mexico. Environ Sci
Policy 54:398-408. doi:10.1016/j.envsci.2015.07.027
Sangermano F, Toledano J, Eastman JR. 2012. Land cover
change in the Bolivian Amazon and its implications
for REDD+ and endemic biodiversity. Landsc Ecol
27:571–584. doi:10.1007/s10980-012-9710-y
Spracklen BD, Kalamandeen M, Galbraith D, Gloor E,
Spracklen DV. 2015. A global analysis of
deforestation in moist tropical forest Protected Areas.
PlosOne 10(12): e0143886.
doi:10.1371/journal.pone.0143886
Van Vliet J. 2009. Assessing the accuracy of changes in
spatial explicit land use change models. In: 12th
AGILE International Conference on Geographic
Information Science, Leibniz Universität, Hannover,
2-5 June 2009
Future Land Use Change Dynamics in Natural Protected Areas - Madrid Region Case Study
377
