
Modelling Transport-based Land-use Scenarios in Bogota
Francisco Escobar
1
and Daniel Paez
2
1
Dpt of Geology, Geography and Environmental Sciences, University of Alcala, Spain
2
Dpt of Civil and Environmental Engineering, University of Los Andes, Colombia
Keywords: Cellular Automata, Land-use, Modelling, Transport, Bogota.
Abstract: Economic growth experienced in Colombia since 2001 has impacted on heavier traffic levels in the capital
city of Bogota which in turn have worsened air pollution indicators and environmental public health
conditions. Different political options competing at municipal elections have included their respective
proposals for public transport in their programs. Impact expected from each of these scenarios makes it
necessary to implement models allowing their assessment. Given this need, we present the Bogota Land
Development Model (BoLD), a practical implementation of a Land-use Cover Change (LUCC) simulation
based on two different public transport scenarios; a highway-based network and a suburban rail system.
Transport scenarios are combined with options to expand the city into natural reserves. Customized
geospatial analyses were developed for calculating accessibility distance decay factors based on overtime-
spatial decay determination (OSDD) method. Results of the scenarios are presented both in maps and in
“mobility circles”. Validation of the results suggests that OSDD and the mobility circles appear to
contribute to better information to decision-making when evaluating urban scenarios driven by transport
projects.
1 INTRODUCTION
Increasing traffic congestion and public and political
debate about the need of more sustainable
transportation modes are current hot topics in
Bogota. In response to this debate, a Land-use Cover
Change (LUCC) model to evaluate transport
alternatives for the Bogota western growth areas is
presented. The model, called the Bogota Land
Development model or BoLD, uses Metronamica
software. BoLD was conceived to address the need
to understand global impacts on the urban
development of transport infrastructure projects.
This is particularly important for a city that has had
its political agenda driven by transport projects.
2 METHODOLOGY
2.1 Study Area
Although other areas of the city have had significant
debate in terms of its growth (for example, the South
for low income population and the North for the
rich), stakeholder workshops as well as current
administration priorities brought our attention to the
West growth area (Universidad de Los Andes 2015).
Thus, the study area was determined by the city of
Bogota and the main surrounding municipalities
located to its West. These are: Funza, Mosquera,
Madrid, Focatativá, Cota and Soacha (figure 1). All
together add a total of 7.5 million inhabitants of
which Bogota holds 6.5 million (DANE 2011).
2.2 Infrastructure and Land
Development Proposals for Bogota
For the West, transport proposals have aimed to
either increase current road infrastructure for buses
or to create a new suburban rail service running on
the existing freight infrastructure (Regiotram 2014).
The Light Rail Transit (LRT) is planned to be
developed as a public-private partnership between
private investors, the city of Bogota and the State of
Cundinamarca. The LRT objective is to supply a
fast, environmentally-aware, safe and integrated
transport option for the West. It is intended to
provide users with an alternative to the current road-
based public transport (Regiotram 2014). The
proposal is that it will operate as a commuter train in
the inter-urban areas outside Bogota, and as a
Escobar, F. and Paez, D.
Modelling Transport-based Land-use Scenarios in Bogota.
DOI: 10.5220/0006386503570365
In Proceedings of the 3rd International Conference on Geographical Information Systems Theory, Applications and Management (GISTAM 2017), pages 357-365
ISBN: 978-989-758-252-3
Copyright © 2017 by SCITEPRESS – Science and Technology Publications, Lda. All rights reserved
357
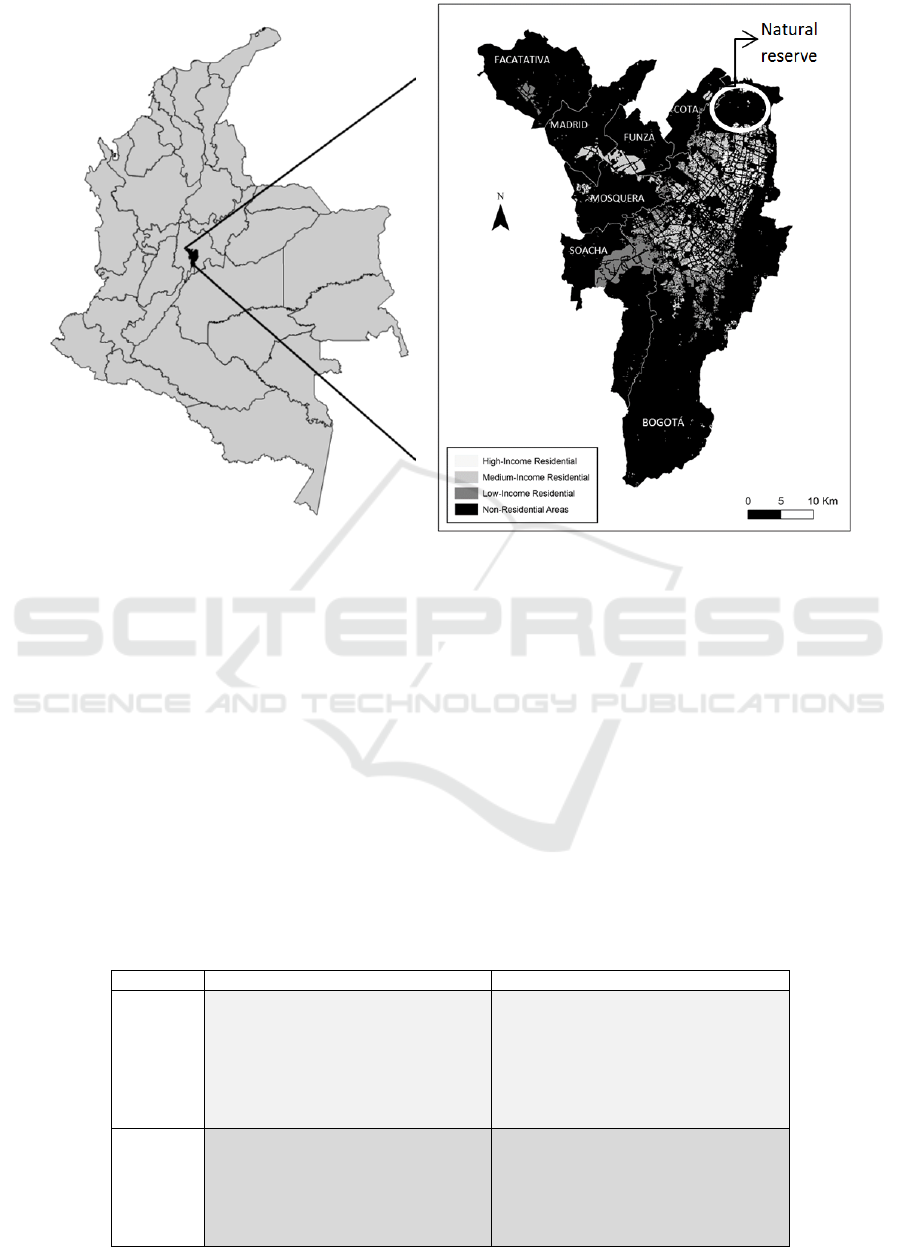
Figure 1: Study area, income-based residential areas modelled and location of natural reserve.
tramway in Bogota’s urban areas, reaching speeds of
110km/h and 60 km/h respectively (Regiotram
2014).
Instead of the LRT, the road proposal includes
road improvement in the Western and Northern parts
of the city. It involves constructing urban highways
to replace some of the roads that connect Bogota
CBD to other town centres.
To complement these infrastructure scenarios,
the Van Der Hammen reserve (VDH), a 1400
hectares of natural reserve in Bogota’s North, has
been included in the analysis. Supporters of
developing the reserve argue that having available
land for residential developments close to existing
commercial and industrial areas would provide
shorter travel distances. These benefits, combined
with sensible urban development, could potentially
surpass benefits of maintaining the land as an
environmental reserve (El Tiempo 2016).
Considering these options, four scenarios were
set to be modelled in BoLD (table 1).
2.3 Data Collection
In order for the implemented model to be able to
deal with the four proposed scenarios, a large range
of data sets were required.
Table 1: Scenario narratives in BoLD.
Road infrastructure
Suburban train infrastructure
Natural reserve
maintained
Scenario 1: Road infrastructure
continues to be the main source of
transport for growth areas in the West.
New roads allow additional connections
between municipalities and Bogota. No
changes to existing restrictions to
urbanization in the VDH reserve.
Scenario 2: Existing freight rail
infrastructure upgraded to provide a
suburban service for passengers in Bogota
and municipalities in the West. New road
constructions or upgrades are limited to
areas were no infrastructure currently
exists.
Natural
reserve
urbanized
Scenario 3: As in scenario 1, roads
are upgraded to provide accessibility in
the West. However, land regulations are
changed so VDH reserve is urbanized by
providing additional road infrastructure
as well as BTR services.
Scenario 4: As in scenario 2, a new
train service is developed for the West.
However, land regulations are changed so
the VDH reserve is urbanized by providing
additional road infrastructure as well as
BTR services.
GAMOLCS 2017 - International Workshop on Geomatic Approaches for Modelling Land Change Scenarios
358

A LUCC model is typically calibrated by
providing two different datasets of the study area
(Straatman 2004). Generally, these datasets need to
be separated in time by around 10 years to meet the
LUCC dynamics (Hewitt et al. 2014). The
calibration process consists on replicating the LU
map of the second date with a sufficient level of
similarity to the actual LU map. The goodness of the
model can be assessed by means of both qualitative
and quantitative methods (Hewitt et al 2014). The
model is then extended to the final simulation date.
In the BoLD case, the calibration process was
substituted by the application of the neighbouring
rules and accessibility analysis. Although this may
be arguable, literature shows that calibration
assessment is still a challenge and indices such as
kappa and others are highly criticized (Pontius and
Millones, 2011). Thus, visual assessment of
calibration (van Vliet et al 2012) can be considered
as good. Besides, the perceived value of these
models is shifting from their very arguable
predicting capacity to their usefulness as a tool for
share-learning throughout the modelling process
(Escobar et al 2015).
Multiple datasets were explored. Cadastral or
planning datasets containing complete land-use
cover in two different years was only obtainable for
the Bogota municipality. Municipalities in the West
did not have complete information and, therefore, a
combination of datasets (mainly Landast imagery)
was used to produce a complete dataset of land-use
cover for both the baseline and the calibration years.
Although the time lapse is only 9 years (2005-2014),
the rapid growth experienced in Bogota during those
years has resulted in more than sufficient amount of
LUCC as to properly calibrate the model. In order to
address limitations to Landsat images additional data
sets were sourced. Table 2 describes them and shows
how they were used to improve information from the
Landsat images.
2.4 Model Implementation
In a general sense, a LUCC model based on cellular
automata requires inputs (of both information and
parameters) in the following areas:
a. Future land demands
b. Current and future land zoning changes and
suitability conditions
c. Neighbouring relationships between land-
uses, and
d. Accessibility analysis based on transport
infrastructure.
a. Future land demand inputs were developed based
on forecasting current growth trends. Demands for
the three income levels of residential land-uses
modeled (figure 1) were based on population growth
forecasted by the National Statistics Department
(DANE 2016). The other two key land-uses included
in the model, commercial and industrial, were
projected based on the GDP expected by the Bogota
and its surrounding region (DANE 2016; DANE
2016b). According to reports from the Bank of the
Republic, the industry is projected to grow 2.7% for
the next 2 years. FENALCO (National Federation of
Retailers) has estimated that for the next two to three
years the commercial activity is likely to grow
around 3% (FENALCO 2014).
DANE and FENALCO data were used to
estimate future land demands in residential and in
commercial and industrial respectively. In order to
Table 2: Datasets adopted for the BoLD Model.
Dataset
Description
Application in BoLD
2014 cadastral
dataset for Bogota
Parcel-based cadaster dataset for
Bogota that includes land-use
coverage for every land parcel and the
fiscal land value of them
Calibration of land-use
coverage areas in Bogota
2005 to 2011
planning zones
Planning zones for areas outside
Bogota municipality with their
intended or authorized land-use
coverage
Calibration of land-use
coverage areas in Bogota by
detecting vacant zones and
more likely land-use based on
regulatory restrictions
2005 and 2014
water body
inventory
Official dataset of rivers, lakes
and other water bodies in the area
Determination of areas
covered by water not always
identifiable by Landsat images
2005 and 2014
national and
regional parts and
reserves
Official dataset from national
government describing legally
environmentally protected land in the
study area
Separation of parkland
from agricultural lands as well
as identification of forest
reserves
Modelling Transport-based Land-use Scenarios in Bogota
359
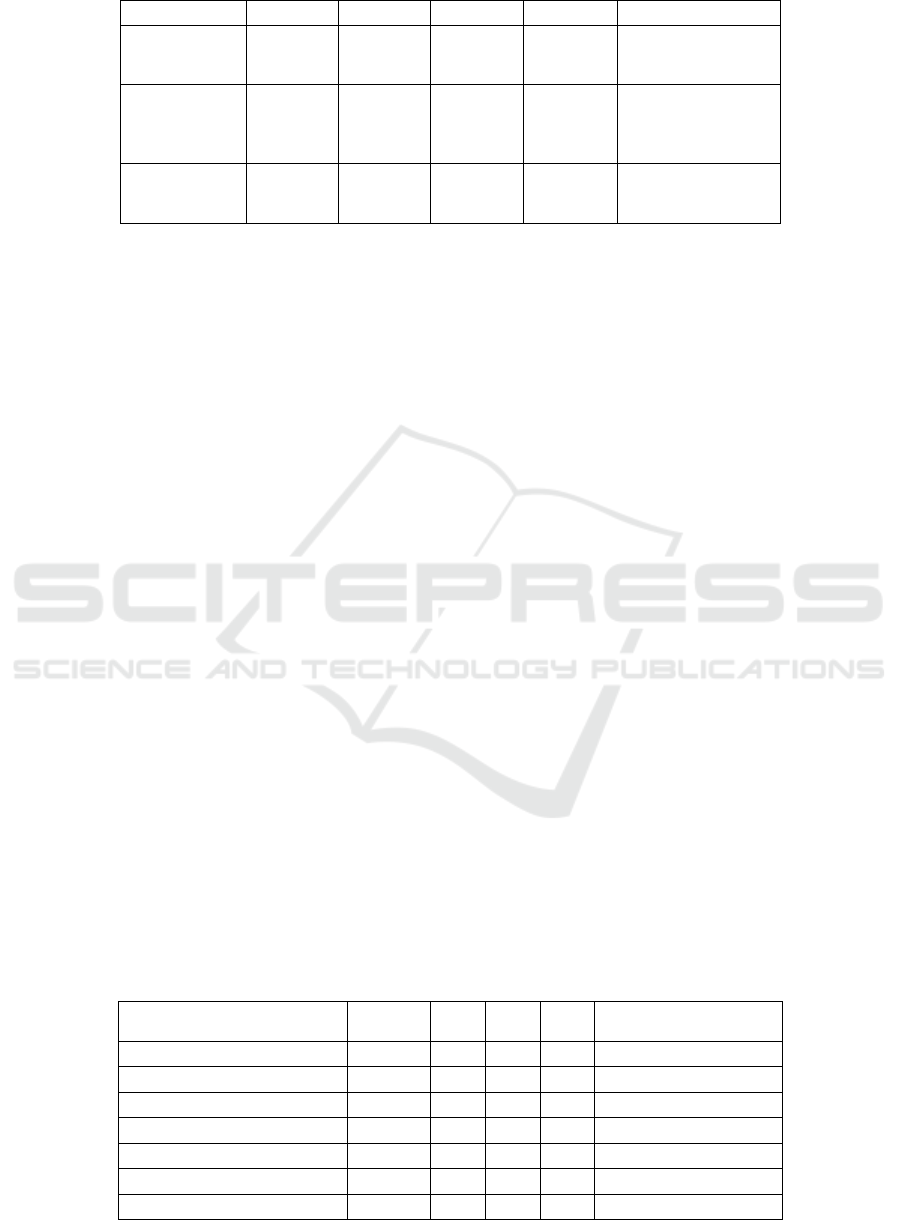
Table 3: Population growth projection. (Based on data from DANE and FENALCO).
Year
2005
2014
2023
2032
2040
Total
Population
(People)
7.556.515
8.661.781
9.737.843
10.808.780
11.760.724
Total
Commercial
(mill COP -
GNP)
69.324
152.931
201.478
262.883
333.012
Total Industrial
(mill COP -
GNP)
29.119
51.215
61.807
73.865
86.544
estimate future land demands for a city, information
provided by a national entity (Mancosu et al. 2015;
Aljoufie 2014) or land demand estimated by
researchers (Hewitt et al. 2012) can be adopted. This
is the rational for obtaining the projections for
population growth by mathematical extrapolation.
The extrapolation was divided into 4 different
periods of the same number of years each, thus land
demand was known for 2005-2014 and estimated for
2023, 2032 and 2040 (table 3).
Based on the expected growth, the number of
hectares for the increase in land demand for future
years can be observed in the table 4.
b. Model inputs were sourced from local zoning
regulation data. Following experiences of other
developing cities (Lombard 2014; Heinrichs and
Bernet 2014), growth of residential areas is not
strictly limited to authorized or permitted areas.
Informal settlements are still common. In Bogota
construction outside authorized areas is still a
significant problem for low-income residential land-
use (Escobedo et al. 2015).
Bogota and its neighbouring municipalities do not
have an integrated land planning system. This leads
to land-use plans that are often inconsistent. After
reviewing all land-use planning zones in all
municipalities, the following zoning categories were
included into BoLD:
Archaeological: All areas having
archaeological elements of value.
Heritage: All areas that have historical and
cultural character, which must be preserved
and protected as they are part of fabric of
each culture or nation.
Environmental Restriction: All areas that
have a strategic role in biological processes
and contribute to biological diversity; as
well as the provision of basic resources for
human subsistence.
Industrial Use: All areas that currently have
high industrial activity. Road network: All
areas through which traffic flows.
Environmental slightly restricted: All areas
that have a strategic role in biological
processes and contribute to biological
diversity; however, they are not protected
or are already fragmented or affected by
human activity.
Airport: Whole airport area.
A similar procedure to zoning was performed for
including suitability in BoLD. Suitability refers to
natural conditions under which land-uses develop.
The regional risk management authority provided
the information used. In BoLD, the suitability was
evaluated by landslide, flood zones, heavy rounds
and ponding.
c. Neighbouring interactions are fundamental in a
LUCC model. To represent them, a methodology
based on spatial analysis and Laplace probability
Table 4: Estimated land demand.
Year
2014
2023
2032
2040
% Cells per land-use
for 2040
Residential High Income
1359
1411
1566
1704
4,22
Residential Medium Income
11607
15519
18530
21582
53,41
Residential Low Income
7949
6584
6003
5112
12,65
Commercial
1146
1510
1970
2495
6,18
Industrial
5633
6798
8124
9519
23,55
Total Cells
27694
31821
36193
40412
100,00
Cells Increment (%)
13%
12%
10%
GAMOLCS 2017 - International Workshop on Geomatic Approaches for Modelling Land Change Scenarios
360
concepts was used (Hansen 1993). This
methodology was taken from Laplace´s rule formula
and adapted for the BoLD model using ArcGIS to
calculate distances between land-uses and their
relation to land-use cells in a defined searching
radius.
(1)
Where,
A= Land-use A
B= Land-use B
D
AB
= Distance between A and B
R= Searching radius
n= Number of cells in A
X
AB
= Attractiveness Index of A to B
d. Accessibility is the level of transport service
provided in a specific area. For LUCC models,
accessibility refers to the preference of most land-
uses to locate closer to transport services. A highly
accessible location is more likely to be developed.
Mathematically, accessibility in a LUCC model
based on cellular automata can be expressed as
(RIKS 2007):
(2)
Where:
is the accessibility of cell, c, in
relation to a certain type of node or
transport link, y, (for example, a main road
or train station) for a specific land-use, s
is the accessibility distance decay
factor (ADDF) which varies depending on
the type of infrastructure, y, and it is
individual for each land-use, s
is the distance to the specific cell
being analyzed to the infrastructure, y, and
at a specific time, t
Result from this equation can only have a value
between 0 and 1 for each cell. As the scenarios being
modeled determine distance to the nearest transport
infrastructure, assigning ADDF for each type of
infrastructure considered and for each land-use is a
key task for the modeler.
Although the determination of ADDF is
commonly based on empirical experiences (Furtado
2009), the significance of these factors required us to
explore advanced technical approaches to determine
ADDF. A methodology based on GIS was used to
determine ADDF. We have called this methodology
OSDD (Overtime Spatial Decay Determination).
OSDD is based on three principles. The first is
that ADDF factors are usable for modeling future
scenarios.
The second assumption is that ADDF for each
type of infrastructure and for each land-use is
proportional to each other. In other words, if two
ADDF for two different infrastructures are equal
they have the same contribution to the overall
attractiveness of cells in the model. Consequently,
and considering that OSDD creates ADDF with
values between 0 and 1, specific transport
infrastructure, y, for particular land-uses, s, has a
low proportional accessibility, OSDD would assign
a value of 0.
The third principle considers that the average
distance between cells within 2 km of a particular
land-use and the infrastructure is a good indicator of
the ADDF. In consequence, the larger the average
distance, the smaller the decay factor would be.
The results of applying OSDD are ADDF values
between 0 and 1. Additionally, and considering that
transport infrastructure could be modeled as lines or
points in a GIS system, double normalization is
conducted.
Using processed datasets for 2005 and 2014 in
the BoLD model, OSDD was applied and the results
were compared.
3 RESULTS
After implementing BoLD using the parameters
described in the previous section, including de
ODDC for accessibility analysis, results were
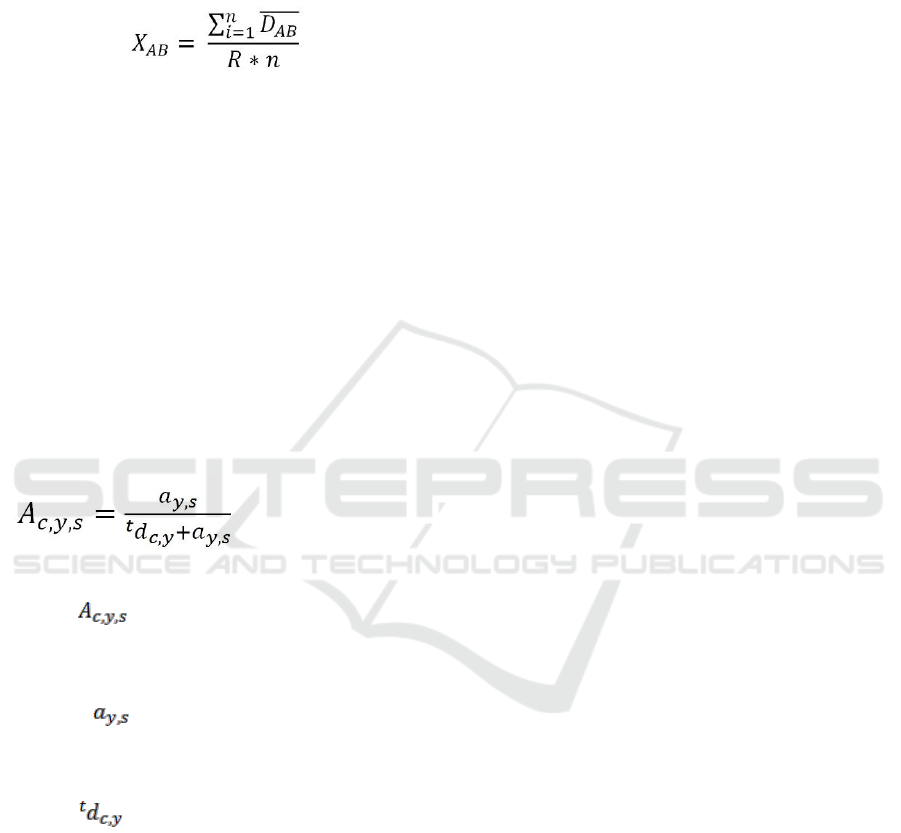
obtained for all scenarios. Maps results of the
baseline year (2014) and the simulated result for
2040 for each scenario are presented in figure 2.
General patterns of development are maintained
in all scenarios. This is probably due to the fact that
Bogota is a mature city in where trends have been in
place for many years. However, there are differences
in specific zones between scenarios (highlighted
with red circles). For the first scenario, increased
commercial development along the proposed road
with additional industrial in their surrounding areas
can be noticed. Also, industrial areas in the far West
appear among farming zones. These two are
expected results as additional road capacity is
particularly attractive to commercial and residential.
Modelling Transport-based Land-use Scenarios in Bogota
361
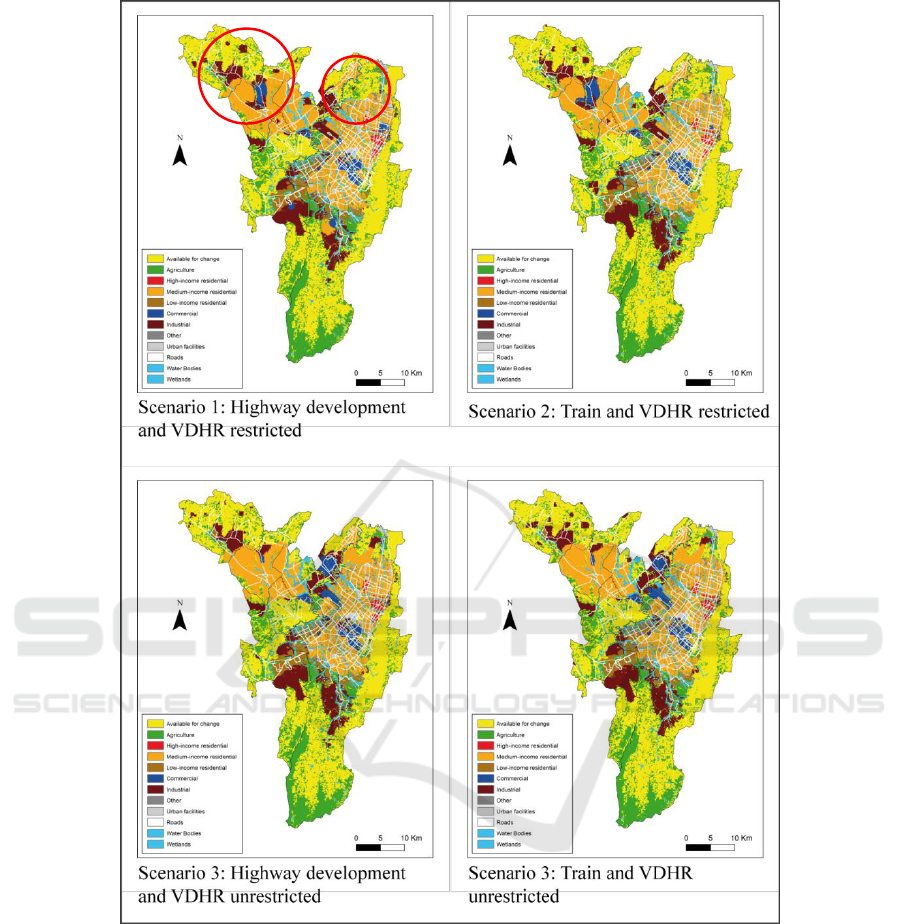
Figure 2: Resulted land-use maps for 2040 scenarios.
For the rail system scenario, residential and
commercial development concentrates along
proposed stations. This is particularly notorious in
bordering areas between Bogota and the
municipalities.
In scenarios with the natural reserved open for
development (scenarios 3 and 4) the influence of
transport infrastructure in land patterns are very
similar to those described for scenarios 1 and 2.
However, the additional land availability in the
North creates a concentration of medium income
inside Bogota while at the same time promoting
low-income development in the outskirt of the urban
area. This result suggests a pattern already occurring
in Bogota where low income population are forced
to live in high densities locations far from the center.
As new transport infrastructures are created, land
values increases whereas land for low income is
further out. In order to develop a decision support
information system and identify differences between
all four maps, the circles of mobility (figure 3) were
produced for all scenarios. They are intended to
support the understanding of implications, in terms
of sustainability indicators, of each scenario.
GAMOLCS 2017 - International Workshop on Geomatic Approaches for Modelling Land Change Scenarios
362
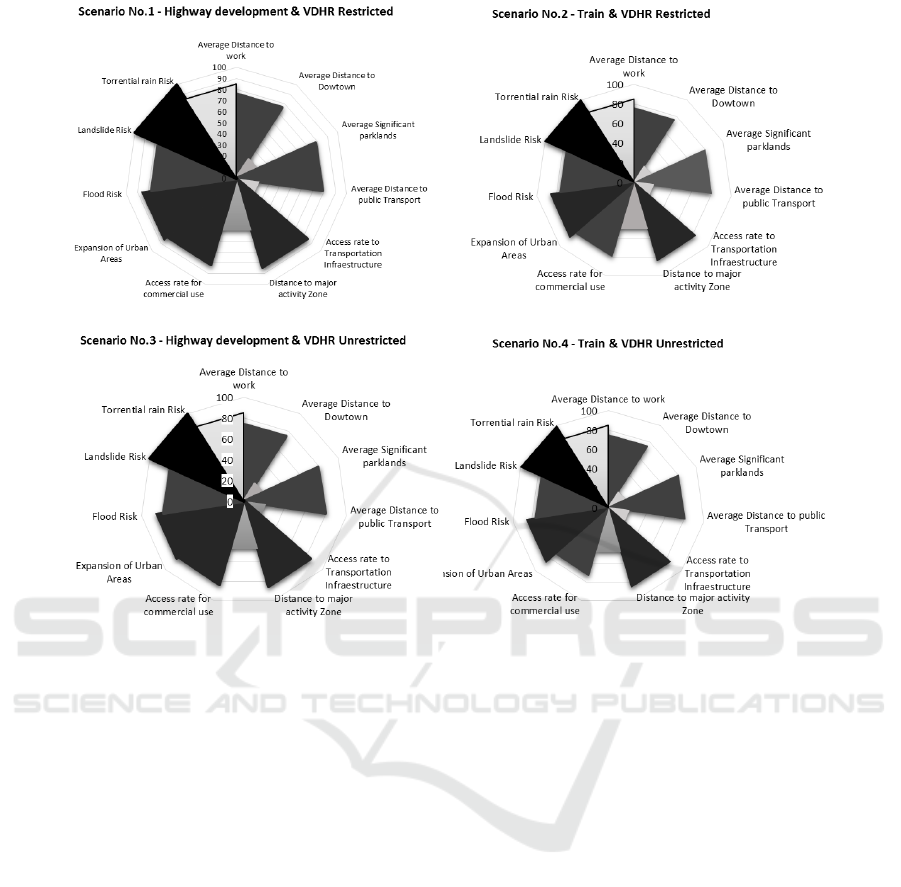
Figure 3: Circles of mobility for all 4 scenarios.
Scenarios 1 and 2 show notable differences.
Average distance to downtown changes in
approximately 1% making it to change of level in
the circle. Access rate for commercial land-use
changes in 2% creating the same effect in the circle.
On the other hand, Scenario 3, compared to
Scenario 2, shows significant changes. Average
distance to downtown changes in approximately 1%
making it to change of level in the circle. Access rate
for commercial land-use changes in 10% changing
in one level of the circle.
Concerning the others indicators, they remain in
the same rates across all scenarios. Expansion of
urban areas, landslide risk and torrential rain risk are
in all scenarios between 90% and 100%. Average
distance to work, average distance to significant
parklands and flood risk are between 60% and 80%
in all scenarios. However, average distance to public
transport remains lower than 30% in all four
scenarios.
Changes between scenarios 1 and 2 are at first in
terms on average distance to downtown. The
average distance is lower with a highway scenario
where more residential land-use is developed near
the city; therefore train-based scenario promotes
development towards near municipalities. As
commercial land-use tends to allocate near new
roads, increase in this land-use was likely to happen
in scenario 1.
However, comparison between scenario 3 and 4
indicates major changes. New development of
commercial land-use is higher in scenario 3 because
of the unrestricted reserve. With VDHR unrestricted,
residential land-use tends to allocate in the new
unrestricted area while the commercial land-use
tends to allocate where low income residential were.
Average distance to downtown increases also due to
the housing process in the reserve.
As location and type of transport infrastructure
varies in each of the scenarios, changes produced are
different. Table 5 shows total area for each land-use
type in the baseline year (2014) and for the forecast
year (2040).
As expected in this matrix, most of the new
development occurs by the conversion of available
land uses (both agricultural and land reserved for
expansion). According to the model, 3121 hectares
of agricultural land would be converted into urban
areas.
Modelling Transport-based Land-use Scenarios in Bogota
363
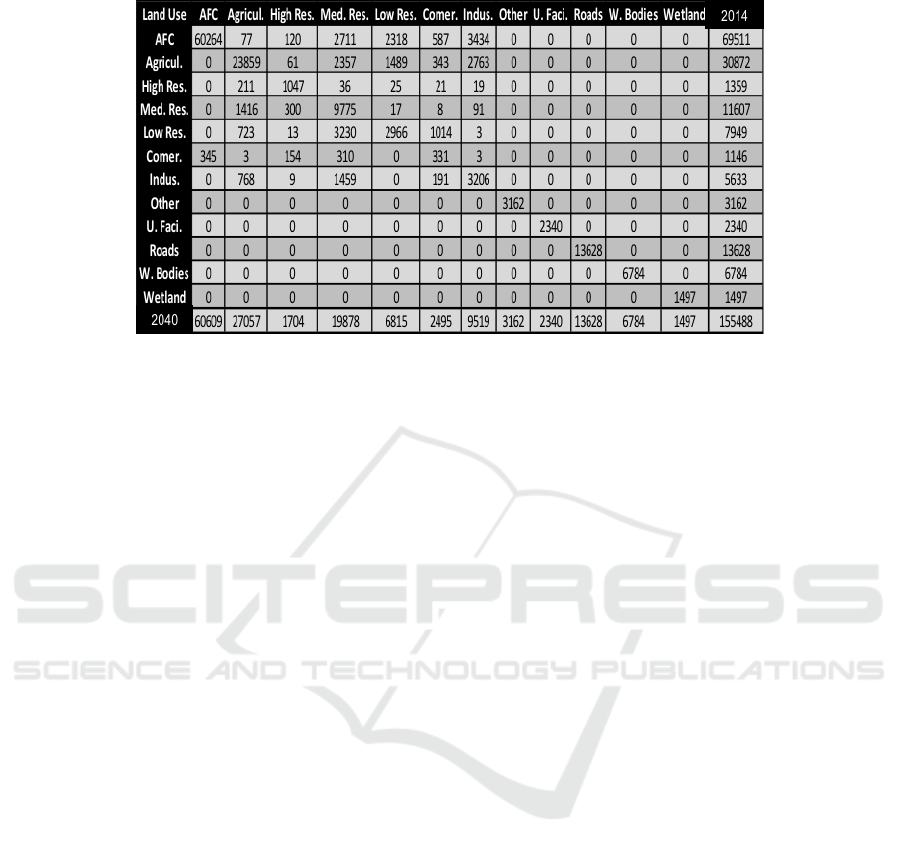
Table 5: Contingency table resulted from cross tabulation of 2014 and 2040 (scenario 1) land-use maps (hectares).
The model results also suggest that the current
trend of conversion of industrial areas, particularly
close to residential middle income, would continue
in the future. In this it is expected that 19 hectares
would be transformed from 2014 to 2040.
It can also be observed a conversion from low
income areas into commercial (total of 1014
hectares). This could be explained by neighboring
relationship between these two land uses in where
commercial is dominant.
4 CONCLUSIONS
This paper has described BoLD, a LUCC model for
the city of Bogota based on two alternative public
transport scenarios. The main objective was to assist
decision-making processes by providing LUCC
information based on scenarios.
A spatially-explicit model that can assist on
decision-making processes has been developed.
Results with four scenarios have shown the
capability of presenting technical results in relation
to positive and negative effects of proposed transport
infrastructure. Additionally, the LUCC model
application allowed the incorporation of land
management policies such as urbanization of green
reserves.
This investigation also developed the ODDS, an
advanced spatial methodology that allows
calculation of ADDF in a technical manner. ODDS
contributes to the improvement of LUCC modeling
as it fills a gap in the literature in where the
influence of accessibility was in many cases
modeled using empirical experiences.
The geospatial analyses ODDS appear to be a
viable option for practitioners when LUCC
simulations are being developed for scenarios based
on transport infrastructure proposals. Additionally,
the circle of mobility graphical representation also
contributes to facilitate decision-making.
Results from different scenarios reflect the
differentiation of a highway and a train-based
scenario in Bogotá. Indicators reflect in the different
circles of mobility that highways promoted the
allocation of residential land-use. The majority of
indicators were based on distance calculations.
Having the VDHR unrestricted allows residential
land-use to allocate there while commercial tend to
occupy low-income residential areas.
Limitations to the study have been highlighted
throughout the text. They can be summarized in two
areas:
We have assumed effects on land-use
changes from a particular transport
infrastructure are isolated to other transport
projects. Although this assumption allows
for a clearer differentiation between
options, possible synergies between
transport alternatives are not considered.
Practitioners should approach LUCC
simulations that only consider transport
changes with caution, as they provide a
narrow view of future scenarios without
clearly considering important aspects such
as changes in land demands.
ACKNOWLEDGEMENTS
This work has been supported by the French
Development Agency – AFD and by the project
BIA201343462-P (Spanish Ministry of Economy
GAMOLCS 2017 - International Workshop on Geomatic Approaches for Modelling Land Change Scenarios
364

and Competitiveness and European Regional
Development Fund FEDER).
REFERENCES
Aljoufie, M. (2014). Toward integrated land use and
transport planning in fast-growing cities: The case of
Jeddah, Saudi Arabia. Habitat International, 41, 205-
215.
DANE. (2011, 2016). Estimaciones de población 1985 -
2005 y proyecciones de población 2005 - 2020.
Bogota.
DANE. (2015). Producto Interno Bruto de Bogotá D.C.
DANE.
El Tiempo. (13 de February de 2016). Las claves para
entender la discusión sobre la reserva Van der
Hammen. El Tiempo.
Escobar, F, Hewitt, R and Hernandez, V, (2015). Usos del
suelo en los parques nacionales españoles. Evolución y
modelado participativo, Proyectos de investigación en
parques nacionales: 2010-2013. Madrid: OAPN, M.
de Agricultura y Medio Ambiente, pp. 175-211
Escobedo, F. J., Clerici, N., Staudhammer, C. L., & Tovar
Corzo, G. (2015). Socio-ecological dynamics and
inequality in Bogotá, Colombia's public urban forests
and their ecosystem services. Urban Forestry &
Urban Greening, 14, 1040 - 1053.
FENALCO. (2014). Comercio: Un sector en expansión y
con potencial de crecimiento. Bogotá: FENALCO.
Furtado, B. A. (2009). Modeling social heterogeneity,
neighborhoods and local influences on urban real
estate prices. Netherlands Geographical Studies 385.
Heinrichs, D., & Bernet, J. S. (2014). Public Transport and
Accessibility in Informal Settlements: Aerial Cable
Cars in Medellín, Colombia. Transportation Research
Procedia, 4, 55-67.
Hewitt, R., Hernández, V., Encinas, M., and Escobar, F.,
(2012), Land use modelling and the role of
stakeholders in natural protected areas: the case of
Doñana, Spain. Int. Congress on EMS. Leipzig.
Hewitt, R., van Delden, H., & Escobar, F. (2014).
Participatory land use modelling, pathways to an
integrated approach. Env. Modelling & Software, 149-
165.
Lombard, M. (2014). Constructing ordinary places: Place-
making in urban informal settlements in México.
Progress in Planning, 94, 1-53.
Mancosu, E., Gago-Silva, A., Barbosa, A., de Bono, A.,
Ivanov, E., Lehmann, A., & Fons, J. (2015). Future
lan-use change scenarios for the Black Sea catchment.
Env., Science & Policy, 46, 26-36.
Pontius,R. and Millones, M. (2011). Death to Kappa: birth
of quantity disagreement and allocation disagreement
for accuracy assessment, Int. J. of Remote Sensing
Vol. 32 , Iss. 15.
Regiotram. (2014). Implantación de un LRT en Bogotá.
Bogotá: Secretaria de Movilidad.
RIKS (2007). METRONAMICA model description.
Maastricht, The Netherlands: RIKS BV.
Straatman, B. (2004). Towards an automatic calibration
procedure for constrained cellular automata. CEUS ,
(Vol. 28/ Issue 1-2), 149-170.
Universidad de los Andes. (2015). Segundo Informe de
Avance. Cooperación AFD, Universidad de Los
Andes y Bogotá D.C. Bogotá.
Van Vliet, J., Hurkens, J., White, R., & van Delden, H.
(2012). An activity based celular automaton model to
simulate land-use dynamics. Environment and
Planning B, 198-212.
Modelling Transport-based Land-use Scenarios in Bogota
365
