
Live Migration for Service Function Chaining
Dongcheng Zhao
1
, Gang Sun
1,2
, Dan Liao
1,3
, Rahat Iqbal
4
and Victor Chang
5
1
Key Lab of Optical Fiber Sensing and Communications (Ministry of Education), UESTC, Chengdu, China
2
Center for Cyber Security, UESTC, Chengdu, China
3
Guangdong Institute of Electronic and Information Engineering, UESTC, Dongguan, China
4
Coventry University, Coventry, U.K.
5
Xi’an Jiaotong Liverpool University, Suzhou, China
Keywords: Network Function Virtualization, Virtual Network Function, Service Function Chaining, Migration, Middle
Boxes.
Abstract: Network Function Virtualization (NFV) has been proposed to solve these challenges of hardware middle
boxes such as high Capital Expenditures (CAPEX) and Operational Expenditures (OPEX). NFV aims to move
packet processing from hardware middle boxes to software middle boxes running on commodity hardware.
In NVF, users or virtual machines (VMs) communicate through the service function chaining. Therefore,
when VMs are migrated, the service function chaining also needs to be migrated. Most research on migration
focus on the issue of VM migration, and at present there is little research on the migration problem of the
service function chaining. Therefore, in this paper we focus on the service function chaining migration, we
will introduce the serial migration strategy and the parallel migration strategy for multiple VMs into the
migration problem of the service function chaining, and propose an improved serial migration strategy for the
service function chaining that is based on the serial migration strategy. We then present the m mixed migration
strategy for the service function chaining that is based on the improved serial migration strategy and the
parallel migration strategy. We conduct detailed simulations to evaluate the performance of the m mixed
migration strategy in terms of the migration time and the downtime. We also develop the M/M/C/C and the
M/M/C queuing models to calculate performance indicators, such as the blocking rate of each migration
request.
1 INTRODUCTION
In the traditional telecommunication networks,
Network Functions (NFs) or middle boxes (such as
firewalls, content filters, proxies, WAN optimizers,
Intrusion Detection Systems (IDSs) and Intrusion
Prevention Systems (IPSs).) are implemented as
some physical proprietary devices and equipment.
However, with users’ requirements for more diverse
and new services continue to increase, service
providers must correspondingly purchase, store and
operate new physical devices to satisfy users’
requirements (Mijumbi, 2016). However, the
purchase of new physical devices will generate high
CAPEX and OPEX (Bari et al 2015; Wu et al 2015;
Bondan et al 2014). These physical devices require
specially trained personnel for deployment and
maintenance.
To solve the above challenges, researchers have
proposed the Network Function Virtualization (NFV)
which aims to move packet processing from hardware
middle boxes to software middle boxes running on
commodity hardware. These network functions
implementing in software middle boxes are called as
Virtual Network Functions (VNFs). In NFV, the
packet processing tasks are performed by software
middle boxes rather than hardware middle boxes, and
multiple VNFs are typically in a particular order
connected to compose the service function chaining
that provide different network services (Gember-
Jacobson et al 2014; Mehraghdam et al 2014). For
example, a communication or traffic between two
virtual machines (VMs) needs pass through the
service function chaining:
VM→Firewall→IDS→Proxy→ VM, is commonly
deployed between two users to enforce security
policies of traffic filtering. Typically, the type and
order of each VNF in the service function chaining is
determined depending on the classification of traffic,
service-level agreement (SLA), and operator’s
provisioning policies, and so on (Xia et al, 2015).
Zhao, D., Sun, G., Liao, D., Iqbal, R. and Chang, V.
Live Migration for Service Function Chaining.
DOI: 10.5220/0006364701490156
In Proceedings of the 2nd International Conference on Internet of Things, Big Data and Security (IoTBDS 2017), pages 149-156
ISBN: 978-989-758-245-5
Copyright © 2017 by SCITEPRESS – Science and Technology Publications, Lda. All rights reserved
149

As an emerging technology, NFV has received
extensive attention from industry, academia, and
standardization bodies. At present, the NFV location
also has become a hot research problem, and there
exist some researches on the NFV location problem
(Li et al 2015; Cohen et al 2015; Kim et al 2015).
Since VMs communicate through the service function
chaining, and therefore the position of the VM will
affect the position of each VNF in the service function
chaining. And because of VM migrations often occur,
so when VMs are migrated, the service function
chaining also needs to be migrated by following these
VMs. In (Li et al 2015; Cohen et al 2015; Kim et al
2015), these proposed methods can solve the NFV
location problem, however, these methods can’t solve
the migration problem of the service function
chaining, and at present there is little research on the
migration problem of the service function chaining.
Researchers have proposed a variety of VM migration
technologies (Tso et al 2013; Shrivastava et al 2011;
Cerroni 2014; Callegati et al 2013) for live migration
of VMs in data center. Although these migration
strategies can solve VM migration problem, they
can’t be directly used for the problem of service
function chaining migration.
Therefore, in this paper, we will introduce the
serial migration strategy and the parallel migration
strategy for multiple VMs that are proposed in
(Cerroni 2014; Callegati et al 2013) into the migration
problem of the service function chaining. And we
study the improved serial migration strategy for the
service function chaining and analyze its performance.
Then we present the m mixed migration strategy for
the service function chaining. This m mixed
migration strategy aims to minimize the total
migration time while satisfying the maximum
downtime constraint that users agreed with the
service providers in the SLAs. In order to evaluate the
blocking ratio, we model the problem by using
M/M/C/C queuing model. We use the M/M/C multi-
server queuing model to evaluate the average waiting
queue length and the average waiting time.
2 STRATEGIES FOR
MIGRATION FOR SERVICE
FUNCTION CHAINING
In this section, we discuss the migration of the service
function chaining in NFV environment. In NFV, each
VNF of the service function chaining is instantiated
by a VM, namely, the VNFs hosted by VMs.
Therefore, when we migrate the service function
chaining, we can treat each VNF of the service
function chaining as a VM for processing, and when
we describe migration for VNF in the following, we
use VM to instead of VNF. In this work, we use the
pre-copy migration mechanism (Callegati and
Cerroni, 2013) to migrate each VNF running on VMs,
the VM memory is migrated iteratively through using
the pre-copy migration mechanism. The VM memory
contains the original memory and the dirty (i.e.,
generated or modified) memory. The original
memory is the memory when starting the VM
migration. The dirty memory is generated or modified
during the iterative transmission process. The
iterative migration process of VM
i
(i =1, 2,…,M) is
described in (Callegati and Cerroni, 2013). We can
calculate the total migration time (denoted as T
i,mig
) of
the i-th VM or VNF as follows.
1
1
,,
1
1
1
i
i
n
n
m
imig i j
i
V
r
TT
R
r
(1)
max
=min{ log ( / ) , }
irthm
nVVn
(2)
Equation (1) shows that the migration time is the
sum of the time of each iteration. Equation (2) gives
the actual number of iterations which denoted as n
i
.
Where T
i,j
is the total time consumed in the j-
th iteration for transmitting the i-th VM’s dirty
memory. We assume that the amount of original
memory of each VNF is V
m
. We use V
th
to denote the
iteration threshold for stopping the iteration and n
max
to present the maximum number of iterations. R is the
transmission rate and r = PD/R is the ratio of the
dirtying rate to the transmission rate, where D and P
are memory page dirtying rate and memory page size,
respectively. Here the memory page dirtying rate is
the rate at which the dirty (or modified) memory page
is generated. The number of VNFs in the service
function chaining is M.
In this paper, we focus on the migration strategy
for the service function chaining. In (Cerroni 2014;
Callegati et al 2013), the authors proposed a serial
migration strategy for migrating multiple VMs.
Similar to (Cerroni 2014; Callegati et al 2013), we
can use a similar strategy to serially migrate each
VNF in the service function chaining. In the serial
migration strategy for the service function chaining,
the M VMs instantiating VNFs are migrated one at a
time, and the actual number of each VM’s iterations
is n(s). Therefore, similar to (Cerroni 2014; Callegati
et al 2013), the serial migration time (denoted as
s
mig
T
) and the downtime (denoted as
s
down
T
) can be
calculated as in Equations (3) and (4), respectively.
IoTBDS 2017 - 2nd International Conference on Internet of Things, Big Data and Security
150

()1
M
,
1
1
1
ns
s
m
mig i mig
i
MV
r
TT
R
r
(3)
()1
()
1
(1)
1
ns
sns
mm
down res
VV
r
TrM T
R
Rr
(4)
Where
max
()=min{log( / ), }
rth m
ns V V n
and
01r
.
The authors in (Cerroni 2014; Callegati et al 2013)
also proposed a strategy for the parallel migration of
multiple VMs. Similarly, we can use a similar
strategy to parallel migrate each VNF in the service
function chaining. In the parallel migration strategy
for the service function chaining, the M VMs
instantiating VNFs are migrated simultaneously, and
the actual number of each VM’s iterations is n(p).
The migration time (denoted as
p
mig
T
) and the
downtime (denoted as
p
down
T
) are formulated as
follows.
()1
M
,
1
1( )
1
np
p
m
mig i mig
i
MV
Mr
TT
R
Mr
(5)
()
()
pnp
m
down res
MV
TMrT
R
(6)
Where the actual number of each VM's iterations is
max
()=min{log ( / ), }
Mr th m
np V V n
, 0 < Mr < 1 is the
ratio of the dirtying rate of memory page to the
transmission rate.
2.1 Improved Serial Migration for
Service Function Chaining
In the serial migration strategy for the service
function chaining, when the first VM stops, the
stopped or migrated VMs loose connection(s) with
each other and hence, the service becomes
unavailable. So when we have stopped one VM, the
other correlated VMs will also be stopped.
Therefore, these stopped VMs do not produce any
new dirty memory during the migration process, and
the VM memory only needs to be migrated one time,
without multiple iterations transmission. Thus, there
is room for shortening the migration time and the
downtime of the service function chaining.
Accordingly, we propose an improved serial
migration strategy of the service function chaining.
In the improved serial migration strategy, we use
the pre-copy scheme to migrate the first VM and use
the post-copy scheme to migrate the rest of the VMs
one by one. The post-copy strategy (Hines et al, 2009)
includes three phases: (i) Stop the source VM and
copy the CPU state to the destination VM; (ii) Restart
the destination VM; and (iii) Copy the VM memory
that will be used. In the post-copy strategy, when the
VM is restarted, the VM memory is empty. If the VM
tries to access a memory page that has not yet been
copied, this memory page needs to be brought from
the source VM. Accordingly, we get the total
migration time
of the i-th VM in the worst case:
,
,2,...,
m
imig
V
TiM
R
. (7)
Equation (7) gives the time for migrating all the
memory of a VM. However, most of the time, many
of the memory pages will not be used, hence we only
need to copy the VM memory that will be used.
Therefore we introduce a correction factor
into
Equation (7), where
is the ratio of the actual
migrated memory to all memory. So
V
m
denotes
the actual amount of memory that needs to be
migrated. And since V
th
is the threshold for stopping
the iterations, so
V
m
is larger than V
th
, namely,
V
m
> V
th
, thus
> V
th
/V
m
. Therefore, we can get V
th
/V
m
<
≤1.
,
, 1, 2,...,
mth
imig
m
VV
TiM
RV
(8)
In the improved serial migration strategy, the first
VM’s actual number of iterations is n(s
1
) and n(s
1
) =
n(s), and the rest M-1 VMs are migrated by using the
post-copy migration scheme, so they do not need
iterative migration. According to the improved serial
migration strategy for the service function chaining
and Equations (1) and (8), we can get the migration
time of the improved serial migration strategy
(denoted as
1
s
mig
T
) as follows.
()1
1
1
+( 1) , 1
1
ns
s
mmth
mig
m
VVV
r
TM
Rr RV
(9)
When the first VM stopped, the other VMs will also
be stopped and the service will be unavailable. Thus,
we can get the downtime of the improved serial
migration strategy (denoted as
1s
down
T
) as in Equation
(10).
1()
+( 1) , 1
sns
mmth
down res
m
VVV
TrM T
RRV
+
(10)
2.2 Comparing Serial, Improved Serial
and Parallel Migration
Similar to (Cerroni 2014; Callegati et al 2013), we
assume that n(s) = log
r
(V
th
/ V
m
) and n(p) = log
Mr
(V
th
/
V
m
). We can compare our improved serial migration
Live Migration for Service Function Chaining
151

strategy with the serial migration strategy as follows.
()1
1
(1)
(1 ) ( )
0
1
ns
ss
m
mig mig
MV
rr
TT
R
r
(11)
where
/1,01
th m
VV r
.We can also get:
()1
1
(1)
(1 ) ( )
0
1
ns
ss
m
down down
MV
rr
TT
Rr
(12)
where
/1,01
th m
VV r
.
From Equations (11) and (12), we can see that the
downtime and the migration time of our improved
serial migration strategy are shorter than that of the
serial migration strategy.
In the following, we compare the migration time
and downtime of improved serial migration strategy
with that of the parallel migration strategy.
1
1( )( ) ( 1)
+( )
(1 )(1 ) 1
0
ps
mig mig
mth m th
m
TT
Mr r V V M V MrV
V
RMrr R Mr
(13)
where,
()( )
1
0
(1 )(1 )
mth
Mr r V V
RMrr
,
1
th
m
V
V
and
01
M
r
when
=1
,
(1)
()
1
mth
m
VMrV
M
V
R
Mr
has
the minimum value.
Since
(1) (1)( )
() 0
11
mth mth
m
M V MrV M Mr V V
V
RMr RMr
, we have:
1
(1)( )
0, 1
ps
th m th
down down
m
MVV V
TT when
RV
(14)
Equations (13) and (14) show that the migration
time of our improved serial migration strategy is
shorter than that of the parallel migration strategy;
and when V
th
/V
m
< a ≤ 1, the downtime of our
improved serial migration strategy is longer than that
of the parallel migration strategy.
2.3 M Mixed Migration of the Service
Function Chaining
Since the migration time affects the performance of
the whole IT infrastructure, the downtime will affect
the quality of experience (QoE) of users. In order to
guarantee the QoE, the service providers have to
negotiate the maximum tolerable downtime of each
migration request with the users. While satisfying the
constraint on maximum tolerable downtime, we
should reduce the migration time as much as possible,
since it has a substantial positive impact on the
performance of the whole IT infrastructure.
For this purpose, we propose a mixed migration
strategy for the service function chaining that is based
on the improved serial migration and parallel
migration strategies. We first use the pre-copy
migration scheme to migrate m VMs in parallel.
When the m VMs have been stopped running, we stop
the rest of the VMs, and then use the post-copy
migration strategy to serially migrate the rest of the
VMs. When all VMs are migrated completely, we
restart all VMs simultaneously. We call such mixed
migration strategy as the m mixed migration strategy
in this work.
Therefore, we can get the migration time
m
mig
T
and
the downtime
m
down
T
of the m mixed migration strategy
as follows, where the actual number of iterations of
each VM is
max
()=min{log( / ), }
mr th m
nm V V n
, 1≤m
≤M and 0 < Mr < 1. Note that, when m =1, the m
mixed migration strategy turns into the improved
serial migration strategy. Similarly when m =M, the
m mixed migration strategy turns into the parallel
migration strategy.
()1
1( )
1
+( ) , 1
nm
m
m
mig
mth
m
mV
mr
T
Rmr
VV
Mm
RV
(15)
()
()
+( ) , 1
mnm
m
down
mth
res
m
mV
Tmr
R
VV
Mm T
RV
+
(16)
From Equations (15) and (16), we can see that the
migration time increases with the growth of m, and
the downtime decreases with the growth of m.
Assuming m
1
< m
2
and n(m) = log
mr
(V
th
/ V
m
), we have:
12
21 1212
12
21 1 2
12
( )(( ) )
(1 )(1 )
()(1)(1)
+
(1 )(1 )
mm
th m
mig mig
m
mmmmmmrrVV
TT
Rmr mr
mm mr mrV
Rmr mr
,
Since
21 1 2
12
()(1)(1)
0
(1 )(1 )
m
mm mr mrV
Rmr mr
, when a=1,
12
mm
mig mig
TT
achieves the maximum value.
12
21 1212
12
( )(( )( )
0
(1 )(1 )
mm
th m
mig mig
mmmmmmrrVrV
TT
Rmr mr
Since
01
M
r
,
1
01mr
and
12 1
0 mmr m
,
hence:
1212 121 2
0mmmmrmmmm
.
IoTBDS 2017 - 2nd International Conference on Internet of Things, Big Data and Security
152

When m =1, the m mixed migration strategy turns
into the improved serial migration strategy; whereas
when m =M, the m mixed migration strategy turns
into the parallel migration strategy. Therefore, when
12
1 mmM
, we have:
12
11
mm
s
Mp
mig mig mig mig mig mig
TTTTTT
. (17)
Similarly,
12
21
()( )
0
mm
mth
down down
mm VV
TT
R
.
Where
V
m
is the VM memory requiring
transmission in the post-copy migration process. So
when
V
m
> V
th
and 1≤m
1
< m
2
≤M, we have:
21
11mmpM s
down down down down down down
TTTTTT
. (18)
From (17) and (18) we can see that the migration
time increases with the growth of m, and the
downtime decreases with the growth of m.
For a given maximum downtime
max
down
T
and
n(m)=log
mr
(V
th
/ V
m
), we can obtain the inverse
solution of m through Equation (16), and m computed
as in Equation (19). Note that, because the downtime
of the m mixed migration strategy decreases with the
growth of m, so when m=1, the downtime of the m
mixed migration strategy achieves the maximum
value; when m=M, the downtime of the m mixed
migration strategy achieves the minimum value. Thus,
the maximum downtime
max
down
T
must fall into [
M
down
T
,
1
down
T
].
max
,1
down res m th
th m m
RT RT MV V
m
VV V
(19)
3 MODELING THE SERVICE
FUNCTION CHAINING
MIGRATION
In this paper, the migration request is the service
function chaining. We assume that these VMs are
migrated by uniformly using bandwidth resources of
each link. Therefore, these migration requests can
share the bandwidth resources of the underlying
network. According to these assumptions, we can
establish two kinds of scheduling models for the
migration request by using the M/M/C/C queuing
model and M/M/C queuing model.
3.1 Migration Blocking Rate
In the M/M/C/C queuing model, there are C service
channels, and the system can accommodate up to C
customers. We assume that the total bandwidth of the
entire underlying network is B, and the
requested bandwidth of each migration request is R.
Thus, the backbone network can simultaneously
provide
services for C requests,
C= /
B
R
. In the
M/M/C/C queuing model, the input stream is a
Poisson process with arrival rate
and service time
is independent and identical exponential distribution.
The requests arrive one by one, and each arrival
request is independent of each other.
The service time
of each request is T, so the service rate of sub channels
is
1/uT
. The service time T is equal to the average
migration time of each request.
1
=
M
m
mmig
m
TT
(20)
Where,
m
is the probability of using the m mixed
strategy for migrating the service function chaining.
When the number of migration requests is C, there
is not enough bandwidth for the next migration
request. When the next migration request arrives, it
will be blocked. Therefore, the scheduling model of
these arrival requests can be modeled as the M/M/C/C
queuing model. According to these above
assumptions, we can calculate the blocking rate as
follows.
1
() 1
!()
1+
!
c
c
i
C
i
T
Bp
cT
i
(21)
3.2 Migration Waiting Time
Since the network provider has reserved resources for
the VNFs before migration, if the migration request is
blocked, the reserved resources will be released. And
the blocked migration request will be resubmitted to
datacenters at a later time. However, the migration
request may be blocked again and thus the SLAs may
be violated, resulting in a penalty to the service
provider. Thus, instead of simply rejecting a request,
service providers may place blocked migration
request in a queue and try to service it later. The
service provider has to pay attention to the waiting
time and ensure that the tolerable waiting time in
SLAs is satisfied to avoid a penalty. Accordingly, we
develop a model based on the M/M/C queuing model
to quantify the waiting time in this subsection.
Live Migration for Service Function Chaining
153
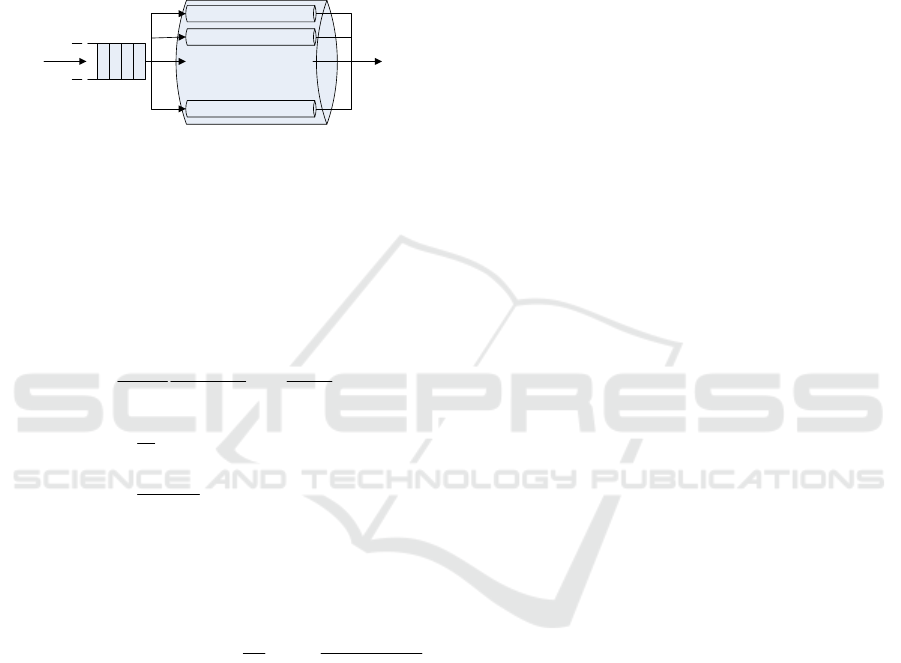
In the M/M/C queuing model, there are C service
channels, and the queue length is unlimited. If there
are n (1≤n≤C) migration requests, then
n
service
channels have to work for serving the n migration
requests. When the number of the migration requests
exceeds C (i.e., n >C), then (n-C) migration requests
will be placed into the waiting queue. An example for
the M/M/C queuing and waiting model is shown in
Figure 1.
Input requests
stream
waiting queue
C parallel subchannels
output re
q
uests
stream
u
u
u
.
.
.
Figure 1: The M/M/C queuing model.
The other assumptions of the M/M/C queuing
model are similar with that of M/M/C/C queuing
model. According to these assumptions mentioned
above, we have the average time of queuing and
waiting as follows.
We have:
1
1
0
0
() 1 ()
!1 / !
Ci
C
i
TT
P
CTC i
,
0
0
1
( ) ,
!
1
( ) ,
!
n
n
n
nC
TP nC
n
P
TPnC
CC
.
The average length of waiting queue is the number
of requests that are waiting for service. Thus, the
average length of waiting queue can be calculated as
in Equation (22).
0
2
1
/
() ()
!
(1 / )
C
qn
nC
P
TC
LnCPT
C
TC
(22)
The average waiting time is the average time
waiting for service before being serviced, and can be
calculated as in Equation (23).
/
qq
WL
(23)
4 NUMERICAL RESULTS
In this section, we numerically compare and analyze
the performance of the serial migration strategy, the
improved serial migration strategy, the parallel
migration strategy and the m mixed migration
strategy of the service function chaining. Similar to
(Kim et al, 2015), we set the values of parameters as
follows:
=1
; M=5; R=1Gbps; B=10Gbps; V
m
=1GB;
P=4KB; D=2500pps; r=0.08; V
th
=0.1GB; n
max
=8;
T
res
=0.1s;
1
mig
T
= 40.64s;
2
mig
T
= 42.74s;
3
mig
T
=46.82s;
4
mig
T
= 53.55s;
5
mig
T
= 64s.
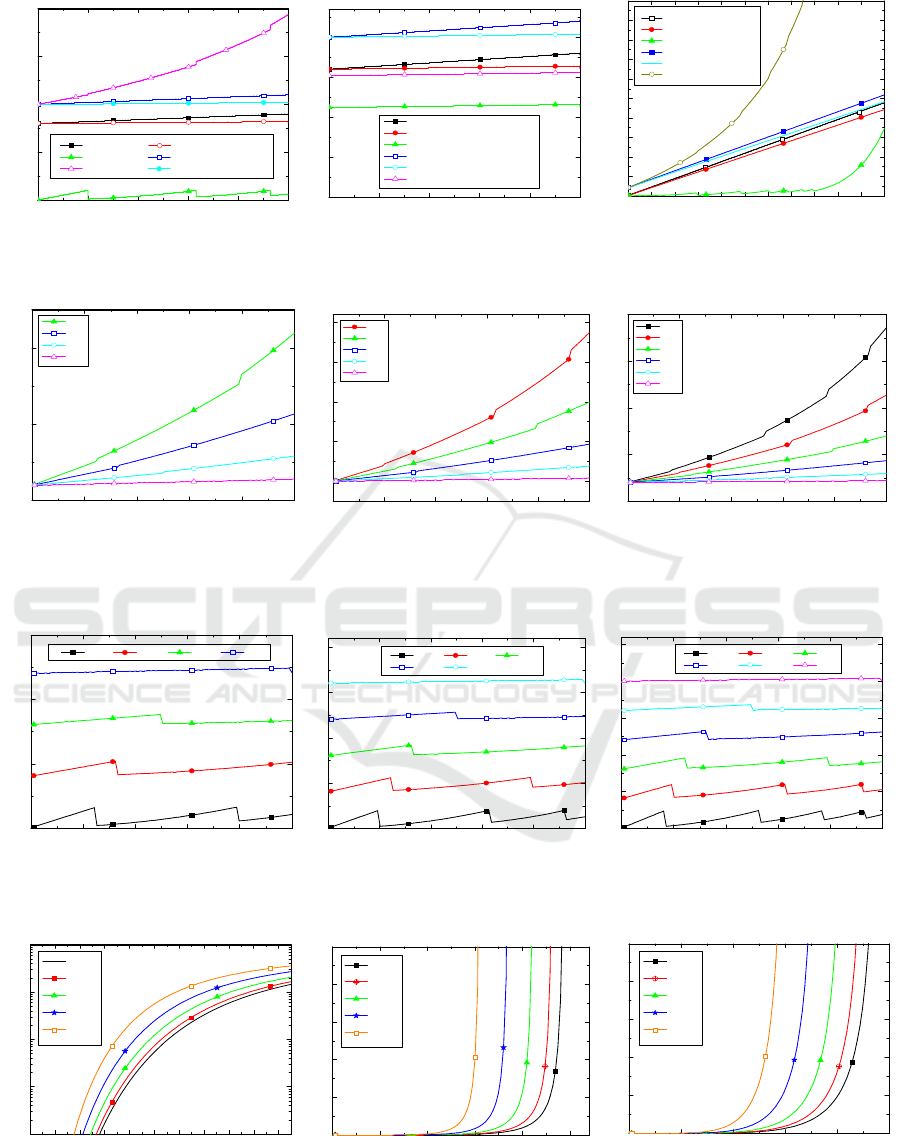
Figure 2 (a), (b) show the migration time and
downtime of the serial migration, the improved serial
migration and the parallel migration strategies as a
function of the ratio of the dirtying rate to the
transmission rate. Fig.2(c) presents the migration
time and the downtime of the three compare strategies,
as a function of the number of VNFs in the service
function chaining (i.e., M). From Fig.2, we can see
that the numerical results and our theoretical analysis
are consistent. The migration time of the serial
migration strategy is shorter than the parallel
migration strategy; and the downtime of the serial
migration strategy is longer than the parallel
migration strategy. When
= 1, the migration time
and the downtime of the improved serial migration
strategy are also shorter than the serial migration
strategy. Whereas when
= 0.7, these advantages of
the improved serial migration strategy are more
notable. The migration time of the improved serial
migration strategy is shorter than that of the parallel
migration strategy, and the downtime of the improved
serial migration is longer than that of the parallel
migration. Therefore, different migration strategy
may be applicable for different performance
requirements. For example, if service providers
consider minimizing downtime as the optimization
objective, then they should use the parallel migration
strategy; if service providers consider minimizing
migration time as the optimization objective, then
they should use the improved serial migration
strategy. Based on the improved serial migration
strategy and the parallel migration strategy, we
propose the m mixed migration strategy, for further
improving the performance.
Figure 3 shows the migration time of the m mixed
migration strategies when M varies from 4 to 6. We
can see that a larger m leads to a longer migration
time. This is because that larger m means more VNFs
need to be parallel migrated and the migration time of
the parallel migration strategies is longer than that of
the improved serial migration strategy. Thus, the
migration time of the m mixed migration strategy
increases with the growth of the value of m. Thus,
service providers who want to reduce the migration
time, should try to lower the ratio of dirtying rate to
transmission rate or choose the m mixed migration
strategy with smaller m.
IoTBDS 2017 - 2nd International Conference on Internet of Things, Big Data and Security
154
0.00 0.02 0.04 0.06 0.08 0.10
0
20
40
60
80
Tdown, serial Tdown, improved serial
Tdown, parallel Tmig, serial
Tmig, parallel Tmig, improved serial
Migration and Down times(Seconds)
Ratio of dirtying rate to transmission rate
0.00 0.02 0.04 0.06 0.08 0.10
0
10
20
30
40
Tdown, serial
Tdown, improved serial(
=1)
Tdown, improved serial(
=0.7)
Tmig, serial
Tmig, improved serial(
=1)
Tmig, improved serial(
=0.7)
Migration and Down times(Seconds)
Ratio of dirtying rate to transmission rate
123456789101112
0
20
40
60
80
100
120
140
160
180
200
Tdown, serial
Tdown, improved serial
Tdown, parallel
Tmig, serial
Tmig, improved serial
Tmig, parallel
Migration and Down times(Seconds)
Number of VNFs
(a) (b) (c)
Figure 2: Comparisons on Migration time and downtime.
0.00 0.02 0.04 0.06 0.08 0.10
30
40
50
m=4
m=3
m=2
m=1
Migration time (Seconds)
Ratio of dirtying to transmission rate
0.00 0.02 0.04 0.06 0.08 0.10
40
50
60
70
80
m=5
m=4
m=3
m=2
m=1
Migration time (Seconds)
Ratio of dirtying to transmission rate
0.00 0.02 0.04 0.06 0.08 0.10
40
60
80
100
120
m=6
m=5
m=4
m=3
m=2
m=1
Migration time (Seconds)
Ratio of dirtying to transmission rate
(a) (b) (c)
Figure 3: Migration time as a function of ratio of dirtying rate to transmission rate for different m mixed migration
strategies.
0.00 0.02 0.04 0.06 0.08 0.10
0
10
20
30
Downtime(Seconds)
Ratio of dirtying rate to transmission rate
m=4 m=3 m=2 m=1
0.00 0.02 0.04 0.06 0.08 0.10
0
10
20
30
40
Downtime(Seconds)
Ratio of dirtying rate to transmission rate
m=5 m=4 m=3
m=2 m=1
0.00 0.02 0.04 0.06 0.08 0.10
0
10
20
30
40
50
Downtime(Seconds)
Ratio of dirtying rate to transmission rate
m=6 m=5 m=4
m=3 m=2 m=1
(a) (b) (c)
Figure 4: Downtime as a function of ratio of dirtying rate to transmission rate for different m mixed migration strategies.
0.00 0.02 0.04 0.06 0.08 0.10 0.12 0.14 0.16 0.18 0.20
10
-4
10
-3
10
-2
10
-1
10
0
T=T
1
mig
T=T
2
mig
T=T
3
mig
T=T
4
mig
T=T
5
mig
Blocking rate
Arrival rate
0.00 0.05 0.10 0.15 0.20 0.25
0
10
20
30
40
50
T=T
1
mig
T=T
2
mig
T=T
3
mig
T=T
4
mig
T=T
5
mig
Average length of waiting queue
Arrival rate
0.00 0.05 0.10 0.15 0.20 0.2
0
10
20
30
40
50
T=T
1
mig
T=T
2
mig
T=T
3
mig
T=T
4
mig
T=T
5
mig
Average waiting time(Secods)
Arrival rate
(a) (b) (c)
Figure 5: Blocking rate, average waiting queue length, average waiting time as functions of arrival rate for different m mixed
migration strategies.
Live Migration for Service Function Chaining
155

Figure 4 demonstrates the downtime of the m
mixed migration strategies under different values of
M. We can see that the downtime of m mixed
migration strategy decreases with the increase in m.
This is because larger m means more VMs need to be
parallel migrated and the downtime of the parallel
migration strategy is shorter than that of the improved
serial migration strategy. Therefore, if service
providers intend to reduce downtime, they should
choose the m mixed migration strategy with larger m.
Figure 5 compares the blocking rate, the average
length of waiting queue and the average waiting time
of each migration request achieved by the m mixed
migration strategy under various scenarios. We note
that since longer average migration time leads to a
longer service time, hence, the blocking rate, the
average length of waiting queue and the average
waiting time all increase with the growth in the value
of T.
5 CONCLUSIONS
In this paper, we study how to live migrate the service
function chain in network function virtualization
environment. We present the efficient strategies for the
problem of service function chaining migration.
Through our proposed methods, the service providers
can efficiently migrate the service function chaining
while lowering the constraints of the migration time
and downtime.
ACKNOWLEDGMENT
This work was partially supported by Natural Science
Foundation of China (61571098), Guangdong Science
and Technology Foundation (2013A040600001,
2013B090200004, 2014B090901007,
2015A040404001, 2013B040300001).
REFERENCES
Mijumbi, R., Serrat, J., Gorricho, J., Bouten, N., Turck, F.,
D., Boutaba, R., 2016. Network Function Virtualization:
State-of-the-art and Research Challenges. IEEE
Communications Surveys & Tutorials, 1(18), 236-262.
Bari, M. F., Chowdhury, S. R., Ahmed, R., Boutaba, R.,
2015. On Orchestrating Virtual Network Functions.
International Conference on Network and Service
Management (CNSM), 50-56.
Wu, J., Zhang, Z., Hong, Y., Wen, Y., 2015. Cloud radio
access network (C-RAN): a primer. IEEE Network,
1(29), 35-41.
Bondan, L., Santos, C., R., P., D., Granville, L., Z., 2014.
Management Requirements for ClickOS-based Network
Function Virtualization. International Conference on
Network and Service Management (CNSM) and
Workshop, 447-450.
Gember-Jacobson, A., Viswanathan, R., Prakash, C., Grandl,
R., Khalid, J., Das, S., Akella, A., 2014. OpenNF:
enabling innovation in network function control. ACM
SIGCOMM, 163-174.
Mehraghdam, S., Keller, M., Karl, H., 2014. Specifying and
Placing Chains of Virtual Network Functions. IEEE 3rd
International Conference on Cloud Networking
(CloudNet), 7-13.
Xia, M., Shirazipour, M., Zhang, Y., Green, H., Takacs, A.,
2015. Optical Service Chaining for Network Function
Virtualization. IEEE Communications Magazine, 4(53),
52-158.
Li, X., Qian, C., 2015. Low-Complexity Multi-Resource
Packet Scheduling for Network Function Virtualization.
IEEE INFOCOM, 1400-1408.
Cohen, R., Lewin-Eytan, L., Naor, J., Raz, D., 2015. Near
Optimal Placement of Virtual Network Functions. IEEE
INFOCOM, 1346-1354.
Kim, T., Kim, S., Lee, K., Park, S., 2015. A QoS
Assured Network Service Chaining Algorithm
in Network Function Virtualization Architecture.
IEEE/ACM International Symposium on Cluster, Cloud
and Grid Computing (CCGrid), 1221-1224.
Tso, F., P., Hamilton, G., Oikonomou, K., Pezaros, D., p.,
2013. Implementing Scalable, Network-Aware Virtual
Machine Migration for Cloud Datacenters. IEEE Sixth
International Conference on Cloud Computing, 557-
564.
Shrivastava, V., Zerfos, P., Lee, K., Jamjoom, H., Liu,
Y., Banerjee, S., 2011. Application-aware virtual
machine migration in datacenters. IEEE INFOCOM, 66-
70.
Cerroni, W., 2014. Multiple Virtual Machine Live Migration
in Federated Cloud Systems. IEEE INFOCOM
Workshop on Cross-Cloud Systems, 25-30.
Callegati, F., Cerroni, W., 2013. Live Migration of
Virtualized Edge Networks: Analytical Modeling and
Performance Evaluation. IEEE Workshop on Software
Defined Networks for Future Networks and Services
(SDN4FNS 2013), 1-6.
Hines, M., R., Deshpande, U., Gopalan, K., 2009. Post-copy
live migration of virtual machines. ACM Operating
Systems Review, 43(3), 14-26.
IoTBDS 2017 - 2nd International Conference on Internet of Things, Big Data and Security
156
