
Internet of Things Architecture for Handling Stream Air Pollution Data
Joschka Kersting
1
, Michaela Geierhos
1
, Hanmin Jung
2
and Taehong Kim
2,∗
1
Heinz Nixdorf Institute, University of Paderborn, F
¨
urstenallee 11, D-33102 Paderborn, Germany
2
Scientific Data Research Center, Korea Institutue of Science and Technology Information, Daejeon, Korea
Keywords:
Wireless Sensor Network, Internet of Things, Stream Data, Air Pollution, DSMS, Real-time Data Processing.
Abstract:
In this paper, we present an IoT architecture which handles stream sensor data of air pollution. Particle
pollution is known as a serious threat to human health. Along with developments in the use of wireless
sensors and the IoT, we propose an architecture that flexibly measures and processes stream data collected in
real-time by movable and low-cost IoT sensors. Thus, it enables a wide-spread network of wireless sensors
that can follow changes in human behavior. Apart from stating reasons for the need of such a development and
its requirements, we provide a conceptual design as well as a technological design of such an architecture. The
technological design consists of Kaa and Apache Storm which can collect air pollution information in real-time
and solve various problems to process data such as missing data and synchronization. This enables us to add a
simulation in which we provide issues that might come up when having our architecture in use. Together with
these issues, we state reasons for choosing specific modules among candidates. Our architecture combines
wireless sensors with the Kaa IoT framework, an Apache Kafka pipeline and an Apache Storm Data Stream
Management System among others. We even provide open-government data sets that are freely available.
1 INTRODUCTION
Air quality receives an increasing amount of atten-
tion. As modern cities worldwide grow, industrial
complexes and cars have become more common. This
development either happens in developing countries
and has changed air quality rapidly. Air pollution has
a significant impact on human health, global environ-
ment and economy. Health hazards caused by air pol-
lution include ischaemic heart diseases, strokes and
lung cancer among others. The public attention in-
creases due to the fatality of the air pollution: One in
eight deaths globally is related to air pollution. This
greatly outnumbers former estimations. Overall, it
is considered to be the largest environmental risk for
human health (WHO, 2014) and the environment it-
self. Damages of the ozone layer and acid rain are
well known examples (Hasenfratz et al., 2012). Apart
from public attention, air pollution is a serious threat
that has to be handled by governments. Its reduction
could decrease the global death rate significantly.
Along with growing cities and economies, there
has been incremental technological progress. Wi-
reless Sensor Networks (WSN) have been put forth
along with the Internet of Things (IoT) (Yi et al.,
∗
Corresponding Author.
2015). In practice, connecting arbitrary things to the
internet was made possible by technological advance-
ments as well as cost reductions. Real-time monito-
ring of air pollution measured by sensor data is pos-
sible through architectural elements of the IoT like
Data Stream Management Systems (DSMS). These
systems enable us to rapidly process streams which
are large, continuous flows of data. To handle the
IoT, DSMS are required. Mobile internet is perva-
sive and enables moving unbound ambient sensors for
spatio-temporal solutions (Miorandi et al., 2012). As
a consequence, it can be seen that modern systems
that collect, produce, analyze and exchange environ-
mental data in real-time are nowadays possible as well
as necessary to cope with disasters and hazards. The-
refore, it has to be investigated what architecture such
a system should have and how this architecture deals
with upcoming issues when processing environmental
sensor data. Measuring air pollution evokes large and
continuously produced amounts of data whereas real-
time processing is necessary. We want to face these
challenges in our work. Therefore, our architecture
is flexible, fast and extensible while being based on
open source technologies. An IoT architecture uni-
fying these characteristics is our main contribution.
The structure of the paper is as follows: Section 2
Kersting, J., Geierhos, M., Jung, H. and Kim, T.
Internet of Things Architecture for Handling Stream Air Pollution Data.
DOI: 10.5220/0006354801170124
In Proceedings of the 2nd International Conference on Internet of Things, Big Data and Security (IoTBDS 2017), pages 117-124
ISBN: 978-989-758-245-5
Copyright © 2017 by SCITEPRESS – Science and Technology Publications, Lda. All rights reserved
117
provides background information about our require-
ments for an IoT architecture. Moreover, we give an
overview of related work in this section. Section 3
introduces our proposed architecture. Section 4 eva-
luates it by taking into consideration dis-/advantages
and possible issues. It is stated how the system and
its parts deal with certain upcoming issues. The dis-
cussion is given in Section 5 before we conclude our
work in Section 6.
2 FOUNDATIONS
Many publications deal with topics that are related to
our work. Most of the literature concerning the IoT
focuses rather on industrial applications than on wi-
reless sensors for measuring air pollution. Besides,
an exact definition of IoT is not possible (Uckelmann
et al., 2011). Some publications capture chemical
processes regarding sensors (Carullo et al., 2007). We
have observed that conventional air monitoring sy-
stems show some drawbacks since they are inflexi-
ble, complex, large and expensive. Even though they
might be of high quality, their rare deployment cau-
sed by the previous stated characteristics makes them
rigid (Yi et al., 2015). Advantageous is that they are
reliable and exact and able to measure a vast num-
ber of different air pollutants. Disadvantageous is the
fact that these characteristics lead to high costs even
in the maintenance and rare deployment. The result
is a low data density and no adaptation to changing
surrounding conditions (Hasenfratz et al., 2012; Ca-
rullo et al., 2007). This aims at a long-term average
model, i.e. at a low spatio-temporal solution, rather
than a rapid and fast monitoring system. Urban activi-
ties, structures and regulations change rapidly and so
do type and concentration of air pollutants (Yi et al.,
2015). Another type of network is required. We pro-
pose such a network in the form of an IoT architecture
in this paper. Using such an IoT architecture, more
time-bound and densely collected information is avai-
lable to everyone. This includes researchers and the
public. People are enabled to change their habits kno-
wing scientific air pollution data, they can avoid visi-
ting certain areas, close their windows and so on. In
the end, knowledge about air pollution can lead to a
change in human behavior (Yi et al., 2015).
From the technical point of view, there are many
new developments that can be used, but along with
them there will be various issues that have to be fa-
ced. One example are the large amounts of data that
must be processed in real-time. A re-thinking of tra-
ditional database management systems (DBMS) was
necessary, as their characteristics do not match real-
time requirements. Data stream management systems
(DSMS) process data streams that are continuous and
unpredictable. Due to the great amount of informa-
tion, not every bit of data is important. Sensors as we
use them provide a motivation for the development
of such systems (Babcock et al., 2002; Carney et al.,
2002). We want to make use of the technology which
exists nowadays to develop a system that can be de-
ployed anywhere. This system is able to help humans
flexibly, they can know about threats and can react to
them.
Having briefly shown the background, we will
state basic requirements for our architecture. Using
these requirements, we have designed our solution.
As an inspiration, we used some literature that pro-
vides three categories. Firstly, there are limitations
of sensors, i.e. the resources like processing, battery
and bandwidth capacity are restricted. This genera-
tes several issues like a changing number of sensors.
This can relate to the total number of sensors, to the
number of sensors online and to the number of sen-
sors sending data a-/synchronously. Secondly, strea-
ming data require certain architectural elements that
have been described. This comes from continuous
data streams that are pushed into a query system. The
connection may be interrupted. This leads to a break
up in data streams that may be sent later, thus there
have to be processed more data at once. Thirdly, pro-
cessing multiple queries has to be possible (Madden
and Franklin, 2002). To solve this, we use a distribu-
ted system that can perform queries in parallel.
Additionally, we explicitly state that our sensors
have to be movable and thus able to be placed every-
where, at least close to urban areas. We then state the
fact that products of different manufacturers may be
in use. The number of sensors might change rapidly
due to issues. The infrastructure of our architecture
has to be easy to use, understand and, ideally, main-
tain. Here is support from a community favorable.
In the next section, our architecture is shown and ex-
plained in two steps (i.e. on a conceptual and on a
technological level).
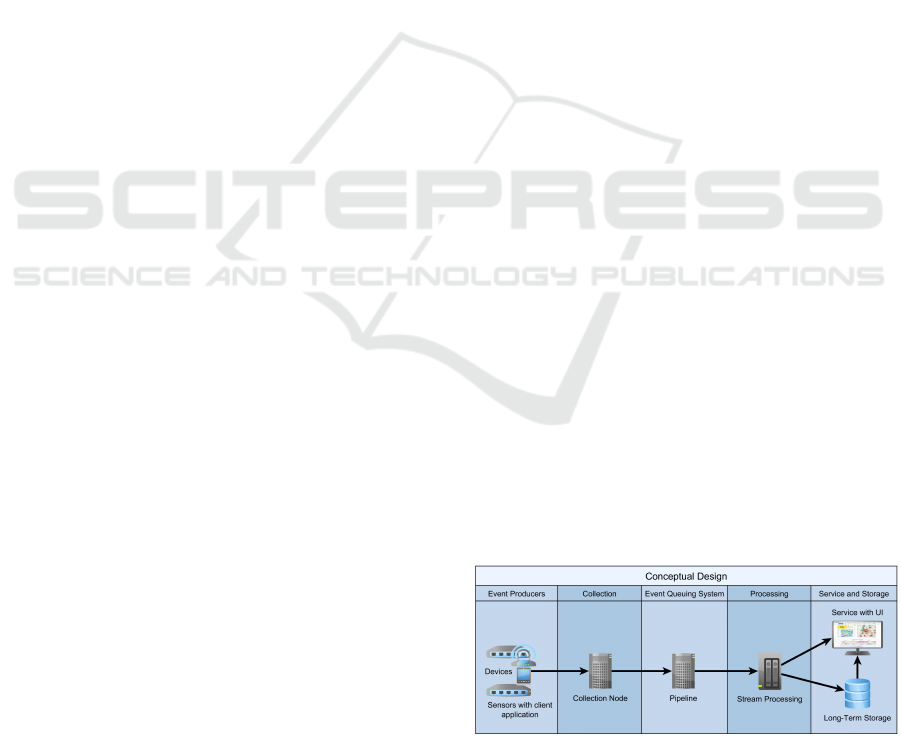
Figure 1: Conceptual Design of the Sensor Architecture.
IoTBDS 2017 - 2nd International Conference on Internet of Things, Big Data and Security
118
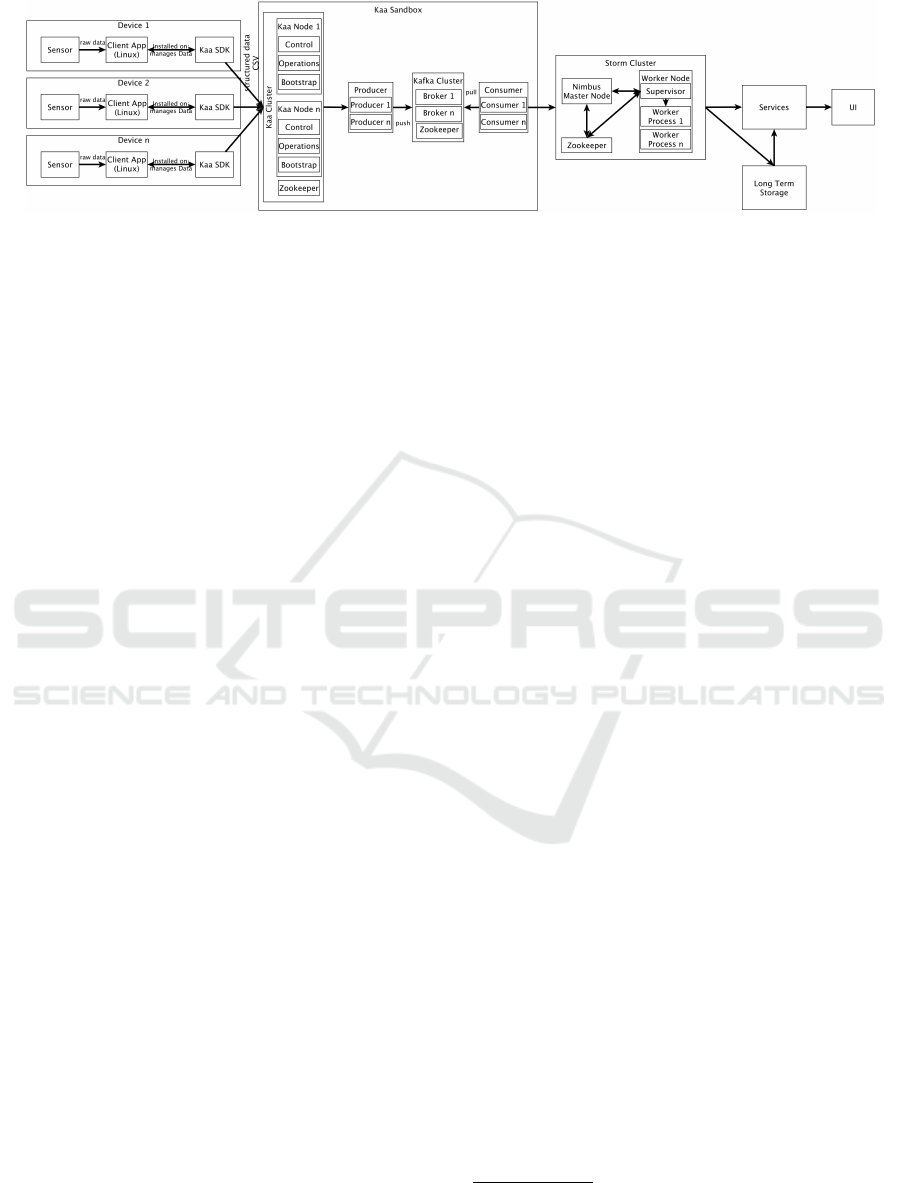
Figure 2: Technological Level of the Sensor Architecture.
3 PROPOSED ARCHITECTURE
Our architecture is presented in two figures. Fi-
gure 1 describes the conceptual aspect and Figure 2
the technological issues.
3.1 Conceptual Design
Our concept in Figure 1 consists of five steps. We do
not include certain modules at this point, as we firstly
designed a general idea of our required architecture.
Step 1 includes the event producers which may be
sensors with corresponding technology. This covers
client applications like a personal computer with soft-
ware for connecting the collection node. This way, we
can use as many different sensors as desired. Moreo-
ver, we can change or interchange sensors, problems
caused by limited resources are not harmful to the
whole system. Additionally, our sensors are movable.
In the next step, there are incoming data collected. A
collection node manages to receive all data and hands
them over to the event queuing system. The collection
node enables us to provide infrastructure that can re-
ceive all incoming data. In the third step, there is the
pipeline that in fact handles the data. This step mana-
ges the data, even if there are asynchronous and large
amounts. This step consists of a parallel system. Step
four is important because prior steps prepared it. Step
four processes the data streams. Using a parallel sy-
stem gives us the possibility to proceed multiple que-
ries at once. We even can handle large amounts of
data that arrive rapidly. In step five, we see service
and storage applications. We do not further include
these points in our work as well as the operating sy-
stem of the first step. As service application, it can
have a user interface (UI) and any (long-term) storage
which is applicable to data streams.
3.2 Technological Design
After having presented background and requirements
as well as our concept, we will introduce a detailed ar-
chitecture which is the main contribution of our work.
Figure 2 shows the technological level with the pro-
posed modules.
The architecture can be divided into four steps. In
comparison to our concept, the collection and event
queuing system are in one step. At first, there are
devices 1,2...n. These contain a sensor, a client ap-
plication which is the operating system, i.e. a Linux
distribution and Kaa SDK. Kaa
2
is an open source
middleware platform for the IoT. The sensor measu-
res particle pollution and sends raw data to Kaa SDK
which is installed on the client application. Kaa SDK
manages data and converts it to a desired format like
CSV. It transfers data to the Kaa cluster inside the Kaa
sandbox. The sandbox is one possibility to use Kaa.
In our case, we see it as one system where the parts
shown in Figure 2 are installed. Storm and other parts
may be run somewhere else.
In the Kaa cluster, there are different Kaa nodes
that receive the data from the Kaa SDK. The nodes are
governed by Apache ZooKeeper
3
. Including ZooK-
eeper is intended by Kaa, because it enables distribu-
ted coordination. The nodes consist of three parts.
The first is the controller which manages the over-
all data of the system. The second is the operator
which handles multiple requests from different clients
and takes care of endpoint registration, updates, etc.
The bootstrap services direct endpoints to operations
services. Kaa endpoints, i.e. SDKs, have lists of
bootstrap services belonging to the actual implemen-
tation. Every part can be configured or aborted by the
user. Kaa is fault-tolerant and scalable (CyberVision,
2016a). We chose Kaa because of these characteris-
tics as well as the open source-nature and connecti-
vity.
The next step is the set-up of the pipeline for
which we use Apache Kafka
4
. Kafka is able to cre-
ate a real-time streaming pipeline that manages and
2
https://www.kaaproject.org/
3
https://zookeeper.apache.org/
4
https://kafka.apache.org/
Internet of Things Architecture for Handling Stream Air Pollution Data
119

moves data between applications (Apache Software
Foundation, 2016b). Kaa supports Kafka as one pos-
sible log appender which takes data to use it in their
service (CyberVision, 2016b). In our IoT context, we
need Kafka to deal with incoming data that may be
asynchronous. The pipeline takes even large amounts
and handles them while guaranteeing at least once se-
mantics. Kafka is run on one or more servers as a
cluster, is therefore parallel and stores the data as so-
called streams of records in topics. These topics serve
as categories (Apache Software Foundation, 2016b).
As in Figure 2 described, Kafka consists of three
main parts in our application. The producers 1,...n re-
ceives data from the Kaa cluster which are pushed to
the brokers in the Kafka cluster. It pushes the data
as fast as the brokers can handle them. There are
usually several brokers for maintaining load balance.
One broker can handle large data amounts which can
be several hundred thousand read- and write-actions
per second. ZooKeeper coordinates the brokers and
informs producers and consumers about new brokers
or failures of one of them. Kafka brokers are stateless.
Consumers can also use other applications to process
the stream of records pulled from the Kafka cluster.
The third step is the Apache Storm
5
cluster. The
decision for choosing Storm was made the same way
as for choosing Kafka, we compared characteristics of
different possible systems. Storm enables us to pro-
cess unbounded streams of data with at least once se-
mantics. Storm consists of nodes and processes data
in tuples. The nimbus is a master node, all other no-
des are workers. The master distributes data to all
workers, assigns tasks to workers and controls for fai-
lures of nodes. Supervisors receive their tasks from
the nimbus. It has multiple processes and manages
them to complete the tasks. ZooKeeper monitors the
working node statuses and coordinates between no-
des. It maintains the supervisor and nimbus by taking
care of their states.
The last step will be a long-term storage, several
services like search services on the data and a UI.
There will be different possibilities which are not part
of our work as we mainly focus on the architecture
and how it collects and processes data. Saving or pre-
senting services is not considered.
As it can be seen, our requirements have been sa-
tisfied. We have a fault-tolerant distributed, open and
easy-to understand system that, due to these charac-
teristics, should be easy to maintain. Our architecture
enables us to use wireless and movable sensors of any
manufacturer. The number of sensors can change any
time and the amount of data being processed can be
handled flexible and in real-time. We have included
5
https://storm.apache.org/
parallel working elements like a DSMS. Processing
data and queries can be done in parallel. It can be used
with many other technologies, modules and langua-
ges. Due to its fault-tolerance, the system can handle
different issues that may be caused by restricted re-
sources and so on.
4 SIMULATION
To test our architecture, we simulated what happens
to data that would be sent through our system until
they leave the Storm cluster. Here, we identified four
categories of possible issues that might come up. We
then dealt with those issues by providing solutions.
These solutions are the way our architecture handles
issues. We used this to compare our used modules
to other possible modules instead of Apache Storm,
Kafka, etc.
The categories are data, hardware, synchrony and
software issues as well as miscellaneous issues.
Before presenting further information, we want
to emphasize that understanding our issues is easier
when having a look at the data of the United States
Environmental Protection Agency (US-EPA), which
we used. Data of mainly traditional systems are freely
available on the web. The US-EPA
6
provides a vast
number of data for downloading as well as several
German cities
78
or pages providing overviews
9
. They
mostly provide data of PM10 or PM2.5 particulate
matters in microgram per cubic meter (µg/m
3
). The
city of Stuttgart provides values from 1987-today and
even delivers measurements for O2, O3, rainfall and
so on. As of 2017, the German government plans to
generally publish weather data of the Deutsche Wetter
Dienst (DWD)
10
. The data we found usually come in
the Comma Separated Value-format (CSV). For our
architecture, we focused on the US-EPA data as they
focus on particulate matter and deliver side informa-
tion like the GPS position. This enabled us to pretend
these data are from a WSN as we designed it. An ex-
ample of the data we used can be found in Table 1
11
.
6
http://aqsdr1.epa.gov/aqsweb/aqstmp/airdata/
download files.html#Blanks
7
http://www.stadtklima-
stuttgart.de/index.php?klima messdaten download
8
http://umweltdaten.nuernberg.de/aussenluft/stadt-
nuernberg/messstation-am-flugfeld/feinstaub-
pm10/bereich/30-Tages-Ansicht.html Accessed 2017-1-3
9
http://aqicn.org/map/world/
10
https://www.bmvi.de/SharedDocs/DE/
Pressemitteilungen/2017/006-dobrindt-dwd-gesetz.html
11
We shortened the Information where necessary. For
more please see the original data mentioned.
IoTBDS 2017 - 2nd International Conference on Internet of Things, Big Data and Security
120
Table 1: Sample Data of US-EPA.
State Country Site Parameter Code POC
1 73 23 81102 4
Lat. Long. Datum Parameter Name Date Local
33.553.056 -86.815 WGS84 PM10 Total 0-10um STP 01.01.16
Time Local D.GMT T.GMT Sample Unit
00:00:00 01.01.16 00:06:00 7 Micrograms/cubic meter (25 C)
MDL Uncertainty Qualif. Method Type Method Code
4 FEM 150
State Country Last Change Method Name
Alabama Jefferson 08.02.16 T A Series FH 62 C14...
4.1 Data Issues
Data issues deal with errors or problems that must
be treated by our system. They can appear in various
ways.
To enable the reader to better understand data is-
sues, we provide an example of such issues. i.e.
a single or various measurements could have failed
which results in sending data with information like
time stamps and so on, but without information in
the fields for measurement values. Thus, there might
be no value for PM10 in µg/m
3
particles in a data
set which anyhow has its time and date stamp like
this: “22.03.2016”, “01:37:30”, “ ”, “PM10”, “micro-
grams/qm”. The empty field usually should contain
values for PM10, a possible number can be 16 µg/m
3
.
This would not be harmful as we are dealing with stre-
aming data. Apache Storm, which is part of our sy-
stem, uses approximation as not every bit (tuple) of
data is important in a data stream. Approximation
technologies are i.e windowing, where only a speci-
fied amount or time window of data are viewed. Anot-
her possibility of approximation is averaging. Apache
Spark
12
, does not use real stream processing as it tries
to emulate stream processing by using micro-batching
(Apache Software Foundation, 2016c). Due to this,
even the module of Apache Spark and Apache Spark
Streaming, has a medium latency compared to storm,
which has a very low latency. A very low latency is
required by our architecture. There are even some is-
sues which cannot be solved by our architecture as
they even cannot be recognized manually. i.e. if, for
some reason, comparable values are interchanged, the
sample measurement values of PM10 which can be 10
and 4. This cannot be recognized as neither a human
being nor the system can know what the original me-
asurement value was (data set A: 10; data set B: 4;
after permutation: data set A: 4; data set B: 10). The
same can happen to interchanged string data such as
12
https://spark.apache.org/
“Method Name”, because it would not be easy to find
out if a field in first hand had the information of the
first or second role in Table 2 inside. It could be po-
sitive if we have other sources than our data that tell
us what should be the textual content, i.e. people who
know the configuration of the system that has been set
in Kaa.
Table 2: Interchanging Issue Sample for “Method Name”.
Method Name
INSTRUMENTAL-R&P SA246B-INLET -
TEOM-GRAVIMETRIC
INSTRUMENT MET ONE 4 MODELS -
BETA ATTENUATION
Other cases can be the assignment of GPS positions to
places on the map. Single places do not tell us much
about the actual state of the air quality. Possibly, all
sensors being on vehicles can be stuck in the traffic
and might not move for a longer time. All data come
from the same places which might be the streets or,
due to smog, garages, parking lots etc. It would be
good to in forehand assign all possible GPS positions
to fields on the map. i.e of the size of 1 km
2
. We
will describe this in more detail in the miscellaneous
issues.
One issue can be if data cross a threshold: 188
PM10 micrograms/m instead of 34-154 (min-max).
There could be an alarm included in Apache Storm
that warns. If this is only a few times, it will not be
important or caused by hardware issues. Storm uses
approximation, so single data are not so important and
do not cause great problems, as they are i.e averaged.
This is a typical characteristic of a DSMS. If a value
does not cross a threshold but is too far away from the
average, the same solution would be able to be app-
lied. Example: 100 PM10 micrograms/m even though
the averaged/approx. value is 66.
Internet of Things Architecture for Handling Stream Air Pollution Data
121

4.2 Hardware Issues
Hardware issues can be sensors that are out of order.
Of course, only human beings can replace sensors and
our system must deal with missing data sets. As we
are handling streams of data, Apache Storm uses ap-
proximation which even takes care of missing data,
i.e by averaging values. It will not matter if a certain
number of sensors does not work or send data as this
is considered by the design of data stream manage-
ment systems and our architecture.
Another possibility to avoid such issues would be
duplication. The sensor density could be increased
though the costs would increase, too.
4.3 Synchrony and Software Issues
Synchrony issues deal with problems that occur be-
cause data are not sent in the usual manner. There
may be a high amount of data coming in in a very
short time. This can happen due to different reasons
like connection problems that are being handled by
Kaa automatically (CyberVision, 2016a). Even the
breakup of nodes of Kaa, Storm or modules of Kafka
are not a problem, as these modules handle such
issues automatically (software issues) (CyberVision,
2016a; Apache Software Foundation, 2016d; Apache
Software Foundation, 2016b). The asynchrony can be
handled by Kafka which is designed to deal with in-
coming messages queues. It is a message queuing sy-
stem itself that takes care of the incoming streams in
the producer. Even Storm has possibilities to take care
of too large data sets by using approximation techno-
logies like averaging of values. It is okay to take the
average of 20 data sets which all tell us something of
a PM10 measurement value between 15 and 23. Apa-
che Kafka is favorable even though Flume
13
delivers
good performance for the same issues. Flume is said
to only being a log data processing service whereas
Kafka could, if necessary, provide more functionality
like out-of-order processing or streaming. Those two
systems can even be combined to benefit from the ad-
vantages of both. Data are pushed to its destination in
Flume, it is mainly built for Hadoop
14
and its ecosy-
stem and it does not guarantee at least once processing
of data. Kafka has a more general purpose and it can
process more data at the same time (parallel). Proces-
sing hundreds of thousands of messages per second
per broker, of which it has multiple ones, is possible
with Kafka but not Flume. Kafka pulls data from its
cluster (brokers) to its consumers, so consumers can
13
https://flume.apache.org/
14
https://hadoop.apache.org/
manage their incoming data. This provides the pos-
sibility to deliver data to different data stores or pro-
cessing systems in a parallel way. It has a higher con-
nectivity to other systems and a higher availability of
events because in case of failures, they are recovered
(Apache Software Foundation, 2016b; Apache Soft-
ware Foundation, 2016a).
4.4 Miscellaneous Issues
Miscellaneous issues deal with other things that can
have effects on our architecture. Efficiency is one of
the things which can be put in this category. As we
are using sensors of different manufacturers (compa-
nies), they might provide different information to our
system. This might not be efficient because some of
them can be useless or already doubled. For exam-
ple, if we have the longitude/latitude data 41273612/
-105604167, we would not need the additional infor-
mation provided by the sensor that it is in the state
of Wyoming in the County of Albany. That would
only cost processing resources. It is the same with the
local time and GMT, the GPS coordinates tell us the
time zone, one time stamp is sufficient. Apache Storm
can use data reduction to cut such useless information.
Another point is that we might have too many data. It
would not tell us more if we have 5,000 data sets con-
taining comparably similar values for PM10. Apache
Storm can solve this by using one of its approxima-
tion technologies, again. It will be more efficient to
display or store an approximated value than saving all
the single values. Averages will be okay for our use
case. Another efficiency issue deals again with the
GPS information. As we already know, the sensors
move and therefore change their GPS position possi-
bly every second. We would not get more information
if we collect all the exact GPS positions, rough posi-
tions will be enough. Therefore, we design fields on
the map were GPS positions can be assigned to. This
will be a function that must be implemented manu-
ally in the System, i.e in Storm by using Java. Other
modules of our architecture could do so, too. It is not
explicitly included in our design, yet.
Table 3: GPS Assignment Issue Example.
Latitude Longitude Field
33565278 -86796389 D5
Following Table 3, latitude/longitude 33565278/
-86796389 can be assigned to a square on the map
that may cover 1 km
2
(square “D5”).
Breakups in the processing system do not cause
problems, storm provides at least once semantics, so
IoTBDS 2017 - 2nd International Conference on Internet of Things, Big Data and Security
122
every tuple is processed. Exactly-once semantics is
implementable, too. Out-of-order processing of data
can even be done by Storm automatically whereas
Spark and Spark Streaming cannot compete. A bre-
akup in the handling system Kaa is even not a pro-
blem. Kaa guarantees data processing, breakups are
handled; data are transferred anyway. The same will
happen if the network connection is lost. Kaa takes
care of that and processes the data, but it could lead
to asynchrony which can be seen in the category Sy-
nchrony Issues. The system can be scaled up, scaling
up does not cause problems. If it does, those breakups
will be handled by Kaa and Storm as stated above.
As shown above, we have defined four categories
of issues which can occur when dealing with an ar-
chitecture that handles IoT sensor data. We delivered
examples of issues and how they can be handled au-
tomatically. Some of them may not be solved by an
automatic system as sensors cannot be exchanged or
repaired without manual assistance. These things will
be addressed in the limitations of our work. Because
of that, we will not explain them here again.
5 DISCUSSION
Our work shows different benefits. We proposed a
flexible, modular and open architecture that can face
the challenges described in the introduction. As we
use open source technology, this architecture can be
used anywhere by anyone without license costs, even
in developing countries where environmental pro-
tection is not an issue yet. User groups can benefit
from a strong community which exits for all modules
we used, especially for Apache products.
A limitation is that the test system implementa-
tion is in progress. It might evolve that there is not
Kaa sandbox needed or one should consider if a long-
term storage is necessary. We had to use data from
conventional sensor networks like those provided by
US-EPA. Due to the nature of a publication, we were
not able to describe all aspects, characteristics and be-
nefits of our architecture. It is a limitation that we use
a system with modules that provide at least once se-
mantics. There are various ways to implement exactly
once semantics.
Unsolved questions come up as we do not know
whether we get instructions by policy makers. We
might will have to use a specific type of sensors or the
requirements can change. As we have shown, our ar-
chitecture if flexible and modular, so we can adapt to
new circumstances quickly. Another topic that might
be investigated in the future are the services that might
be used, a UI which is appropriate and which long
term storage is required in a specific case.
6 CONCLUSION
The main idea of this paper is to design a flexible
and open IoT architecture for measuring air pollution.
This architecture is designed to do measurements in
urban areas and to react to changing conditions. Our
architecture enables its users to use it at a high scala-
ble, low cost and high performance level in real-time
manner the way they need it. We herewith contribute
a first step for improving human health by getting to
know and letting people know about health threats.
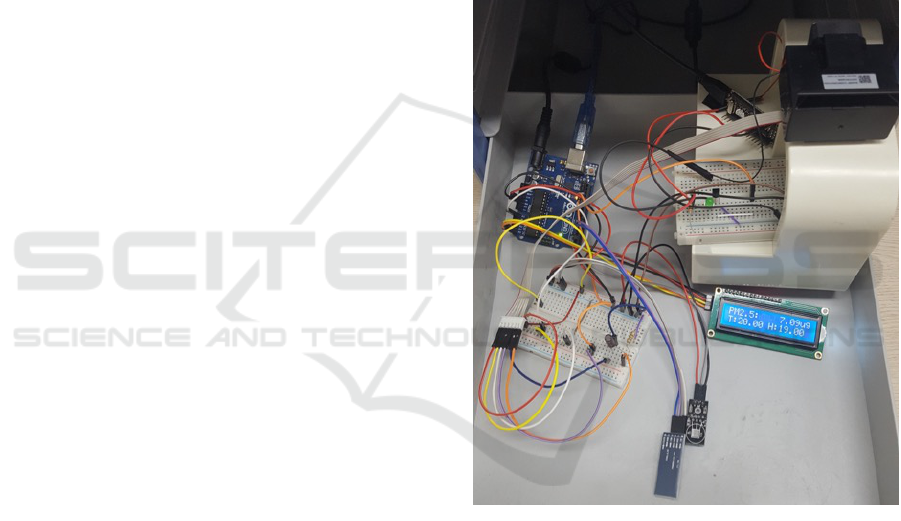
Figure 3: Prototype of an Air Pollution Monitoring Sensor.
As we have shown, there are many issues that might
come up. We have addressed these issues during our
design. In the future, the architecture can be tested
in practice systems to show which questions come
up. In order to test the proposed architecture through
real data, we made a prototype of a mobile sensor
as shown in Figure 3. The sensor in Figure 3 will
be used to monitor the high-level air pollution status
while being mounted on a vehicle. It measures fine
dusts and gasses (such as COx, NOx, and VOCs).
As mentioned before, we proposed a theoretical
design and therefore see it as an advantage to possi-
bly include further developments of the modules we
have used. Here, we take advantage of the commu-
nity open source systems are based on. Our work is a
Internet of Things Architecture for Handling Stream Air Pollution Data
123

contribution as well. Further research can be based on
data sets that might be developed after first tests with
WSN in our context.
ACKNOWLEDGMENTS
This work was partly supported by the Korea Insti-
tute of Science and Technology Information [K-17-
L03, Building Scientific Big Data Sharing and Con-
vergence System]. We thank our coworker Frederik
Simon B
¨
aumer for his support.
REFERENCES
Apache Software Foundation (2016a).
Flume 1.7.0 user guide.
https://flume.apache.org/FlumeUserGuide.html.
Accessed 2017-1-1.
Apache Software Foundation (2016b). Kafka 0.10.1 docu-
mentation. https://kafka.apache.org/documentation/.
Accessed 2016-11-24.
Apache Software Foundation (2016c). Spark 2.1.0 do-
cumentation. https://spark.apache.org/docs/latest/.
Accessed 2017-1-3.
Apache Software Foundation (2016d).
Storm 0.10.2 documentation.
https://storm.apache.org/releases/0.10.2/index.html.
Accessed 2016-11-24.
Babcock, B., Babu, S., Datar, M., Motwani, R., and Widom,
J. (2002). Models and issues in data stream systems.
In Proceedings of the 21st ACM Symposium on Prin-
ciples of Database Systems, pages 1–16. ACM.
Carney, D., C¸ etintemel, U., Cherniack, M., Convey, C., Lee,
S., Seidman, G., Stonebraker, M., Tatbul, N., and Zdo-
nik, S. (2002). Monitoring streams: A new class of
data management applications. In Proceedings of the
28th international conference on Very Large Data Ba-
ses, pages 215–226. VLDB Endowment.
Carullo, A., Corbellini, S., and Grassini, S. (2007). A
remotely controlled calibrator for chemical pollutant
measuring-units. IEEE Transactions on Instrumenta-
tion and Measurement, 56(4):1212–1218.
CyberVision (2016a). Design reference – kaa.
http://docs.kaaproject.org/display/KAA/
Design+reference. Accessed 2017-11-30.
CyberVision (2016b). Kafka log appender – kaa.
http://docs.kaaproject.org/display/KAA/
Kafka+log+appender. Accessed 2016-11-23.
Hasenfratz, D., Saukh, O., Sturzenegger, S., and Thiele, L.
(2012). Participatory air pollution monitoring using
smartphones. Mobile Sensing, pages 1–5.
Madden, S. and Franklin, M. J. (2002). Fjording the
stream: An architecture for queries over streaming
sensor data. In Proceedings 18th International Confe-
rence on Data Engineering, pages 555–566. IEEE.
Miorandi, D., Sicari, S., De Pellegrini, F., and Chlamtac,
I. (2012). Internet of things: Vision, applications and
research challenges. Ad Hoc Networks, 10(7):1497–
1516.
Uckelmann, D., Harrison, M., and Michahelles, F. (2011).
An Architectural Approach Towards the Future Inter-
net of Things, pages 1–24. Springer, Berlin, Heidel-
berg.
WHO (2014). 7 million premature de-
aths annually linked to air pollution.
http://www.who.int/mediacentre/news/releases/2014/air-
pollution/en/. Accessed 2016-11-25.
Yi, W. Y., Lo, K. M., Mak, T., Leung, K. S., Leung, Y., and
Meng, M. L. (2015). A survey of wireless sensor net-
work based air pollution monitoring systems. Sensors,
15(12):31392–31427.
IoTBDS 2017 - 2nd International Conference on Internet of Things, Big Data and Security
124
