
The ADAS SWOT Analysis
A Strategy for Reducing Costs and Increasing Quality in ADAS Testing
Andreas Haja, Carsten Koch and Lars Klitzke
Faculty of Technology, Hochschule Emden/Leer, University of Applied Sciences, Emden, Germany
Keywords: Testing, Validation, ADAS, Advanced Driver Assistance Systems, Autonomous Vehicles, Test Strategy,
SWOT, Design of Experiments, Sensors, Automotive.
Abstract: In a remarkably short time, advanced driver assistance systems (ADAS) have become a major driver of
innovation in the auto industry: It is expected that autonomous vehicles will profoundly change the very
definition of mobility. In addition to mastering technical challenges, increasing automation requires a
significant amount of testing and thus a huge investment in test resources. This poses a serious cost factor for
existing companies and a high entry barrier for new market entrants. In addition, strong demand for engineers
worldwide also makes it difficult to allocate sufficient manpower. Consequently, tests are often performed by
teams with limited experience and high staff turnover. To reduce test duration while ensuring high levels of
quality and a focus on the most relevant aspects, this paper presents a new method for creating efficient test
strategies which builds on the well-known SWOT analysis and extends its use to ADAS-related scenarios.
The ADAS SWOT analysis provides a structured process which facilitates the identification of risks and
opportunities associated with new technology and assesses its impact on ADAS products from a customer
perspective. The method has been tailored to fit the needs of research and advance development and helps
increase both product quality and time-to-market.
1 INTRODUCTION
Automakers and suppliers are currently competing
fiercely to be among the first to launch a fully
autonomous driving solution into the market. In
addition to solving technical challenges, the high
amount of testing required for such systems poses a
significant cost factor for existing players and a high
entry barrier for newcomers to the ADAS segment.
This paper proposes a method for reducing cost and
increasing quality of testing, especially in corporate
research and in advance development teams.
A typical ADAS development chain consists of
the stages research, advance development and series
development. Each stage is associated with different
test efforts that accompany the engineering tasks.
One of the main tasks of the research stage is the
identification of new technology components and the
assessment of their potential for creating novel
customer functionality. The focus in this stage is on
constructing and showcasing a working prototype
while the effort invested into testing is often limited.
During advance development, the prototype is
tested thoroughly under a multitude of conditions,
including adverse scenarios such as heavy weather
and complex traffic situations. Also, the potential for
cost-savings is investigated, e.g. by replacing costly
sensors or computationally expensive algorithms.
The focus in this stage is on verifying the industrial
feasibility in terms of cost, package and robustness.
With development progressing towards series
production, test efforts increase exponentially. It is
therefore important to identify the major threats to a
new product as well as its potential opportunities at
an early development stage. To achieve this goal, a
unified test strategy is required which stretches along
the entire development chain and which helps the
engineers to decide on whether to move on to the next
stage or to freeze or even abandon a project.
In practice, ADAS test design is often based on
expert knowledge and on engineering intuition.
Although practical in many situations, this approach
presumes the existence of seasoned experts on the
team who can leverage their extensive knowledge to
devise solid test cases. If experts are not available
320
Haja, A., Koch, C. and Klitzke, L.
The ADAS SWOT Analysis - A Strategy for Reducing Costs and Increasing Quality in ADAS Testing.
DOI: 10.5220/0006354103200325
In Proceedings of the 3rd International Conference on Vehicle Technology and Intelligent Transport Systems (VEHITS 2017), pages 320-325
ISBN: 978-989-758-242-4
Copyright © 2017 by SCITEPRESS – Science and Technology Publications, Lda. All rights reserved
however, test design becomes a challenging task,
especially for newly assembled teams. In such cases,
a structured and easily applicable process is required
which helps the team to develop a test strategy that
fits the demands of the development project, such as
the construction of a new ADAS prototype.
An overview of current approaches to ADAS
testing has been presented in (Stellet et al., 2015). The
majority of publications contains proposals for either
performance metrics (Smith, 2011 and Fritsch, 2013)
or for testing a specific sensor or function (Fabris,
2014). However, to the best knowledge of the authors,
a generic and structured method for ADAS test
strategy development has not yet been published.
The method proposed in this paper builds on the
well-known SWOT
1
analysis, which is often used for
assessing the pros and cons of complex decisions. The
SWOT analysis helps companies and institutions to
benefit from market opportunities and to deflect risks
by leveraging internal strengths and by compensating
known weaknesses. In its original form, strengths (S)
and weaknesses (W) look at internal factors of a
product or business venture, such as unique features,
or financial indicators, whereas opportunities (O) and
threats (T) look at external factors such as
competitors, new technology or market trends.
Within the ADAS space, the SWOT analysis has
been previously mentioned in several publications
such as in (Blythe, 2002) or in (Diakaki, 2015).
However, none of these publications addresses the
topics of ADAS development or testing.
To meet the requirements of the individual stages
of the development chain, a modified version of the
original SWOT analysis is presented in this paper. In
the proposed ADAS SWOT analysis, the internal
perspective (strengths and weaknesses) is directed to
focus on the technological properties of a specific
component (e.g. a sensor) whereas the external
perspective (opportunities and threats) looks at the
entire system from a product-oriented viewpoint.
The ADAS SWOT analysis is intended to help
OEMs or Tier-1s to benefit from new technology
components that become available and to deflect risks
that might arise from the use of these components.
The new method can be applied in two scenarios
common in both research and advance development:
1. Assess whether a new ADAS product should be
developed using a specific technological setup.
2. Decide whether a component within an ADAS
product should be replaced by an alternative.
1
Strengths, Weaknesses, Opportunities and Threats
Throughout this paper, the second scenario is used
to illustrate the new method. However, ADAS SWOT
can be applied to the first scenario in a similar way.
This paper is structured as follows: In Section 2,
the ADAS SWOT analysis is introduced. In Section
3, the method is applied to a well-known scenario to
illustrate the benefits. In Section 4, major findings are
summarized and an outlook on future work is given.
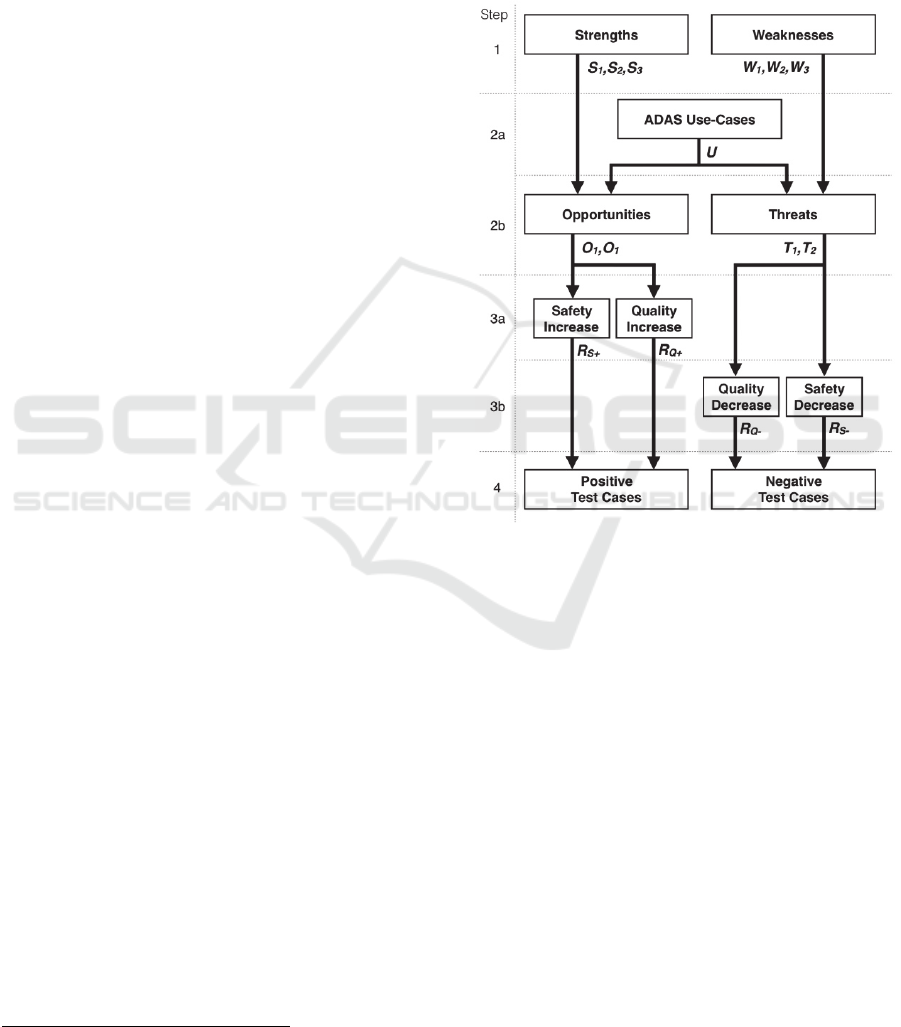
Figure 1: Stages of the ADAS SWOT analysis.
2 THE ADAS SWOT ANALYSIS
The proposed ADAS SWOT analysis consists of four
consecutive steps (see Figure 1):
1. Assess technology component: Identify major
strengths and weaknesses of a new component.
2. Assess ADAS product: Identify opportunities
and threats which show the impact of strengths
and weaknesses from (1) on the ADAS product.
3. Rank and prioritize: Rank and prioritize the
findings from (2) regarding safety and quality.
4. Test-case definition: Define a set of tests to
verify whether the findings from (3) exhibit the
predicted quality and safety increase or decrease.
The tests in (4) will support the decision on whether
to select the new component for the ADAS product.
The ADAS SWOT Analysis - A Strategy for Reducing Costs and Increasing Quality in ADAS Testing
321

2.1 Technology Assessment
In the first step of the ADAS SWOT analysis, only
strengths and weaknesses of the new component are
discussed without addressing the ADAS product in
which the component is to be integrated yet.
The aim of the assessment is to reliably identify
all major advantages and technology highlights as
well as disadvantages and potentially hazardous
properties from an engineering perspective.
The analysis is conducted by the development
team. To improve results, an expert with prior
experience with similar technology and its use in an
automotive environment should support the team.
Questions to be answered are:
Strengths (S)
S1. What are the major assets of the new component?
S2. What makes the new component better than
alternative solutions?
S3. Under which conditions does the new component
perform well?
Weaknesses (W)
W1. What are the major areas of concern with the new
component?
W2. In which areas do alternatives perform better?
W3. Under which conditions does the new component
perform poorly?
The result of the first step (see
Figure 1, step 1) is
a list of answers to the strength-related (S
1
, S
2
,S
3
) and
to the weakness-related questions (W
1
, W
2
, W
3
).
2.2 Product Assessment
In the second step of the ADAS SWOT analysis, the
team focus is directed towards the ADAS product. In
addition to the engineering perspective from the
previous step, a product-centric view ensures that the
team focusses on the implications of technological
strengths and weaknesses for the customer with
regard to safety and quality.
In step 2a of
Figure 1, the team should call upon
the support of the ADAS functional manager and of
the product management to compile a list of use-cases
U, which reflect the expected behavior of the ADAS
product in scenarios with high customer-relevance.
In step 2b of
Figure 1, the team must discuss the
implications of all strengths and weaknesses from
step 1 for each use-case from step 2a. Improvements
2
Failure Mode and Effects Analysis
to or expansions of the existing features of the ADAS
product are termed opportunities in this context
whereas feature degradations are termed threats.
Questions to be answered for each use-case are:
Opportunities (O)
O1. How does the new component improve quality?
O2. How does the new component expand features?
Threats (T)
T1. How does the new component degrade quality?
T2. How does the new component reduce features?
All answers must relate to the strengths in S
1
, S
2
and S
3
and to the weaknesses in W
1
, W
2
and W
3
as well
as to specific use-cases in U.
The result of the second step (see
Figure 1, step 2)
is a list of answers to both the opportunity-related
(O
1
,O
2
) and the threat-related questions (T
1
, T
2
).
2.3 Use-Case Ranking
In the third step of the ADAS SWOT analysis, a
ranking scheme is applied to all opportunities and
threats which assesses the impact of the new
component on both safety and quality for each use-
case by attributing individual safety and quality
measures. The goal is to determine the use-case
relevance for the test-case definition in Section 2.4.
The measures are divided into four categories:
Safety Decrease: Rates how a degraded use-case
reduces occupant or road user safety.
Safety Increase: Rates how an improved use-
case increases occupant or road user safety.
Quality Decrease: Rates how a degraded or
removed use-case negatively affects customers.
Quality Increase: Rates how an improved or
expanded use-case positively affects customers.
Safety decrease assessment in Section 3a is
similar to a FMEA
2
. For all threats and the associated
use-cases, the following parameters are evaluated :
Probability of exposure P
E,S-
: How probable is it
that the vehicle within its life time will be
exposed to a situation where the safety decrease
might lead to an accident?
(1 : very unlikely — 5 : very likely)
Severity S : How severe would be the
consequences of an accident for occupants and/or
road users?
VEHITS 2017 - 3rd International Conference on Vehicle Technology and Intelligent Transport Systems
322

(1 : negligible — 5 : severe injuries / death)
Detectability D : Can the system detect an
increased probability for threat occurrence?
(1 : very likely — 5 : very unlikely)
The ranking for each threat and its associated use-
case
-
with regard to safety decrease is computed as:
,
⋅⋅
(1)
Although the definition of each parameter differs, the
method of computation for safety increase (Section
3a), quality increase and quality decrease (Section 3b)
is identical:
Probability of exposure
o Safety increase (P
E,S+
): How probable is it
that the vehicle within its life time will be
exposed to a situation where the safety
increase might avoid an accident?
o Quality increase (P
E,Q+
) / decrease (P
E,Q-
):
How probable is it that the quality increase /
decrease will be experienced daily?
(1 : very unlikely — 5 : very likely)
Impact
o Safety increase (I
S+
): How significant is the
positive impact of the safety increase on
occupant and/or road user safety?
o Quality increase (I
Q+
) / decrease (I
Q-
): How
significant is the impact of the quality
increase / decrease on customer satisfaction?
(1 : negligible — 5 : profound impact)
Probability of exposure and impact are computed as:
,
⋅
(2)
,
⋅
(3)
,
⋅
(4)
Note that opportunities or threats may result in
different rankings if the use-case is changed.
The result of the third step (see
Figure 1, step 3) is
a list of threats and opportunities ranked according to
the impact on safety and quality. The ranking is the
basis for the test-case prioritization in the next step.
2.4 Test-Case Definition
In the fourth and final step of the ADAS SWOT
analysis, a set of test cases is defined. All tests will be
designed to verify the strengths and weaknesses
identified in Section 2.1 during the technology
assessment. By propagating the test results through
the ADAS SWOT analysis, the validity of the
opportunities and threats and thus the influence of the
new component on the ADAS product is verified.
Categories to define each test scenario (based on
the use-cases selected in the second step) are:
Expectation: Expected behaviour of the new
component leading to an opportunity or threat.
Test setup: Behaviour of prototype vehicle and
other test participants (e.g. lead car)
Test parameters: Variables to change between
scenarios to assess their influence on test results.
Performance assessment: Measurable criterion
for the assessment of test performance.
In practice, categories will often differ depending
on the system being tested and on the test context. For
example, a description of categories for emergency
braking can be found in (EUNCAP, 2015).
By linking technical properties with product
features, a meaningful and focussed test set is created
with the potential to reduce test efforts significantly.
Also, the ranking scheme applied in the previous
section ensures that the most relevant test cases are
executed first. This allows for a firm decision on the
new component in an early stage in case of a
confirmed hazardous threat or if an expected
significant opportunity did not manifest.
3 ADAS SWOT EXAMPLE
In this section, the ADAS SWOT analysis is used to
assert whether a mono camera sensor could be a
replacement for a radar sensor in an adaptive cruise
control system (ACC). This question has already been
discussed extensively such as in (Stein et al., 2003),
(Dagan, 2004) or (Ingle, 2016).
From a commercial perspective, the use of a
camera instead of a radar sensor offers the potential
to reduce the price of ACC and thus increase the
number of car models in which it may be integrated.
Also, additional customer value can be created by
using the camera for lane or traffic sign detection.
This section demonstrates the ADAS SWOT
principles and has been shortened for brevity.
3.1 Technology Assessment
In the first step, the goal is to identify strengths and
weaknesses of the camera. Answers to questions S
1-3
and W
1-3
from Section 2.1 are shown in Table 1.
The ADAS SWOT Analysis - A Strategy for Reducing Costs and Increasing Quality in ADAS Testing
323
Table 1: Assessment of strengths and weaknesses.
Step 1: Camera technology assessment
Strengths
S
1
Assets of the camera sensor?
S
11
S
12
S
13
S
14
lateral information on vehicles
Major advantages over radar?
large opening angle
detects lane markings, speed signs,etc.
can measure road surface structure
S
2
Conditions with increased performance?
S
21
daylight and cloudy sky
Weaknesses
W
1
Drawbacks of the camera sensor?
W
11
W
12
W
13
reduced performance with low contrast and
overexposure
Major disadvantages compared to radar?
short detection range
low range accuracy
W
2
Conditions with decreased performance?
W
21
W
22
W
23
dusk, darkness
heavy weather (snow, rain, fog, dust)
direct sunlight
Table 2: Assessment of use-cases, opportunities, threats.
Step 2: ACC product assessment
1 ACC cruising
Opportunities
O
11
: adapt to speed signs and road quality (S
13
, S
14
)
Threats
T
11
: reduced max. speed (W
12,
W
21
, W
22
)
2 Target following
Opportunities
O
21
: reduced FP/FN on curvy roads (S
13
)
Threats
T
21
: jittery distance control (W
12
, W
13
)
T
22
: inadvertent acceleration (W
21
,W
22,
W
23
)
3 Cutting vehicles
Opportunities
O
31
: fast reaction to cutting vehicles (S
11
, S
12
)
Table 3: Safety (R
S+
) and quality increase (R
Q+
) for
opportunities.
Step 3a: Opportunity ranking
P
E
I R
S+
R
Q+
Prio
O
11
4 3 12 3
O
21
5 2 10 4
O
31
5 4 20 1
Table 4: Safety (R
S-
) and quality decrease (R
Q-
) for threats.
Step 3b: Threat ranking
P
E
S D I R
S-
R
Q-
Prio
T
11
5 3 15 3
T
21
4 3 12 4
T
22
4 4 4 64 1
Table 5: Test scenarios based on opportunities and threats.
Step 4: Test scenarios
Negative test scenarios (excerpt)
ID Pri Test description
T
22
1
Expectation:
Loss of lead car track (false negative)
results in inadvertent acceleration
Test setup:
Prototype follows lead car on highway
Test parameters:
following distance (near – far)
ambient light (day, dusk, night)
weather (sun, cloudy, rain, fog)
Performance assessment:
lead car track stability
Positive test scenarios (excerpt)
ID Pri Description
O
31
1
Expectations:
Wider opening angle enables early
detection of vehicles cutting into
prototype lane
Test setup:
Vehicle from neighbouring lane cuts
into prototype lane on highway
Test parameters:
Lead car distance (near – far)
ambient light (day, dusk, night)
weather (sun, cloudy, rain, fog)
Performance assessment:
time until stable track of lead car
VEHITS 2017 - 3rd International Conference on Vehicle Technology and Intelligent Transport Systems
324

4 SUMMARY AND OUTLOOK
In this paper, a novel method for designing efficient
tests for ADAS and autonomous vehicles has been
proposed. The main advantage of the method is the
inherent consistency of the test strategy which
progresses from the technological properties of a
system component towards its implications for the
final ADAS product from a customer perspective.
The method has been designed to meet the needs
of newly assembled teams which must achieve high-
quality test results in a limited amount of time.
Using a well-known example from recent ADAS
history, the replacement of a radar sensor with a mono
camera for ACC has been chosen as an example to
illustrate the use of the ADAS SWOT analysis.
In future work, the following issues will be
addressed to further optimize and improve the testing
process:
Apply ADAS SWOT to new sensor technologies
(e.g. solid-state LiDAR, stereo camera).
Expand ADAS SWOT to meet the needs of
autonomous vehicle development.
Further reduce the required amount of expert
knowledge by partially automating the testing
process (e.g. by defining test criteria and
environmental parameters based on ontologies).
REFERENCES
J.E. Stellet, M.R. Zofka, J. Schumacher, T. Schamm,
F. Niewels and J.M. Zöllner. Testing of Advanced
Driver Assistance Towards Automated Driving: A
Survey and Taxonomy on Existing Approaches and
Open Questions, IEEE 18th International Conference
on Intelligent Transportation Systems, 2015.
K. Smith, R. Schweiger, W. Ritter, and J.-E. Kallhammer,
Development and evaluation of a performance metric
for image-based driver assistance systems, IEEE
Intelligent Vehicles Symposium , 2011.
J. Fritsch, T. Kuhnl, and A. Geiger, A new performance
measure and evaluation benchmark for road detection
algorithms, 16th International IEEE Conference on
Intelligent Transportation Systems, 2013.
S. Fabris, J. D. Miller, and J. Luo, Validation of an AEB
system, 3rd International Symposium on Road Vehicles
Functional Safety Standards and Its Application, 2014.
P.T. Blythe, Can ITS Satisfy the Demands of the UK
Integrated Transport White Paper and Subsequent 10
Year Transport Plan: A SWOT Analysis. Proceedings of
the 9th World Congress on Intelligent Transportation
Systems, 2002.
C. Diakaki, M. Papageorgiou, I. Papamichail and I.
Nikolos, Overview and Analysis of Vehicle Automation
and Communication Systems from a Motorway Traffic
Management Perspective, Transportation Research Part
A: Policy and Practice, Volume 75, 2015.
G. P. Stein, O. Mano and A. Shashua, Vision-based ACC
with a single camera: bounds on range and range rate
accuracy, IEEE Intelligent Vehicles Symposium, 2003.
E. Dagan, O. Mano, G. P. Stein and A. Shashua, Forward
collision warning with a single camera, IEEE
Intelligent Vehicles Symposium, 2004, pp. 37-42.
S. Ingle, M. Phute, Tesla Autopilot : Semi Autonomous
Driving, an Uptick for Future Autonomy, International
Research Journal of Engineering and Technology,
Volume 3, Issue 9, 2016.
EUNCAP (European New Car Assessment Programme),
Test protocol - AEB systems, EuroNCAP, Test Protocol
1.1, June 2015.
S. Geyer, M. Baltzer, B. Franz and S. Hakuli, Concept
and.development of a unified ontology for generating
test and use-case catalogues for assisted and automated
vehicle guidance,” Intelligent Transport Systems, IET,
vol. 8, no. 3, pp. 183–189, 2014.
The ADAS SWOT Analysis - A Strategy for Reducing Costs and Increasing Quality in ADAS Testing
325
