
Modelling Urban Thermal Comfort: Evaluating the Impact of the
Urban Requalification Project of Praça Duque De Saldanha and
Avenida Da República in Lisbon
Teresa Santos
1
, Caio Silva
2
and José António Tenedório
1
1
Interdisciplinary Centre of Social Sciences (CICS.NOVA), Faculty of Social Sciences and Humanities (FCSH/NOVA),
Lisbon, Portugal
2
Faculdade de Arquitetura e Urbanismo, Universidade de Brasília, Brasília, Brasil
Keywords: Thermal Comfort, ENVI-met, Urban Planning, Lisbon.
Abstract: In dense urban areas, reducing traffic and increasing green areas is foreseen as a way of promoting urban
comfort. Using the urban requalification project for Lisbon’s Avenidas Novas neighbourhood as a case
study, the effects of vegetation on microclimate and urban comfort are evaluated. In this context, the ENVI-
met software is used to model the present and the future urban scenario. The simulation results indicate: i)
increased urban comfort in the morning and in the afternoon resulting from the decrease in temperature due
to the presence of new green areas foreseen by the urban project; ii) a reduction of up to 3 degrees in the
morning (9h) and up to 3 degrees in the afternoon (15h); iii) the model implemented in ENVI-met suits the
urban and environmental characteristics of Lisbon and it is, therefore, desirable that future urban
rehabilitation projects should consider ex ante simulation of this type.
1 INTRODUCTION
The development of urban systems, in a context of
climate change, requires adaption actions to mitigate
emissions and increase public welfare. Local
authorities are required to develop and implement
strategies and actions to meet locally-adjusted
sustainable development goals and targets, in
alignment with existing planning frameworks and
development priorities. In this context, urban
interventions seeking to increase green areas are the
key actions of the transformation of the city.
Consequently, urban green space policy is
increasingly being used as a tool to enhance urban
resilience and sustainability (Collier et al., 2013).
Still, effective management for sustainable
development requires reliable as well as evidence-
based information on the potential effect of local
programmes. In this context, geographical
information based analysis can produce suitable data
for understanding and monitoring the environmental
effects of policy and program initiatives.
In 2016, the Lisbon City Hall has initiated the
requalification of several public spaces within the
city. One of these spaces is located in the central
area and foresees the substitution of traffic roads by
new pedestrian zones and green areas. The goal is to
provide the citizens with less noise, more spaces for
walk, comfortable sidewalks, and lowered
crosswalks for people with reduced mobility, more
green areas, places for esplanades and bike lanes.
The increasing heat stress in cities represents a
challenge for sustainable urban design (Lee et al.,
2016). Promoting new green areas is a way of
mitigating the Urban Heat Island (UHI) effect, since
lower temperatures tend to occur in these places,
than in sealed surfaces. In fact, vegetation
contributes to the modification of urban climate by
providing shading, evapotranspiration and
channelling wind, either as a windbreak or as a wind
funnel (Rosheidat et al., 2008).
Assessing the fine-scale thermal variation due to
such changes in land cover within an urban
environment is a way of quantifying the mitigation
impact of green-space planning.
Ali-Toudert and Mayer (2007) used ENVI-met
3.0 to analyse the effect of vegetation on thermal
comfort in urban street canyons located in Algerian
Sahara. Using a selection of case studies including
rows of trees with various crown densities and two
70
Santos, T., Silva, C. and Tenedório, J.
Modelling Urban Thermal Comfort: Evaluating the Impact of the Urban Requalification Project of Praça Duque De Saldanha and Avenida Da República in Lisbon.
DOI: 10.5220/0006324500700080
In Proceedings of the 3rd International Conference on Geographical Information Systems Theory, Applications and Management (GISTAM 2017), pages 70-80
ISBN: 978-989-758-252-3
Copyright © 2017 by SCITEPRESS – Science and Technology Publications, Lda. All rights reserved
wind incidences, parallel and perpendicular, the
presence of vegetation along the canyons was found
to affect the air temperature considerably. Air
temperature in planted canyons was up to 1.5 ºC
lower in comparison with unplanted streets with the
same aspect ratio.
Oliveira et al., (2011) quantified the cooling
effect of a small green space in the surrounding
atmospheric environment of a densely urbanised
area located in Lisbon, using local measures. The
highest difference found was of 6.9 ºC in relation to
the air temperature between shaded areas inside the
garden and sunny areas located on the nearby street.
Ng et al., (2012) studied the cooling effects of
greening in Hong Kong, using ENVI-met. They
concluded that in highly density cities, a cooling
effect of about 1 ºC is possible when tree coverage is
larger than 1/3 of the total urban area.
Lehmann et al., (2014) analysed the micro-
climate effect of urban vegetation structures in
Dresden, Germany. The cooling effects ranged from
1 ºC to 2.1 ºC, according to the greenery provision.
Ketterer and Matzarakis (2014) studied the
influence of green scenarios over the Physiologically
Equivalent Temperature (PET), a thermal index
based on the energy balance of the human body.
PET, simulated by ENVI-met 3.5, was found to be
around 10 ºC lower under trees compared with that
over green areas and at least 25 ºC lower than that
over sealed areas.
Locaro and Acero (2015) made a comparative
analysis of green actions to improve outdoor thermal
comfort inside urban street canyons, in Bilbao,
Spain. The evaluation was performed in three typical
urban street canyons characterized by different
geometric proportions and five urban greenery
scenarios in typical summer day conditions. Using
ENVI-met v4.0, the greenery scenarios were
analysed and results quantitatively confirm that the
vegetation elements such as grass, green roofs and
trees, improve the thermal comfort at pedestrian
level. Furthermore, the highest PET reduction of
10 °C occurred by combining the presence of trees
and grass.
Lee et al., (2016) tested the contribution of trees
and grasslands to the mitigation of human heat stress
in a residential district located in Southwest
Germany. Using the ENVI-met model v.4, they
concluded that trees are more effective in mitigating
human heat stress than just grasslands.
The aim of this work is to evaluate the effect of
replacing traffic roads by new trees and green areas
as far as in the thermal comfort of the surrounding
urban area are concerned.
The ENVI-met model was used in this study to
simulate urban microclimate under two conditions:
before and after site requalification.
2 STUDY AREA AND DATA BASE
Lisbon city occupies an area of 84 km
2
and has
547733 inhabitants, according to the latest census
(2011). The municipality is pursuing a strategy of
urban regeneration by promoting the rehabilitation
of vacant buildings and the qualitative improvement
of public spaces, in particular enhancing green
spaces and their connectivity.
2.1 Praça Duque De Saldanha and
Avenida Da República Project
One measure to face local urban climate challenges
is to requalify typical neighbourhoods and squares.
From a total of 150 squares, 30 were identified by
the City Hall as priority within the framework of the
program “A Square in Each Neighbourhood”. From
this set, and in order to test the impact of the
proposed layouts, the project of Praça Duque de
Saldanha and Avenida da República, was selected.
Due to software’s limitation regarding the area to be
simulated; only a part of the project will be
evaluated (Figures 1 and 2).
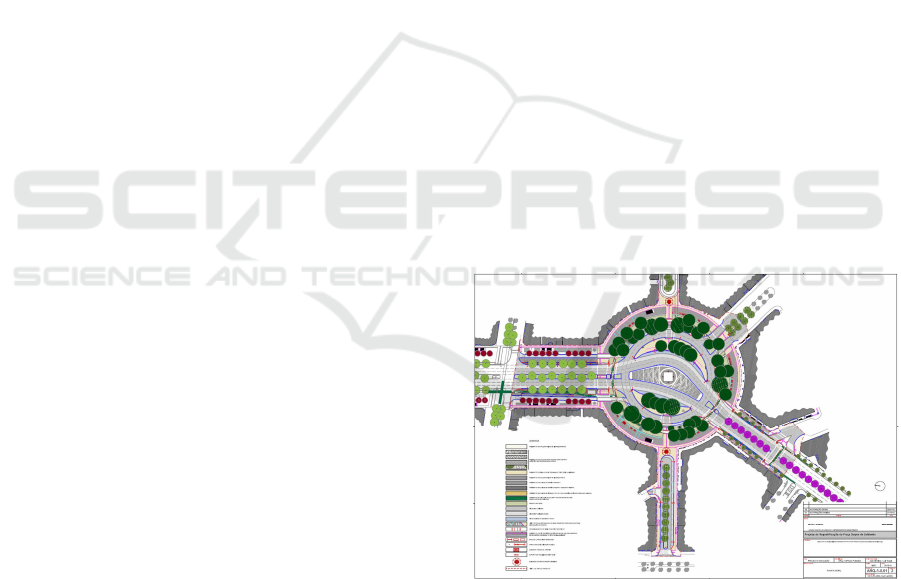
Figure 1: Praça Duque de Saldanha Project.
Several problems were identified and motivated
urban intervention: 1) the discontinuity of tree
alignments; 2) the use of the avenue as an express
road which generates speed and insecurity in zebra
crossings, sometimes resulting in fatal hitches; 3) the
avenue’s road channel space, with 60 m wide,
presents an irregular profile along its’ axis, mainly
as a result of the successive interventions it was
Modelling Urban Thermal Comfort: Evaluating the Impact of the Urban Requalification Project of Praça Duque De Saldanha and Avenida
Da República in Lisbon
71
subjected to from its initial conception to the
present. Furthermore, the road axis presents
problems and inadequacies concerning the
infrastructures for soft mobility. In fact, the
sidewalks have variable widths, sometimes too small
for walking, with physical obstacles and parking
areas. The requalification of the public space was
also motivated by the lack of cycling lanes and the
disconnection with the network in operation and the
projected one to the city. Given these considerations,
the requalification project was designed with the
intention of enhancing the scenic effect of the square
(Praça Duque de Saldanha) in the avenue (Avenida
da República) and recovering the avenue’s initial
concept of “boulevard”.
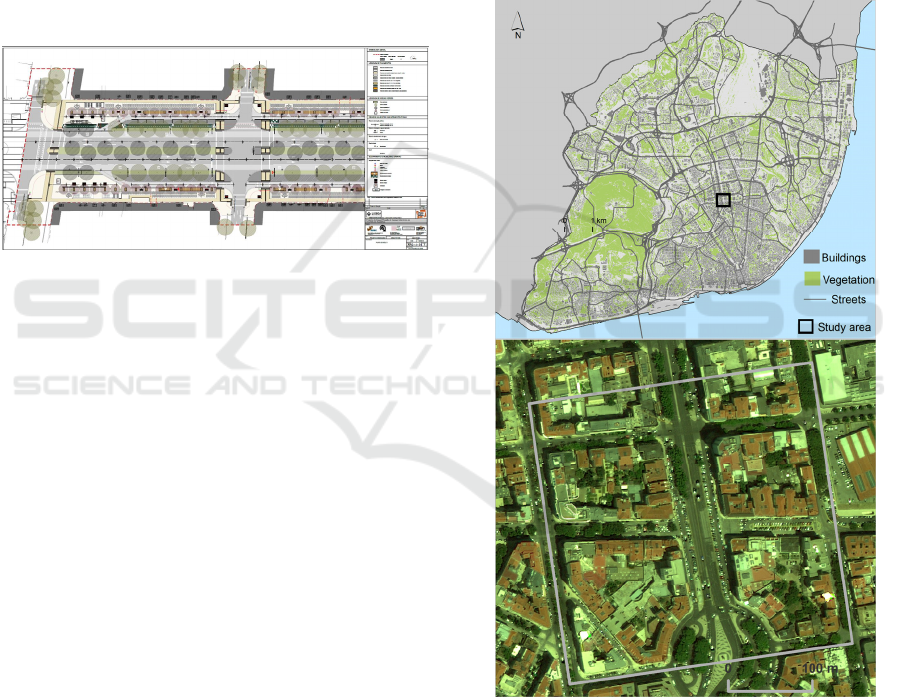
Figure 2: Avenida da República Project - two first blocks.
Concerning the square’s requalification, the
project proposes the following actions: 1) to reshape
the traffic lanes in the roundabout; 2) to increase the
pedestrian space near the buildings (11.80m),
allowing areas for esplanades; 3) to make a wide
green belt (12.50m) around the roundabout,
separating the two urban functions (road and
pedestrian); and 4) to eliminate parking spaces and
to reallocate taxicab stops.
Regarding the avenue’s requalification, the
project proposes the maintenance of the main road
central axis. In the present-day, there are four lanes
in one way and three in the opposite direction. In the
project one of these central lanes will be eliminated
and a new green central separator, 4 m wide is
planned for the local. This corridor will have an
alignment of trees and shrub vegetation, and parallel
lanes will be replanted. Furthermore, parking spaces
will be reduced, and cycling roads will be
implemented. This new road design is expected to
have an impact towards the reduction of the
excessive speed of the vehicles, thus decreasing the
chances for accidents.
2.2 Study Area
The study area is located in Avenidas Novas
neighbourhood, where the commercial and tertiary
activities take place.
The built environment includes a mix of
apartment buildings and multi-storey commercial
and mixed-used buildings. There are 146 buildings
in the area, with a mean number of 6 floors. Higher
buildings go up to 13 floors and include commercial
areas located in the square.
The urban requalification project impact in the
thermal comfort of the zone was evaluated in an area
of 11.4 ha (Figure 3), including part of the square
area and the two first blocks of Avenida da
República.
Figure 3: Study area located in Lisbon, Portugal.
2.3 Data Base
In order to model the built environment before and
after the urban requalification, a data base including
planimetric, altimetric and meteorological data was
compiled.
The urban requalification project, available at the
GISTAM 2017 - 3rd International Conference on Geographical Information Systems Theory, Applications and Management
72

City Hall, allowed identifying which roads were to
be eliminated and replaced by vegetation. Google
maps’ satellite imagery was then used to model the
buildings and the street level land cover before and
after intervention.
To model the buildings’ height, a normalised
Digital Surface Model (nDSM), with a resolution of
1 m
2
, obtained from a LiDAR flight in 2006, was
selected (Santos, 2011). To evaluate the cooling
effects in the urban requalification project, a climatic
characterisation of Lisbon city was performed
(Table 1). Lisbon has a Mediterranean climate, with
mild winters and hot and dry summers, classified as
Csa according to the Köppen system. From the
climatological normals of the period 1970-2000,
August is the hottest month, with an average
temperature of 22.5 ºC. For this month, the values of
air temperature, wind speed and direction, and
relative humidity at 2 m above ground were
retrieved from www.portalclima.pt. The value for
the roughness length was retrieved from Alcoforado
and Lopes (2003), and the value for the specific
humidity at model top, was retrieved from the
Wyoming University site
(http://weather.uwyo.edu/upperair/sounding.html).
Table 1: Meteorological input parameters for summer time
in Lisbon, Portugal.
Parameter Value
Initial atmospheric temperature (K) 295.65
Wind speed measured at 10 m height (m/s) 4.27
Wind direction (deg) 315
Roughness length of study area (m) 1
Specific humidity at 2500 m (g/kg) 3.28
Relative humidity at 2 m (%) 62
3 METHODOLOGY
The assessment of the urban requalification project
is evaluated using the ENVI-met free software
(www.envi-met.com), version 3.1. The ENVI-met is
a 3D microclimate model designed to simulate the
surface-plant-air interactions in urban environment,
at a microscale level (0.5-10 m in space, and 10 s in
time). The main prognostic variables of the
programme are wind speed and direction, air
temperature and humidity, turbulence, radiative
fluxes, bioclimatology and gas and particle
dispersion. The software takes into account in the
calculations, the radiation flux of short and long
waves, and also the latent heat of vegetation and
water elements. The ENVI-met was chosen due to
the simplicity of the execution of the modeling
process. In addition, the program allows the
generation of numerous types of scenarios and also
the generation of spatialized results.
In a similar study, Lee et al. (2016) tested the
ENVI-met v.4 and the RayMan software packages.
They concluded that ENVI-met can deal with large
numbers of tree canopies during the simulation
process, unlike RayMan. Furthermore, RayMan
could only investigate the micro-meteorological
parameters at individual spots and, therefore, it was
incapable of simulating spatial patterns of
parameters such as mean radiant temperature (T
mrt
)
and PET.
Among others, the ENVI-met model includes the
calculation of biometrical indices like PMV
(Predicted Mean Vote) that are used to measure and
compare human thermal comfort in different
environments. The PMV is based on the comfort
model developed by Fanger (1972) and relates the
energy balance of the human body with the human
thermal impression using a straight empirical
function. The calculation includes meteorological
variables and personal settings. Using a
biometeorological reference height of 1.6 m, the
required variables include air temperature, mean
radiant temperature, vapour pressure, and local wind
speed. The personal settings include clothing
insulation, mechanical energy production of the
body and mechanical work factor. The PMV
reference person is a 35 year old, male, with a height
of 1.75 m and a weight of 75 kg (ENVI-met, 2016).
The indicator scale ranges from -3 (very cold) to +3
(very hot), being 0 the thermal neutral value (i.e.,
comfort). PET will is not considered in this study,
since the free ENVI-met v.3.1 does not deliver this
index.
The ENVI-met model is designed in a 3D
rectangular grid. In order to run area input file and a
configuration file are required. The area input file
includes information about the environment
morphology, such as position and buildings’ height,
plant type’s distribution, surface materials and soil
types. The configuration file, on the other hand,
includes simulation date and duration, as well as
basic meteorological data.
Being a numerical model, the study area is
reduced to grid cell and the user must manually
introduce each element in the area. The visual
background used to assist this modelling stage is an
image from the study area, available in Google
Maps. The buildings are the first elements to be
modelled, including the location and the height of
every element. For this task, the nDSM information
is used. The second element to be modelled is
Modelling Urban Thermal Comfort: Evaluating the Impact of the Urban Requalification Project of Praça Duque De Saldanha and Avenida
Da República in Lisbon
73
vegetation. For Scenario 1 – the present-day
situation – the actual tree cover is modelled based on
the visual interpretation of the image. For Scenario 2
– the projected situation – the urban requalification
map is used to locate the future sidewalks, trees, and
hedges. The soil and surface are the last elements to
be modelled. In the study area, concrete and asphalt
are the most common surfaces.After modelling the
land cover of the study area, the basic
meteorological framework for simulation must be
defined (Table 1).The last step is to run the ENVI-
met model. The ENVI-met simulations typically
cover 24 to 48 hours ahead and result in atmospheric
outputs for each grid cell in the 3D raster as well as
surface and soil variables for the simulated
environment. In this study, the main output
parameters – air temperature, wind speed, and
relative humidity – are used to compare the two
scenarios. Furthermore, the human thermal comfort
index PMV, which is derived from these variables,
is also used for the comparison. The steps for
simulating the climatic environment in the study
area using ENVI-met are present in Figure 4.
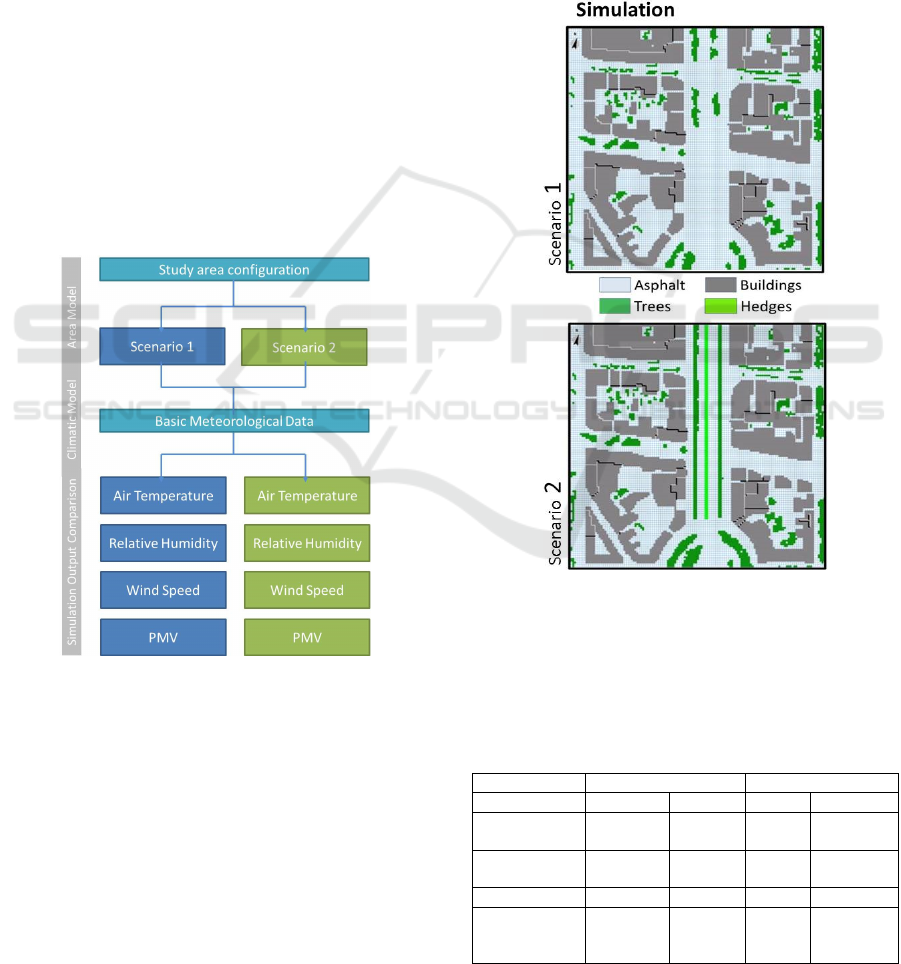
Figure 4: Methodological steps for climate modelling of
the study area under two scenarios using ENVI-met.
4 RESULTS AND DISCUSSION
Two contrasting urban scenarios were modelled in
order to assess the climatic impact of the proposed
Praça do Saldanha and Avenida da Républica urban
requalification project (Figure 5). Scenario 1 is the
present-day situation, before requalification, and
scenario 2 includes the site projected modifications
in order to increase the green area and sidewalks. In
both scenarios the buildings occupy 35% of the area.
In the first scenario, the vegetation cover is 12% of
the area, while in the second scenario it is 38%.
Furthermore, the sidewalks in the first scenario
cover 13% of the area and 18% in the projected
scenario. In both scenarios simulations were
modelled under the same conditions: 1) the area
input data was a 135x135x30 grid, 2) the grid cell
size was dx=2.5, dy=2.5 and dz=2 m, and 3) Lisbon
geographical position. The simulation duration was
24 hours.
Figure 5: Scenarios 1 and 2 simulated in ENVI-met.
The total time needed for simulating each
scenario was about 30 hours. Table 2 shows the
simulation results for booth scenarios.
Table 2: Simulation results for scenarios 1 (sc1) and 2
(sc2), in Lisbon, Portugal, during summer time.
Parameter 9 A.M. 3 P.M.
sc1 sc2 sc1 sc2
Air
temperature
21
o
C 18
o
C 25
o
C 22
o
C
Relative
humidity
50% 60% 35% 45%
Wind speed 3.0 m/s 2.5 m/s 3.0 m/s 2.5 m/s
PMV
+ 1
(slightly
warm)
- 1.5
+ 1.5
- 1
(slightly
cold)
GISTAM 2017 - 3rd International Conference on Geographical Information Systems Theory, Applications and Management
74
The simulation process demonstrates an
improvement in the comfort indexes for the morning
and afternoon periods.
The PMV summarizes the effects of air
temperature, radiation, humidity, and wind on the
persons’ energy balance in one value each of it
weighted with level of influence.
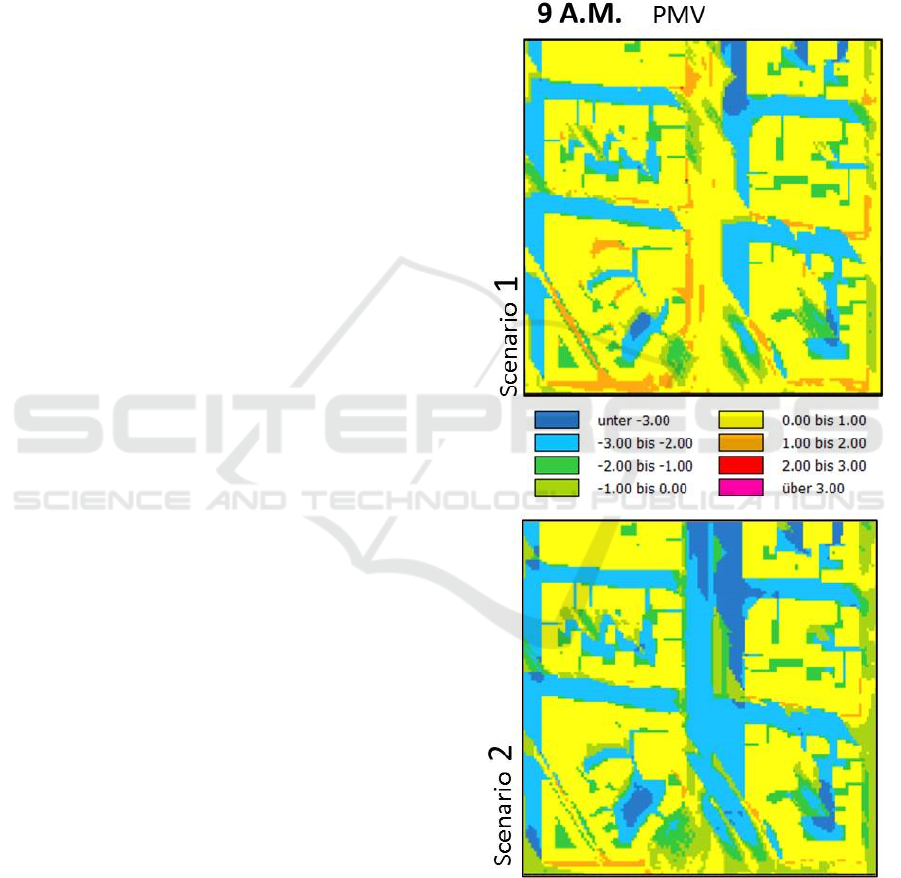
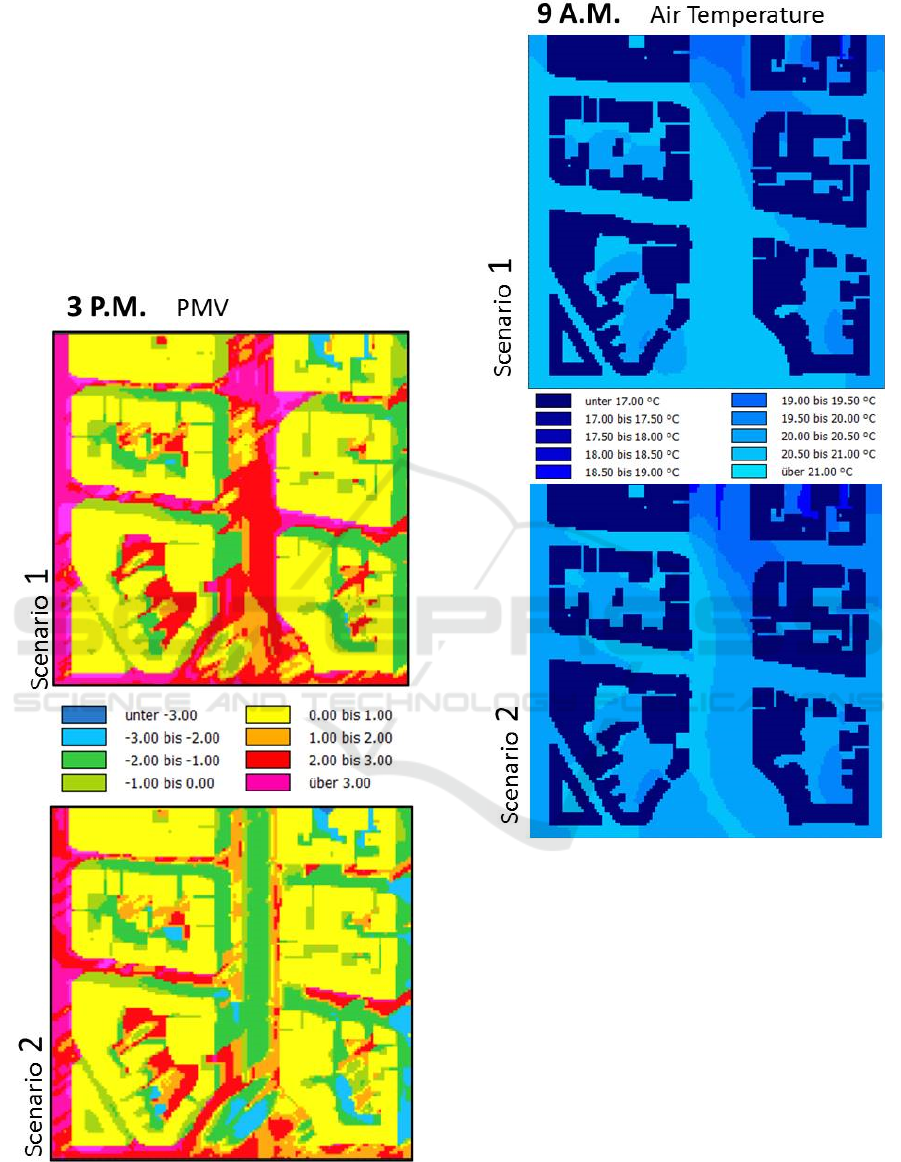
Observing the PMV maps, we can see that the
warm periods are significantly reduced (Figures 6
and 7). In the morning, in scenario 1, the PMV
indicates a slightly warm environment, while in the
second scenario it indicates a slightly cold
environment (Figure 6). In the afternoon period,
there is also an inversion of the comfort assessments,
going from slightly warm to a slightly cold
environment (Figures 7).
Looking into the different meteorological
parameters individually, the comparative results
between the current scenario (1) and the projected
one (scenario 2) show a great improvement in the
comfort of the area. In fact, and regarding the air
temperature, there is a reduction of up to 3 degrees
in the morning (9 A.M) and in the afternoon (3 P.M)
(Figures 8 and 9).
The reduction in air temperature can be
explained by the presence of trees. Trees contribute
to the reduction of the incoming solar radiation,
which consequently reduces the mean radiant
temperature. Nevertheless, this effect is more visible
on the avenue, rather than on the square. This is due
to the fact that, in the current scenario, trees are
already present in the square area.
In what concerns to the relative humidity of the
air, there was an increment of 10%. This fact can be
attributed to the evaporation of the trees and lower
vegetation (Figures 10 and 11).
Regarding natural ventilation, as expected, there
is a slight reduction in natural ventilation in both
morning and afternoon periods. In fact, wind speed
decreases from 3.5 m/s to 2.5 m/s due to the barrier
caused by the treetops, although ventilation is
preserved at all times (Figure 12 and 13).
5 CONCLUSIONS
The results provided by the simulations allow
comparing the effectiveness of the different
scenarios. Through microclimate modelling, the
potential improvements towards urban comfort
resulting from an urban planning intervention in a
square located in Lisbon are evaluated. .
Two scenarios were modelled, accounting for the
land cover before and after the intervention. The
present-day situation – scenario 1 – includes 12% of
the area with green cover (trees and shrubs), and the
projected situation – scenario 2 – foresees an
increment of 26%.
The simulation results indicate a clear
improvement in the thermal comfort of the study
area. Vegetation is, therefore, confirmed as a key
element when designing comfort urban spaces.
Figure 6: PMV in Scenario 1 and Scenario 2 simulated in
ENVI-met at 9 A.M.
Due to the model's pixel size, the details of the
sidewalk and urban design are disregarded.
However, it is clear that the new urban designs of
the road with more sidewalk area and less area of
Modelling Urban Thermal Comfort: Evaluating the Impact of the Urban Requalification Project of Praça Duque De Saldanha and Avenida
Da República in Lisbon
75
asphalt ensures an increase in thermal comfort, and
contribute to the reduction of heat island formation.
Furthermore, improving cycling and pedestrian
conditions is also foreseen as a major contribution
towards the citizens’ quality of life.
The ENVI-met demonstrates to be an efficient
tool to evaluate present and future urban scenarios
and to provide important information to support
decision making. In fact, when considering
alternative scenarios towards green cover, the
contribution to mitigate the heat urban effect can and
should be quantified.
Figure 7: PMV in Scenario 1 and Scenario 2 simulated in
ENVI-met at 3 P.M.
Figure 8: Air temperature in Scenario 1 and Scenario 2
simulated in ENVI-met at 9 A.M.
GISTAM 2017 - 3rd International Conference on Geographical Information Systems Theory, Applications and Management
76
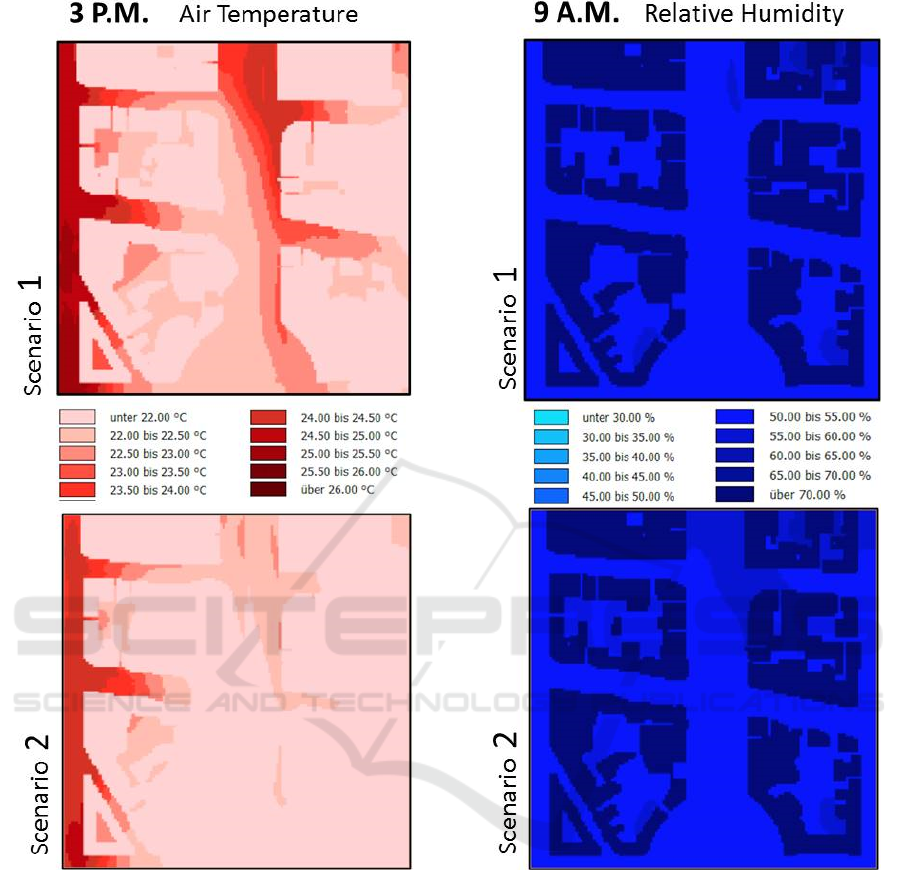
Figure 9: Air temperature in Scenario 1 and Scenario 2
simulated in ENVI-met at 3 P.M.
Figure 10: Relative Humidity in Scenario 1 and Scenario 2
simulated in ENVI-met at 9 A.M.
Modelling Urban Thermal Comfort: Evaluating the Impact of the Urban Requalification Project of Praça Duque De Saldanha and Avenida
Da República in Lisbon
77
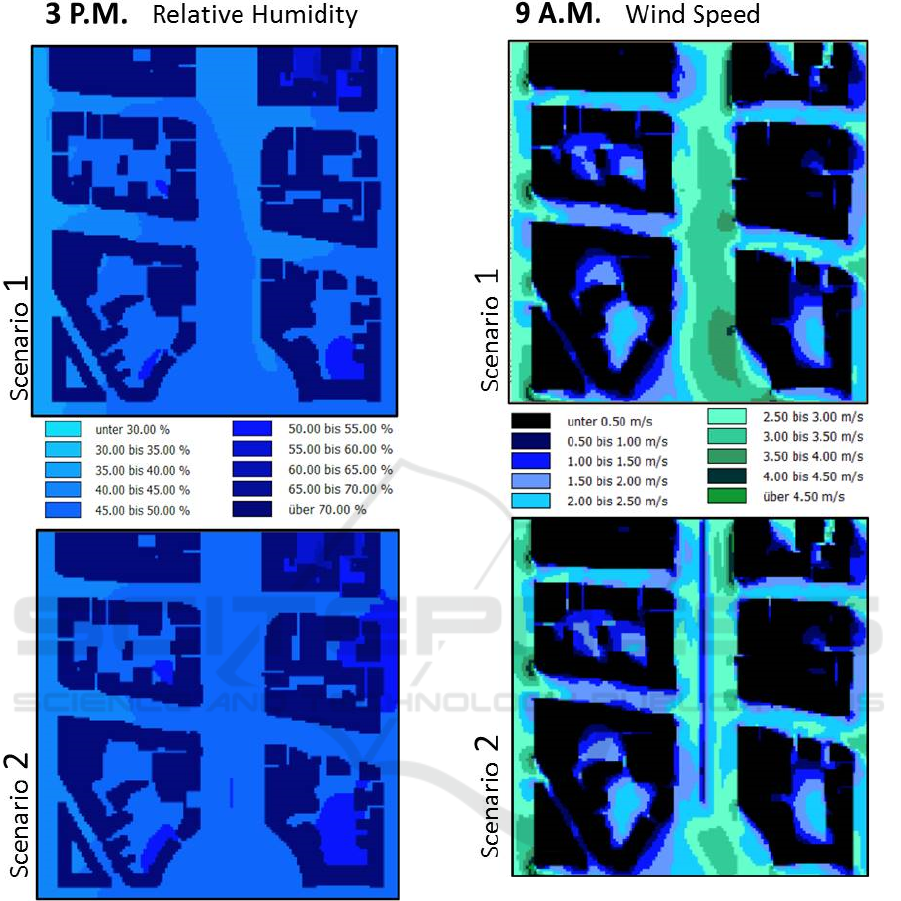
Figure 11: Relative Humidity in Scenario 1 and Scenario 2
simulated in ENVI-met at 3P.M.
Figure 12: Wind speed in Scenario 1 and Scenario 2
simulated in ENVI-met at 9 A.M.
GISTAM 2017 - 3rd International Conference on Geographical Information Systems Theory, Applications and Management
78
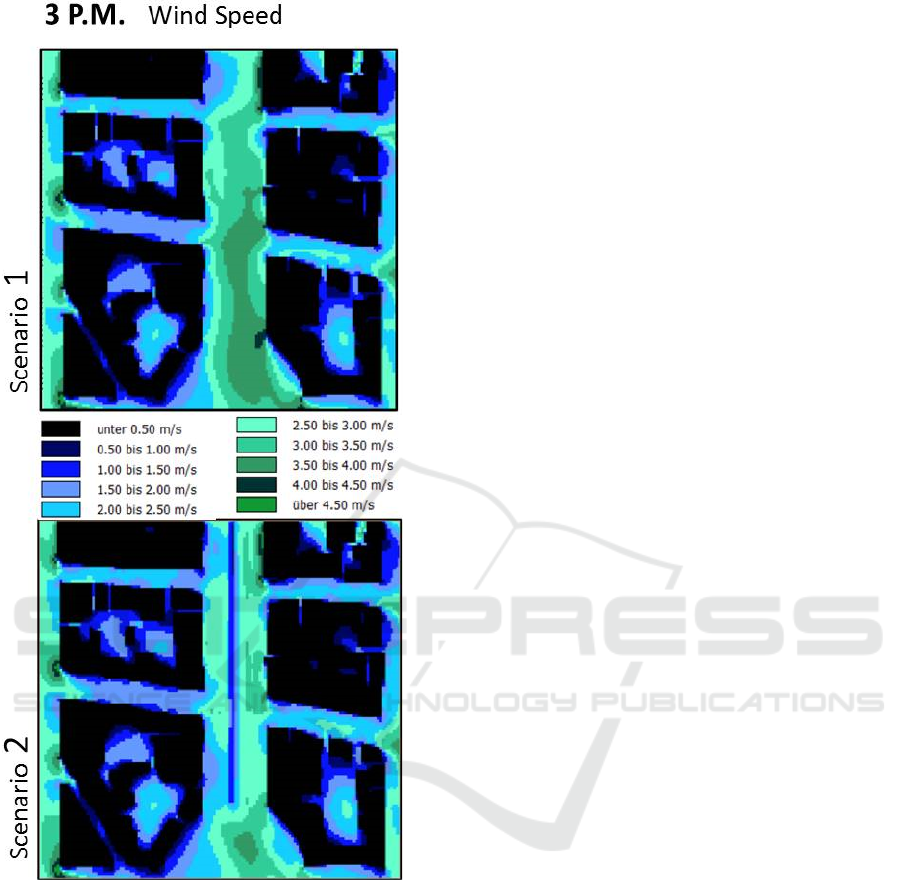
Figure 13: Wind speed in Scenario 1 and Scenario 2
simulated in ENVI-met at 3 P.M.
ACKNOWLEDGEMENTS
The authors would like to thank Logica the
opportunity to use the LiDAR data set. This paper
presents results partially supported by CICS.NOVA
- Interdisciplinary Centre of Social Sciences of the
Universidade Nova de Lisboa,
UID/SOC/04647/2013, with the financial support of
FCT/MCTES through National funds.
The first author was funded by the Fundação
para a Ciência e Tecnologia, under a post-doctoral
grant (Grant SFRH/BPD/76893/2011). The second
author was funded by Fundação de Apoio a Pesquisa
do Distrito Federal do Brasil (Foundation for
Research Support of DF).
REFERENCES
Alcoforado, M.-J., Lopes, A., 2003. Windfields and
temperature patterns in Lisbon (Portugal) and their
modification due to city growth. 5th International
Conference on Urban Climate (ICUC5), 383–386.
Lodz, Poland.
Ali-Toudert, F., Mayer, H., 2007. Effects of asymmetry,
galleries, overhanging façades and vegetation on
thermal comfort in urban street canyons. Solar Energy
81, 742–754. doi:10.1016/j.solener.2006.10.007.
Collier, M.J., Nedović-Budić, Z., Aerts, J., Connop, S.,
Foley, D., Foley, K., Newport, D., McQuaid, S., Slaev,
A., Verburg, P., 2013. Transitioning to resilience and
sustainability in urban communities. Cities, Current
Research on Cities 32, Supplement 1, S21–S28.
doi:10.1016/j.cities.2013.03.010.
ENVI_met. 2016. A holistic microclimate model [WWW
Document], n.d. URL http://www.model.envi-
met.com/hg2e/doku.php?id=apps:biomet_pmv
(accessed 12.16.16).
Fanger, P., 1972. Thermal comfort analysis and
applications in environmental engineering. Mcgraw-
Hill, New York.
Ketterer, C., Matzarakis, A., 2014. Human-
biometeorological assessment of heat stress reduction
by replanning measures in Stuttgart, Germany.
Landscape and Urban Planning 122, 78–88.
doi:10.1016/j.landurbplan.2013.11.003.
Lee, H., Mayer, H., Chen, L., 2016. Contribution of trees
and grasslands to the mitigation of human heat stress
in a residential district of Freiburg, Southwest
Germany. Landscape and Urban Planning 148, 37–50.
doi:10.1016/j.landurbplan.2015.12.004.
Lehmann, I., Mathey, J., Rößler, S., Bräuer, A., Goldberg,
V., 2014. Urban vegetation structure types as a
methodological approach for identifying ecosystem
services – Application to the analysis of micro-
climatic effects. Ecological Indicators 42, 58–72.
doi:10.1016/j.ecolind.2014.02.036.
Lobaccaro, G., Acero, J.A., 2015. Comparative analysis
of green actions to improve outdoor thermal comfort
inside typical urban street canyons. Urban Climate,
Cooling Heat Islands 14, Part 2, 251–267.
doi:10.1016/j.uclim.2015.10.002.
Ng, E., Chen, L., Wang, Y., Yuan, C., 2012. A study on
the cooling effects of greening in a high-density city:
An experience from Hong Kong. Building and
Environment, International Workshop on Ventilation,
Comfort, and Health in Transport Vehicles 47, 256–
271. doi:10.1016/j.buildenv.2011.07.014.
Oliveira, S., Andrade, H., Vaz, T., 2011. The cooling
effect of green spaces as a contribution to the
Modelling Urban Thermal Comfort: Evaluating the Impact of the Urban Requalification Project of Praça Duque De Saldanha and Avenida
Da República in Lisbon
79

mitigation of urban heat: A case study in Lisbon.
Building and Environment 46, 2186–2194.
doi:10.1016/j.buildenv.2011.04.034.
Rosheidat, A., Hoffman, D., Bryan, H. 2008. Visualizing
Pedestrian Comfort Using Envi-Met, Third National
Conference of IBPSA-USA, 198–205. Berkeley,
California.
Santos, T., 2011. Producing Geographical Information for
Land Planning using VHR Data: Local Scale
Applications. LAP LAMBERT Academic Publishing.
GISTAM 2017 - 3rd International Conference on Geographical Information Systems Theory, Applications and Management
80
