
GenDomus: Interactive and Collaboration Mechanisms for Diagnosing
Genetic Diseases
Carlos I
˜
niguez-Jarr
´
ın
1,2
, Alberto Garc
´
ıa S.
2
, Jos
´
e F. Reyes R.
2,3
and
´
Oscar Pastor L
´
opez
2
1
Departamento de Inform
´
atica y Ciencias de la Computaci
´
on,
Escuela Polit
´
ecnica Nacional, Ladr
´
on de Guevara E11-253, Quito, Ecuador
2
Research Center on Software Production Methods (PROS),
Universitat Polit
`
ecnica de Val
`
encia, Camino Vera s/n, 46022, Valencia, Spain
3
Department of Engineering Sciences, Universidad Central del Este (UCE),
Ave. Francisco Alberto Caama
˜
no De
˜
n
´
o, 21000, San Pedro de Macor
´
ıs, Dominican Republic
Keywords:
GenDomus, Collaborative Web Application, FIWARE, Genomic Information.
Abstract:
Considering the impact of Next Generation Sequence (NGS) technologies into the genetic field, the data anal-
ysis of huge amounts of sequenced DNA to transform it into knowledge has become a challenge. Within the
diagnosis of genetic diseases, the data analysis is still a manual procedure where human cognitive endeav-
our and active collaboration of several stakeholders is required. Web technologies have been widely used
to improve the collaboration between different devices. We present GenDomus, a web solution based on an
underlying conceptual model that incorporates advanced interactions mechanisms and collaborative and cog-
nitive aspects in order to support scientists in the diagnosis of genetic diseases. The relevant contribution is
to describe the design guidelines and advances in the implementation of such a solution. The cognitive anal-
ysis perspective together with the collaborative environment in the complex context of the genome analysis
domain conforms an attractive combination where web technologies can provide advanced efficient platforms
to improve the genetic diagnosis.
1 INTRODUCTION
Thanks to Next-Generation Sequence (NGS) tech-
nologies (Mardis, 2008), many important advances
have been possible on genetic sequencing, allowing
practitioners manage huge considerable DNA genetic
information. As a result of genetic practice, many
public and private data repositories with heteroge-
neous characteristics have been created around the
world (Gelbart, 1998). They are the source of sub-
sequent genetic analysis.
Genetic disease diagnose is a domain that requires
collaborative coordination between clinicians of sev-
eral fields in order to identify and analyse patterns to
justify or discard genetic anomalies. A final clinical
report is created with the collaboration of clinicians
as a result of exploring and comparing information
manually between sequenced genetic information and
data located on existent external genetic databases
(Villanueva et al., 2013).
In this context, several tools have been developed
to analyse variant
1
genomic files (e.g., VCF (Danecek
et al., 2011)), capable to operate (filtering, unions,
comparing, etc.) at a low level over file data. How-
ever, as stated by Gonzalez (Gonzalez et al., 2013),
the cardinal causes that make difficult the analysis
process are the inconsistencies between variant an-
notation resources, software packages, data formats
and the lack of intuitive mechanisms in order to anal-
yse and transform this genetic data into meaningful
knowledge.
The collaborative perspective together with the
context of the challenging domain of genetic dis-
eases diagnosis conforms a very attractive combina-
tion where web technologies can provide advanced
efficient platforms. In this paper, we present ”GenDo-
mus”, a prototype of a collaborative web-based envi-
ronment to enable genetists perform data analysis op-
erations by means of a suitable data visual representa-
tion and advanced interaction mechanisms, allowing
1
Variation (or variants): naturally occurring genetic dif-
ferences among organisms in the same species [Scitable by
Nature Edu.].
Iñiguez-Jarrín, C., S., A., R., J. and López, Ó.
GenDomus: Interactive and Collaboration Mechanisms for Diagnosing Genetic Diseases.
DOI: 10.5220/0006324000910102
In Proceedings of the 12th International Conference on Evaluation of Novel Approaches to Software Engineering (ENASE 2017), pages 91-102
ISBN: 978-989-758-250-9
Copyright © 2017 by SCITEPRESS – Science and Technology Publications, Lda. All rights reserved
91

them to make decisions. GenDomus accounts of an
underlying genome conceptual model capable to inte-
grate several genomic data sources and further, store
the data samples from VCF files to be compared with.
The design and implementation of such a web plat-
form is the most relevant contribution of this work.
To achieve our goal following this research line,
we firstly analyse in Section 2 current tools to analyse
data in the genome domain and we conclude that the
existent working tools in the genome analysis domain
are far from providing the kind of solution that we are
looking for. In the Section 3, we propose the work-
flow to guide the genetic disease diagnosis. Section 4
is pointed to describe the underlying genome concep-
tual model, upon which GenDomus is based on. The
Section 5 outlines the application design considera-
tions addressing the proposed workflow and the tech-
nological background that we consider for manipulat-
ing genomic data. Section 6 describes the first itera-
tion of GenDomus implementation. The Sections 4, 5
and 6 constitute the essential basis and practical con-
tribution that we introduce in this paper. Finally, we
close the paper presenting the conclusions and outlin-
ing future work.
2 RELATED WORKS
Some tools have been developed in order to process
the sequenced DNA data. From the literature review,
we have found a large set of tools oriented to manip-
ulate genetic data from VCF files and identify the ge-
netic variants that cause genetic diseases. We anal-
ysed this set of tools considering the following evalu-
ation criteria: a) relevance (tools that report the high-
est number of citations by articles or experiments in
the genomic domain), b) modernity (tools that have
emerged in the last 6 years), c) collaboration (tools
that incorporate collaborative aspects), d) cognitive
support (tools that incorporate mechanisms to support
the cognitive process of users).
As a result, we got eight (8) tools : VCF-Miner
(Hart et al., 2016), DECIPHER (Chatzimichali et al.,
2015), BIERapp (Alem
´
an et al., 2014), ISAAC (Baier
and Schultz, 2014), PolyTB (Coll et al., 2014), DraG-
nET (Duncan et al., 2010), Variant Tool Chest (VTC)
(Ebbert et al., 2014) and VCF Tools (Danecek et al.,
2011).
The Table 1 shows the comparison between eight
tools considering the relevant features for genetic
analysis and operations on data. Additionally, Gen-
Domus has been included in the table in order to iden-
tify its contribution in relation to the others tools.
There are two user interface approaches used by
tools in order to interact with the user: web-based
user interfaces (WUI) and command line interface
(CLI), where WUI predominates over CLI. The au-
thors of WUI-based tools argue that the tendency to
use the web as a platform justifies the need to create
easy-to-use tools and reduce the cognitive load of the
end-user. Using web forms to search for variations
with just one mouse click is easier than remember-
ing the sequence of words and symbols to search for
variations via CLI. In this sense, GenDomus exploit
the benefits offered by the web as a platform (collab-
oration, scalability, dynamic user interfaces) with the
aim of providing an easy-to-use environment to non-
technical users.
Tools such as ISAAC and DraGnET incorporate
aspects of collaboration allowing users to share data
between members of the teamwork and publish infor-
mation available to external users. GenDomus goes
beyond the features mentioned, promoting collabora-
tive analysis where users are able to interact simulta-
neously with data.
There is a close relationship between the cognitive
aspects and the visualization of the data. Although
the tabular format is commonly used by the tools to
represent the data, tools such as DECIPHER, ISAAC,
and PolyTB take advantage of graphical visualization
of data to support the cognitive human capabilities to
data analysis (i.e., perceiving and interpreting). Gen-
Domus encourages user interaction by taking advan-
tage of the power of interactive graphs. In this way,
users are aware of the dynamic behaviour of data.
In respect of the operations on the data, the oper-
ations that involve data manipulation (e.g., merge, in-
tersect, compare and complement) are related to CLI-
based tools. In contrast, operations to retrieve data
(e.g., querying and filtering) are related to web-based
tools. Each, therefore, lacks what the other has, and
has what the other lacks. Gendomus is designed to
meet the two worlds by merging the potentialities pro-
vided by each approach.
GenDomus aims to support scientist in the diagno-
sis of genetic diseases by providing an interactive and
collaborative workspace to explore the data. For this
purpose, the solution store VCF files’ genetic data and
integrate several data sources by means of an underly-
ing conceptual model (Oliv
´
e, 2007). From a consoli-
dated overview of data, the scientist performs cogni-
tive tasks reflected in interactions with the data and
such interactions themselves become the mechanism
to help users to analyse the genetic data.
ENASE 2017 - 12th International Conference on Evaluation of Novel Approaches to Software Engineering
92
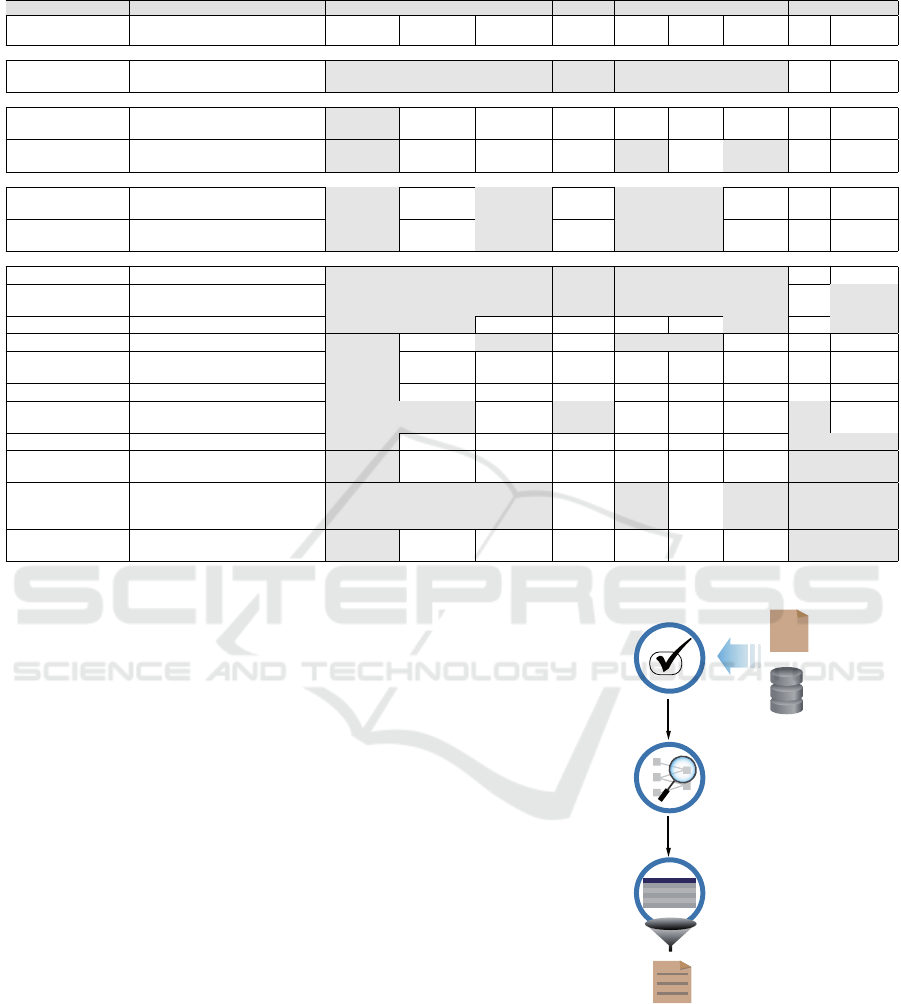
Table 1: Comparative tool analysis.
FEATURE DESCRIPTION GenDomus VCF-Miner DECIPHER BiERapp ISAAC PolyTB DraGnET VTC VCFTools
Interface type Mechanism used to interact with the
user
WUI WUI WUI WUI WUI WUI WUI CLI CLI
USABILITY
Easy-to-use Non-technical users are able to use
the tool
! ! ! ! ! ! !
COLLABORATIVE ASPECTS
Collaborative asyn-
chronous analysis
Real-time and co-located analysis !
Share data Share data between members of
team
! ! !
COGNITIVE ASPECTS
Interpret Explain the meaning of data be-
haviour
! ! ! !
Perceive Acquire knowledge through data
graphs.
! ! ! !
OPERATIONS ON THE DATA
Query Find data on a specific topic ! ! ! ! ! ! !
Filter Exclude the data which are not
wanted
! ! ! ! ! ! ! !
Annotate Add notes to data ! ! ! !
Static Visualization Read only data graph ! ! ! !
Interactive Visualiza-
tion
Data filtering enabled by graphs !
Prediction Recommend data or related actions !
Store reusable
actions
Store actions to be reused. ! ! ! !
Union Link data from different data sets ! ! !
Intersect Obtain the common data between
two data sets
! ! !
Compare Estimate the similarities or differ-
ences between two or more data
sets.
! ! ! ! ! ! !
Except Obtain the data set that does not be-
long to the selected data set.
! ! !
3 GENETIC DIAGNOSIS
SCENARIO
A genetic disease diagnosis project requires the ac-
tive participation of several specialists (i.e., biologists,
genetists, bioinformatics, etc.), working on a collabo-
ratively way to analyse the genetic samples and iden-
tify the related genetic diseases. Such findings be-
come conclusions will be taken into account in the
final diagnosis report. Such context is described by
Villanueva et al. (Villanueva et al., 2013), through
a conceptual model based on the requirements spec-
ification of domain experts. The model contains the
relationships between the main domain concepts: pa-
tients, genetic variations and related diseases. From
a patient’s DNA sample, the genetic variants can be
obtained and registered in a VCF format file. These
data are used by specialists to seek genetic variations
related to one pathology, thereby identifying the de-
gree of readiness of a patient to get a genetic disease
disorders.
For such scenario, the solution proposed considers
the workflow consisting of three stages: Data Selec-
tion, Variant Analysis and Curation, as it is depicted
in the Figure 1.
1. Data Selection: In this stage, both the genetic
DATA
SELECTION
GENETIC
SAMPLE
GENOMIC
DATABASES
VARIANT
ANALYSIS
CURATION
DIAGNOSIS
REPORT
VCF
Figure 1: Workflow to diagnose genetic diseases.
samples and public genomic databases are iden-
tified and selected by the genetists. The genetic
samples contain the set of variants to be analyzed,
whereas the public genetic databases contain the
information of pathologies related to genetic vari-
ations, such as OMIM (Hamosh et al., 2005), db-
GenDomus: Interactive and Collaboration Mechanisms for Diagnosing Genetic Diseases
93

SNP (Sherry et al., 2001) and others.
2. Variant Analysis: In this stage, specialists work
collaboratively exploring the genetic variations in
the sample and contrasting it with the information
from public genetic databases. They select the rel-
evant genetic variations that can lead to relevant
findings.
3. Curation: In this stage, specialists consolidate
all findings and proceed to draw conclusions that
support the diagnostic report.
4 GenDomus: CONCEPTUAL
MODEL (CM)
The use of conceptual modeling (Oliv
´
e, 2007) is fun-
damental for the correct design and development of
Information Systems (IS). In this section we present
the conceptual model (CM) developed for this project,
with the goal of demonstrating that only with the use
of conceptual modeling techniques can reliable and
quality information systems be implemented.
The treatment of genetic diagnoses (Choi et al.,
2009) requires a wide range of -genomic concepts-,
which we must address correctly to avoid problems
of ambiguity and data inconsistency (Reyes Rom
´
an
et al., 2016b). One of the essential advantages of the
use of conceptual modeling is that it accurately repre-
sents the relevant concepts of the analysed domain,
for example: thereof is described in the following
works (Reyes Rom
´
an et al., 2016a), (Ram and Wei,
2004).
After an analysis of the requirements requested for
this project, important decisions were taken in this
first phase to arrive at an adequate representation of
the basic and essential concepts in the understanding
of the domain under study. Figure 2 presents the CM
proposed, which can be classified into two main parts:
1. The conceptual representation for the processing
of VCF files, and
2. The conceptual representation of the data used in
the most relevant genomic repositories, such as:
ClinVar (Landrum et al., 2014), dbSNP (Sherry
et al., 2001) and HPO (Human Phenotype Ontol-
ogy) (K
¨
ohler et al., 2014).
Our proposed CM starts from the DNA study,
which is represented through a set of files that are
the result of the different sequencing processes (rep-
resented in the CM through the ”DNA Study” class).
The different types of files used (i.e., FASTQ, BAM,
VCF, etc.) are represented in the CM with the class
”File”, the child classes ”Text file” and ”Binary file”
are defined in the model for reasons of legibility, but
do not provide additional information. The binary
files from the sequencing processes are represented in
the CM by means of the ”BAM” and ”Configuratior”
classes, where the first is responsible for storing the
alignments of a reference sequence, and the second
(generated by the tool MYSEQ
2
) stores the workflow
configuration to run an analysis.
Text files are presented in three (3) types: 1)
FASTQ: text file using the FASTA
3
format and stor-
ing DNA sequences (their quality is associated with
the Illumina standard). 2) Coverage: This is shaped
by two files, one following the format gff
4
, represent-
ing the reliability of the regions sequenced based on
the number of readings performed. 3) VCF: is the text
file containing the set of structural genetic variations.
These text files are represented in the CM through
the classes ”FASTQ”, ”Coverage” and ”VCF” respec-
tively. The information of each sample sequenced and
compared in the VCF is represented by the ”Sam-
ple” class. The variations detected in one or more
of the sequenced samples are represented in the CM
by means of the ”Called variation” class, each vari-
ation is stored in a line of a VCF file. If the varia-
tion is heterozygous, the value of the secondary al-
lele is indicated; If on the other hand it is homozy-
gous, the secondary allele is null. In order to do this,
we present some decisions and filters that are applied
to the detected variations (represented in CM by the
classes ”Annotation value”, ”Annotation” and ”Fil-
ter” respectively and connected to the ”Called Vari-
ation” class).
Our CM seeks to represent the existing knowledge
in the different genomic repositories with the objec-
tive of facilitating the management of the genomic
data that support the genetic diagnosis, and then we
explain the concepts defined in the CM. When we
speak of genetic diagnoses, we directly associate the
concepts of: variations, chromosomes, genes and
phenotype. The combination of all the information
related to these concepts are the ones that make up
the result of the genetic diagnosis.
The variations represent a change in DNA, and are
composed of a position, reference, alleles and types.
These are represented in our CM by the ”Variation”
class. If the variation is based on studies (previous)
made by experts or geneticists, and also contain in-
formation on the effects of variation, these are con-
sidered as curated variations (represented in the CM
through the ”Curated Variation” class). It is impor-
tant to highlight that for these curated variations it is
2
http://www.illumina.com/systems/miseq.html
3
http://www.bioinformatics.nl/tools/crab fasta.html
4
http://www.ensembl.org/info/website/upload/gff.html
ENASE 2017 - 12th International Conference on Evaluation of Novel Approaches to Software Engineering
94
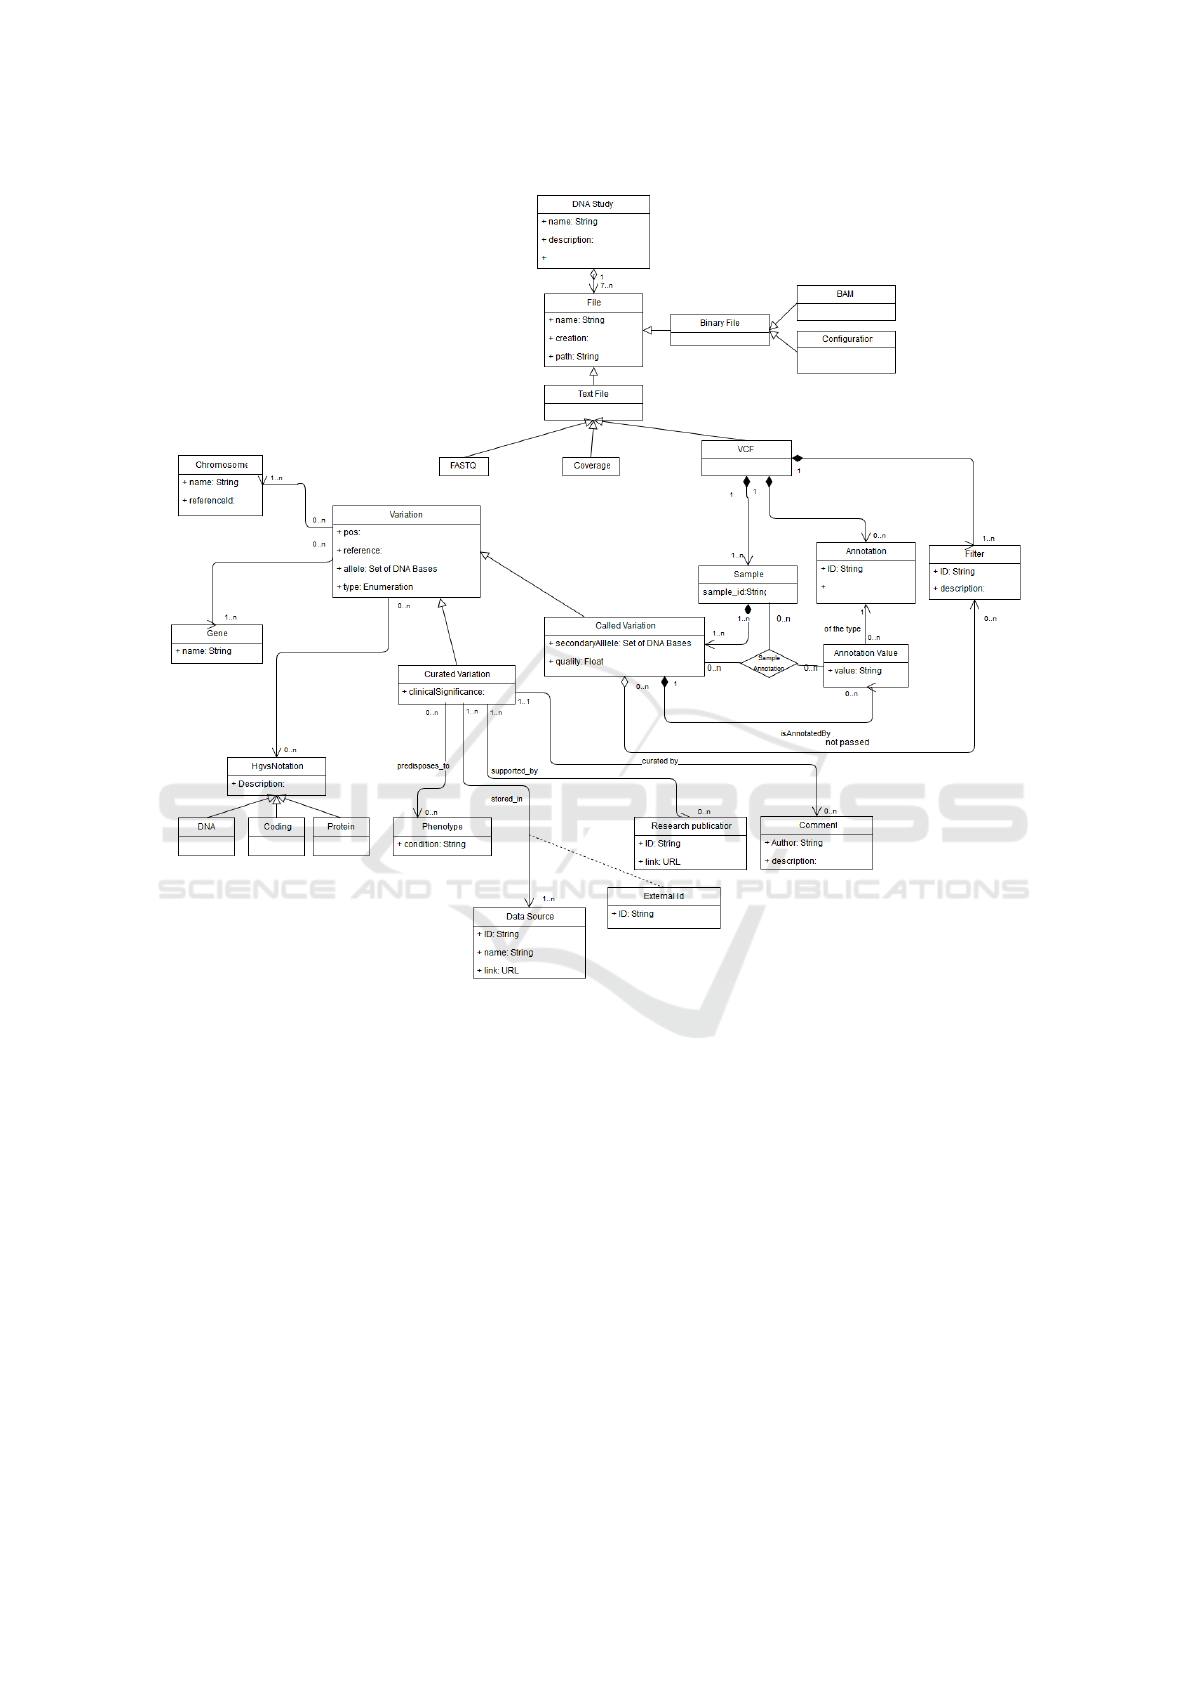
Figure 2: GenDomus conceptual model.
necessary to represent the data sources, the identifiers
used in the different repositories and everything re-
lated to the associated publications. These concepts
are represented in the CM through the classes ”Data
Source”, ”External Id”, ”Research publicatior” and
”Comment” respectively. With this information we
can access to the studies (data sources and authors)
that endorse or support such validation.
The information regarding the effects of a vari-
ation is represented in the CM by the ”Phenotype”
class. The chromosomes are used to locate and de-
scribe variations, they represent an unit of DNA that
contains genetic material (they are represented in the
model by the ”Chromosome” class). Another relevant
concept is the gene, which represents a unit of DNA
that encodes a specific function. The gene is used to
know which function is affected by a variation, and
is represented by the ”Gene” class. Another element
incorporated in our model to better describe the varia-
tions is the facilitated by the HGVS notation, which is
used to describe the variations by means of a universal
standard (represented in the model by the ”HGVS No-
tation” class, these could be of different types, such
as ”DNA”, ”Coding” and ”Protein”).
Through the use of this conceptual model we
can generate results through the use of files obtained
through the different sequencing processes validated
against the current genomic knowledge provided by
different repositories of genomic data.
5 DESIGN
We propose the design of GenDomus as a web-based
solution that incorporates advanced interaction mech-
GenDomus: Interactive and Collaboration Mechanisms for Diagnosing Genetic Diseases
95

anisms to allow scientists to work collaboratively in
the diagnosis of genetic diseases. Non-technical com-
puter users experts will be able to collaborate between
them exploring genetic samples, contrasting the infor-
mation with available information from external data
repositories and analysing the data to identify the set
of candidate genetic variants that justify the genomic
diagnosis.
The design and implementation of GenDomus
have drawn on earlier work (I
˜
niguez-Jarr
´
ın, 2016).
The project is carried out by the PROS Research
Center’s Genome Group
5
, under the FINODEX
PROJECT. The project participated in an applied sci-
ence European project that encourages the use of FI-
WARE
6
Future Internet platform as a cloud platform
of public use and free of royalties. In this way, we
present the GenDomus design guidelines, consider-
ing FIWARE as the underlying technological plat-
form and then report the first part of the solution im-
plementation.
In this section we address the interaction and col-
laboration aspects together with the underlying plat-
form considered to the design of GenDomus.
5.1 Interaction Aspects
As the saying goes: ”A picture is worth a thousand
words”, information graphs (maps, flowcharts, bar
plots, pie charts, etc.) become a powerful mechanism
for understanding and expressing knowledge that is
often difficult through other forms of expression (e.g.
verbal, written). GenDomus incorporates information
graphics as a powerful and suitable mechanism to a)
concretize the form of data, b) understand data easily,
c) explore data from a visual and interactive perspec-
tive and therefore d) draw conclusions and transmit
knowledge from what the user sees and thinks.
As Tidwell (Tidwell, 2012) mentions, good in-
teractive information graphics allows users to answer
questions such as: How is the data organized? What
is related to what? How can these data be exploited?.
The interactive graphics provide significant advan-
tages over static graphics. Through interactive graph-
ics, users move from being passive observers to being
the main and active actors in the discovery of knowl-
edge, deciding how they want to visualize, explore
and analyse the data and their relationships.
The data filters are an indispensable mechanism
for data analysis and allow the user to be aware of
the behaviour change between the analysis variables.
In this way, GenDomus is designed to incorporate in-
teractive graphs to make easier the direct interaction
5
http://www.pros.webs.upv.es/
6
https://www.fiware.org/
with the analysts, allowing them to filter graphically
the data displayed. Every interaction with a data vari-
able (available in tabular or graphical format) affects
the behaviour of other data variables. For example, a
filter expressed by selecting on a sector of a chart be-
comes a filter that instantly affects the data represen-
tation of other components within the same analysis
space.
Given the huge amount of information to be ana-
lyzed, it is important to support the user in the knowl-
edge discovery process. For this purpose, the GenDo-
mus design considers a recommendation mechanism
that, using the historical information of end-user in-
teraction, is capable of guiding the user when explor-
ing the data. The idea is to make predictions through
algorithms applied to a training set containing user
interaction patterns. Of course, the set of user inter-
action patterns should be clearly identified, described
and stored in a knowledge database. Likewise, a set
of algorithms must be studied and analyzed in order
to determine their suitability for the training data set.
5.2 Collaborative Aspects
GenDomus promotes the collaboration between
genetists involved in the data analysis through a
synchronous communication achieved by Websocket
(Hickson, 2011) technology. It allows propagating, in
real time, the state of the data analysis to all partic-
ipants. Thus, all users working from remote or co-
located workspaces look the same analysis state.
The solution design incorporates individual and
shared workspaces. In the individual workspace, ev-
ery analyst explores the data in isolation and selects
relevant findings from his point of view. In the shared
workspace, analysts are able to share their individual
findings with other team members and mainly, collab-
orate on interactive data exploration.
In order to achieve the collaborative data explo-
ration, GenDomus pursues the concept of ”multiple
interactions, a single visualization”. In the shared
space, the analysts are able to interact concurrently
with the data, and all the resulting interactions pro-
duce an only data visualization in real-time. In this
way, the geneticists are able to use their personal de-
vices (e.g. tablet, laptop) to manipulate the data and
discuss and generate conclusions from an instanta-
neous data visualization which is common for all par-
ticipants.
5.3 Platform
The GenDomus’s architecture is conceived under FI-
WARE, a robust and consistent platform that pro-
ENASE 2017 - 12th International Conference on Evaluation of Novel Approaches to Software Engineering
96

vides, among other things, open standard APIs to pro-
cess and analyze a large set of data as well as ad-
vanced features for user interaction. Striking features
to be considered in the design stage. In fact, the
GenDomus’s architecture design goal is to enable the
user-data interaction, the collaboration between users
and the integration of several genetic data reposito-
ries by means of a underlying Conceptual Model of
the Human Genome (CMHG)(Reyes Rom
´
an et al.,
2016a). To achieve this purpose, we have identi-
fied the generic components, called Generic Enablers
(GEs), available by FIWARE catalogue.
The GEs are the key components in the develop-
ment of applications within the FIWARE platform.
Each GE provides a set of application programming
interfaces APIs and its open reference for components
development, which are accessible from FIWARE
catalogue together with its description and documen-
tation (Fiware.org, 2016). In order to design and im-
plement the web user interface, considering the need
of visual data representation, collaboration and inter-
action, we have considered two GEs: WireCloud and
2D-UI.
5.3.1 Wirecloud
WireCloud is a web application for mashups, it means
that it is possible to easily create a new web appli-
cation that presents in a single interface the content
reused and integrated from other web pages.
WireCloud pursues the philosophy of turning
users into the developers of their own applica-
tions. Technically, WireCloud is based on the FI-
WARE’s Application Mashup Generic Enabler refer-
ence, which offers powerful functionalities (hetero-
geneous data integration, business logic and web user
interface components) that allows users to create their
own dashboards with RIA functionalities (Fiware.org,
2015). In fact, users are provided by a Composition
Editor, called ”dashboard”, to edit, name, place and
resize visual components.
WireCloud works on a client-server architecture
where the client side, which is executable in the user’s
browser, constitute a mashup application composed
by one or several dashboards. Dashboards are used
to set up the connections and interactions between the
visual components (i.e., widgets, operators and back-
end services) in a customized way. Instead, the server
side provides services and functionalities like cross-
domain proxy to access to external sources, store the
data and persistence state of mashups and the capa-
bility to connect to other FIWARE GEs.
The widgets are the user interface components de-
veloped under web technologies (HTML, CSS and
JavaScript) capable to send and receive state change
events from the remainder widgets placed on the
dashboard by an event based wiring engine. For in-
stance, a component containing Google maps to rep-
resent a position by a coordinate. On the other hand,
the operators are useful components to provide data
or back-end services to widgets.
Developers are able to create both widgets and
operators and make them available to the end user
through FIWARE catalogue
7
. On the one hand, the
developers create widgets and operators, packed in
zipped file format (wgt) and upload them to the FI-
WARE catalogue. While on the other hand, the users
create their own dashboards using the available op-
erators and widgets from the catalogue (Fiware.org,
2016).
WireCloud’s dashboards go beyond static data
presentations, since they provide dynamism and in-
teraction between the visible components. The user is
able to use mechanisms called “wiring” and “piping”
for orchestrating the widget-to-widget interaction
and widget-to-back services respectively.(FIWARE
Academy, 2011)
The functionality of both wiring and piping is pos-
sible through the Mashup Platform API, that allows to
access to back-end services through HTTP protocol
and offers cross-domain proxy functionalities to get
access to external services/web APIs).
5.3.2 2D-UI
The generic enabler 2D-UI
8
is a JavaScript library
for generating advanced and dynamic Web user in-
terfaces based on HTML5. Its implementation sup-
ports the use of W3C standards, the ability to define
reusable web components that support 2D and 3D in-
teractions and the reduction of fragmentation issues
produced in the presentation of graphical user inter-
faces across devices. The main idea is to enclose in
a single web component, both the graphical user in-
terface and the mechanism for recording and report-
ing of events produced by input devices. The web
components implementation is achieved by Polymer
9
JavaScript library , whereas the register and notifica-
tion of events is achieved by Input API, an application
programming interface to deal with the events pro-
duced by input devices (e.g., mouse, keyboard, game
pad) on the web browser.
Polymer allows creating fully functional interop-
erable components, which work as DOM standard
elements, which means a web component package
HTML code, a functionality expressed on JavaScript
7
https://catalogue.fiware.org/
8
http://catalogue.fiware.org/enablers/2d-ui
9
https://www.polymer-project.org/1.0/
GenDomus: Interactive and Collaboration Mechanisms for Diagnosing Genetic Diseases
97
and customized CSS styles for the proper functioning
of the component.
Despite the functionality provided by 2D-UI, the
implementation of Polymer for developing web com-
ponents is enough for our purpose since it offers ease
to build multi-purpose reusable components and im-
proves the code organization in the web interface.
For example, a web component used to list selectable
items can be used to list both genetic variations as
available external databases for genetic diagnosis.
However, it is important to mention that Polymer is
only supported by modern web browsers and in the
case of older web browsers is necessary to include ad-
ditional JavaScript code (i.e., polyfills), which enables
new web platforms characteristics.
6 IMPLEMENTATION
We address the project implementation from three
layers: a) infrastructure configuration, which deals
with hardware set up, b) business logic, which deals
with the required functionality, and c) the presenta-
tion,which makes explicit the mechanisms of inter-
action and collaboration. Both, the “a” and “b” lay-
ers, are introduced in a previous work (Garc
´
ıa Sim
´
on,
2016). The main purpose of this work is the “c” layer.
This section introduces the first iteration of Gen-
Domus implementation including some collaborative
and interaction aspects at user interface level and
mentioned in Section 5 (Design).
6.1 Widgets Development
In order to provide interaction mechanisms to facil-
itate the data exploration, we have developed three
(3) widgets (Table 2) following the WireCloud guide-
lines.
Table 2: Widgets developed.
Widget name Purpose
SampleList.wgt List the samples selected in the
samples web component.
Graph.wgt Show a statistical chart. The
widget could be reused and cus-
tomized by the final user in or-
der to show data on a Pie Chart
or Discrete Bar.
Filter.wgt Stack of every sector selection
reached on every Graph widget.
The developed widgets can be reused within the
WireCloud dashboard in order to show different in-
formation in form and content, according to the needs
of the user. For example, in the Figure 5A, the
Graph.wgt widget, which is capable of displaying
consolidated information through statistical charts,
has been used to create three graphical components,
the first one displaying the number of variants per
chromosome through a Pie chart (Figure 5Ab), the
second one displaying the number of genetic variants
by phenotype through a Bar chart (Figure 5Ac) and
the the last one (Figure 5Ad) displaying the number
of genetic variants by clinical significance.
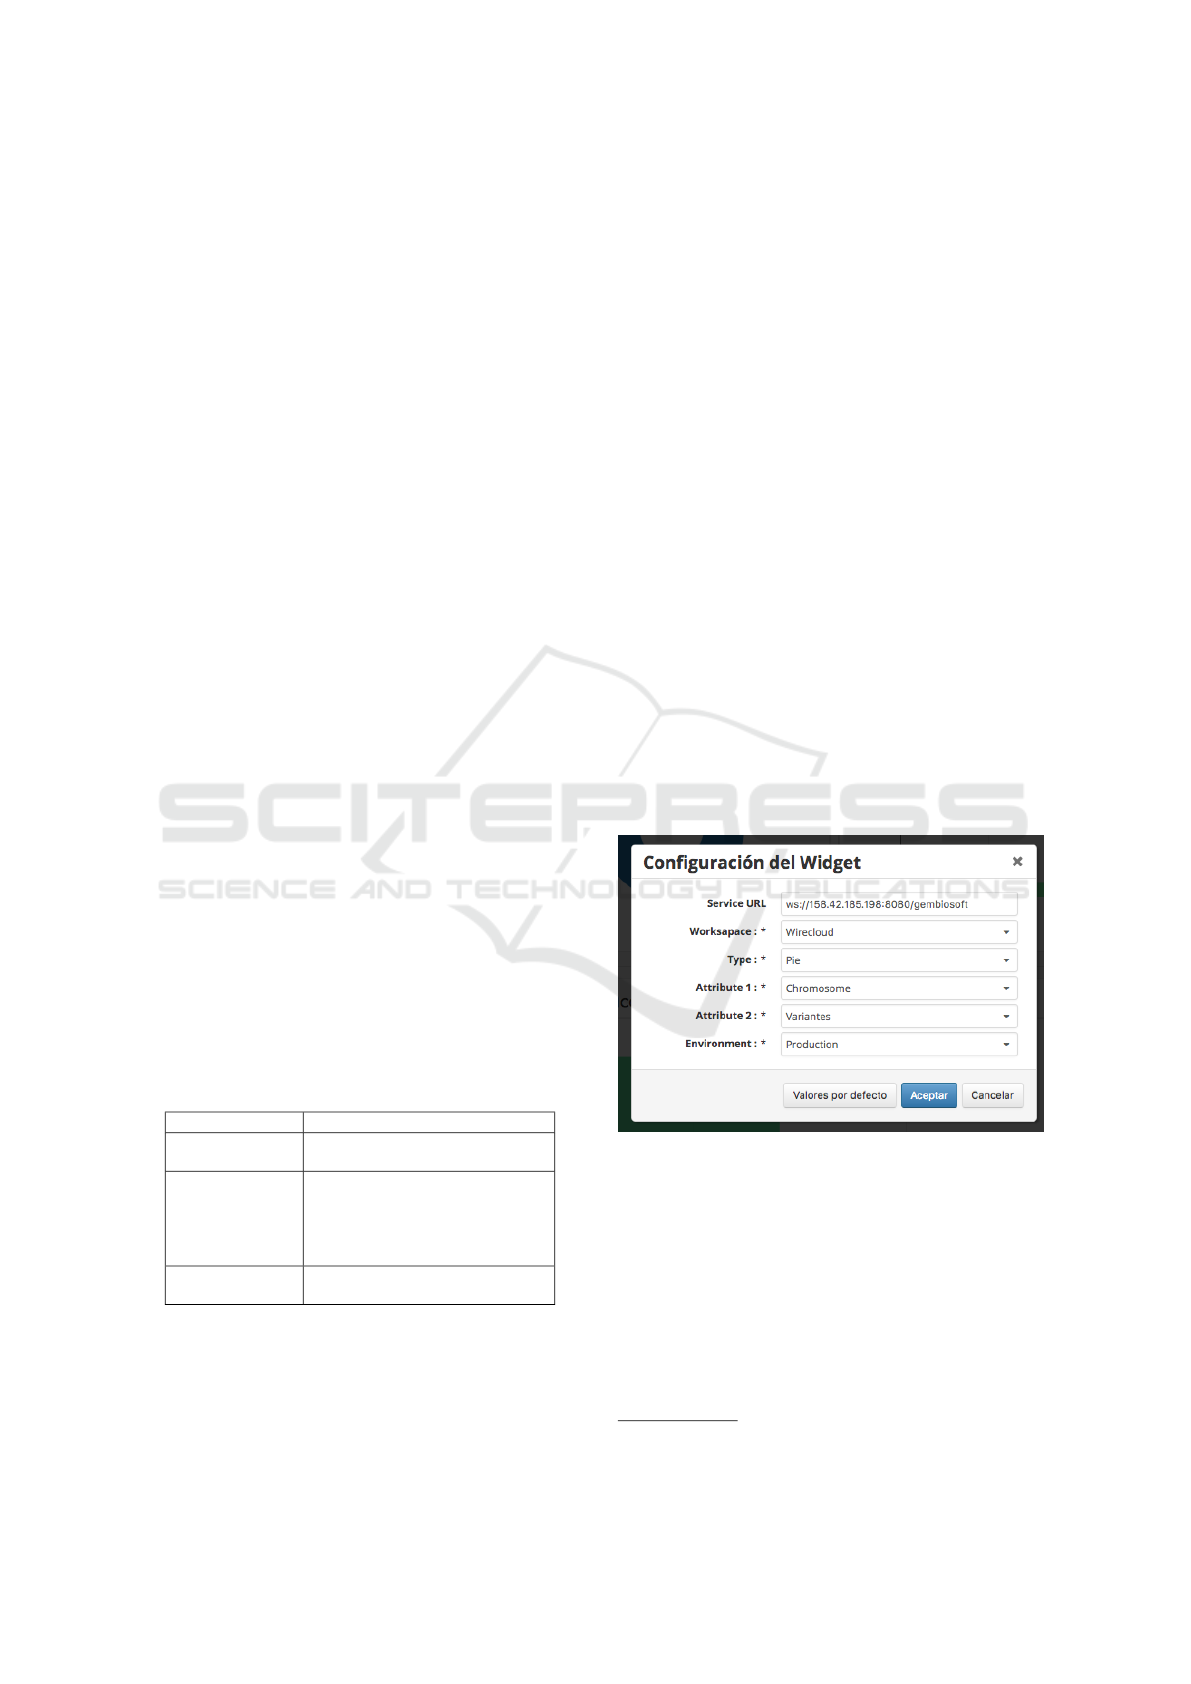
Each widget contains a Configuration Panel
where the attributes can be modified to fit the needs of
the user in both content and presentation of the data.
For example, if the user wants to show the number of
genetic variants per chromosome, an instance of the
Graph.wgt widget can be configured through its Con-
figuration Panel shown in Figure 3, where the ”Ser-
vice url” indicates the address of the data provider
service, ”Workspace” indicates whether the compo-
nent is running within or outside the WireCloud en-
vironment (the widget is capable of being run out-
side of WireCloud), ”Type” lists the available chart
types to display the data (e.g., Pie chart, Discrete Bar
chart, Stacked Area chart, etc.), ”Attribute1” and ”At-
tribute2” indicate the variables to display and the pa-
rameter ”Environmet” that can take two values: ”De-
velopment” to display the execution log via browser
Browser console and ”Production” that does not emit
messages in the browser console.
Figure 3: Configuration Panel for Graph.wgt widget.
The statistical graphs have been developed with
nvd3
10
JavaScript library. The nvd3 library provides
a set of suitable statistical charts to represent a huge
amount of data, supporting trigger events by means
of sector selection and chart resizing, features needed
for our purpose. For this prototype, we have used the
Pie Chart and the Discrete Bar Chart. In this way,
these charts incorporate filter mechanisms by select-
ing chart sectors which makes it possible to create dy-
namic queries in an ease way.
10
http://nvd3.org/
ENASE 2017 - 12th International Conference on Evaluation of Novel Approaches to Software Engineering
98
6.2 Graphical User Interface
The front end is composed of three (3) complemen-
tary web interfaces: data loading , genetic variant
analysis and curation, which are implemented under
web standards such as HTML5, JavaScript (Bootstrap
11
, jQuery
12
) and CSS. The three user interfaces are
aimed at covering the three stages of genetic diagno-
sis described in the Section 3 of this paper.
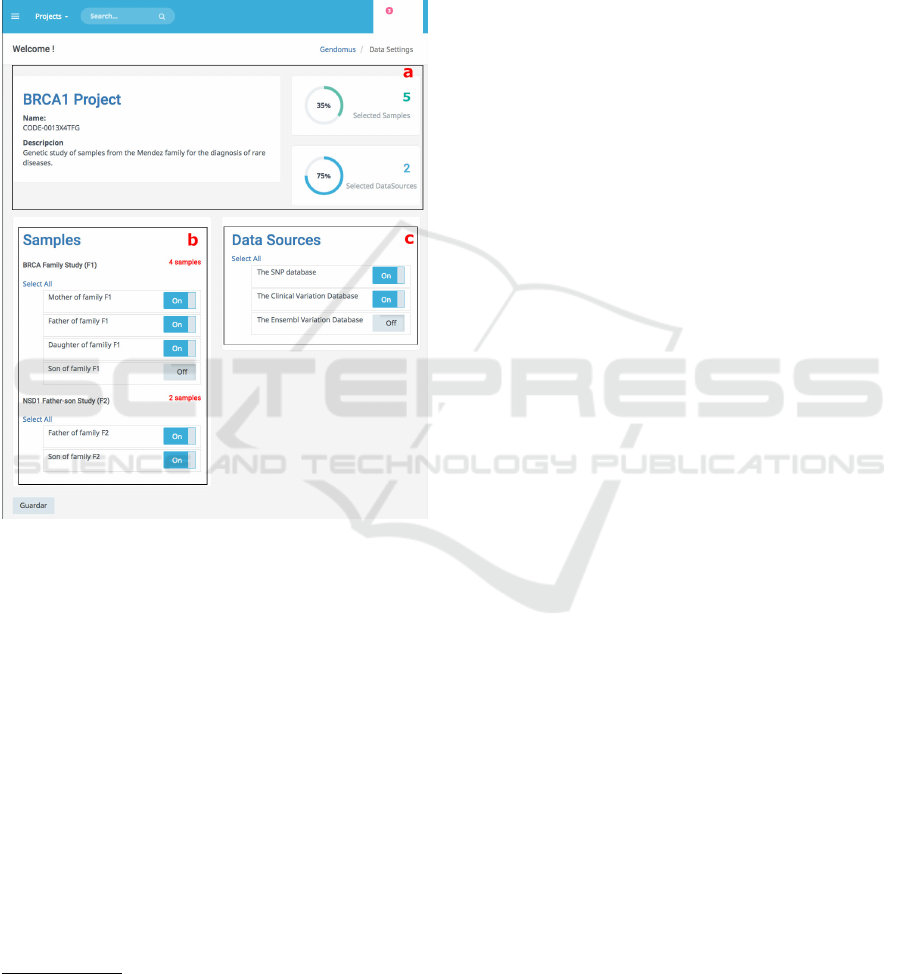
Figure 4: Data loading web page allows to select the avail-
able samples and datasources to perform the genetic data
analysis.
1. Data Loading. - From the data loading web
page (Figure 4), the user is able to select the
genetic samples to be analysed along with the
genetic databases with which he wants to com-
pare. The user interface is composed of three
web components that retrieve information from
the underlying genome CM. The web compo-
nent ”project-info” (Figure 4a) presents the infor-
mation of the genetic analysis project created to
identify the analysis in process together with the
number of samples and datasources for the anal-
ysis. The web component ”list-analysis” (Fig-
ure 4b) lists the genetic samples grouped by anal-
ysis study, while the web component of ”list-
datasources” (Figure 4c) lists the available public
11
http://getbootstrap.com/
12
https://jquery.com/
genetic databases. Both lists, genetic samples and
public genetic databases, are reusable web com-
ponents developed with the Polymer library facil-
itating its modularity for code maintenance and
organization.
2. Genetic Variant Analysis. - The genetic vari-
ant analysis web page (Figure 5A) incorporates a
dashboard where the user is able to place and set
up widgets that incorporate bi-dimensional (2D)
statistical charts to represent the data in a consoli-
dated way. The charts bring dynamism to the data
exploration, since every data chart placed on the
dashboard is sensitive to interactions and changes
in the others. In fact, each effect caused by select-
ing a chart sector is propagated and visualized in
the rest of charts; thereby we provide an easy use
aesthetic system to build dynamic queries.
The genetic samples selected in the samples list
(Figure 4b) are showed by the Data List compo-
nent (Figure 5Aa) with the option to select or de-
select the samples participants in the data explo-
ration.
Interconnected charts provides visualization of fil-
ter propagation effect and it serves as a helpful
feedback resource for users. The filters generated
are showed in a filter stack panel (Figure 5Ae) en-
abling user remember the actions executed, mod-
ify the query options or infer information about
the data showed in the graph. Ordering function-
ality is provided to user in order to customize the
view. The widgets have been developed based
on the WireCloud documentation, compressed in
a file with “wgt” extension and uploaded on FI-
WARE catalogue to be used by the final user.
In addition, interaction with data can be per-
formed through any web-based device (e.g.
tablets, laptops). The main idea is to filter the in-
formation graphically in order to identify relevant
information related to genetic diseases.
3. Curation. - As a result of the filtering and data
exploration in the genetic variant analysis web
page, the resulting genetic variations that accom-
plish with the filter constraints are showed in the
table of results contained in the curation web page
(Figure 5 B). In this user interface, the project
leader together to analysts, filter and compare the
data in order to draw up conclusions to support the
making decision. Formulating a diagnosis report
implies gather the findings all together. The main
idea is to analyse the filtered information, gen-
erate data value and appropriate information for
supporting the decision-making that will be doc-
umented in the final report. This user interface
GenDomus: Interactive and Collaboration Mechanisms for Diagnosing Genetic Diseases
99
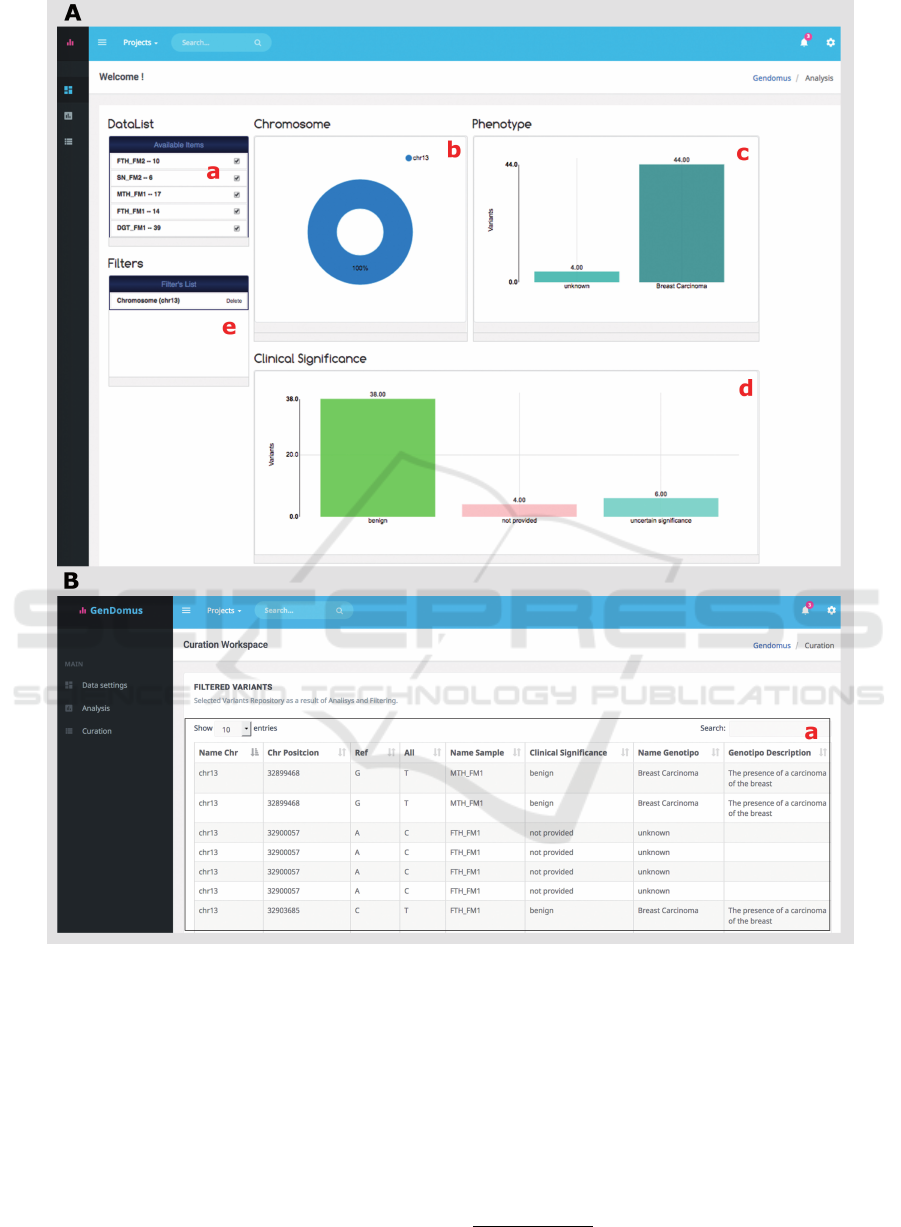
Figure 5: GenDomus web user interfaces. The Analysis web page (A) presents a dynamic dashboard containing interlinked
widgets: the Sample widget lists the set of samples selected in the data loading web page, three statistical 2D charts to explore
the data and a filter list to store each selected chart sector. The curation web page (B) lists the filtered variants by user to be
took into account in the diagnosis disease report.
is build by the web component “curation-table”
(Figure 5Ba) which shows in tabular format the
detail of selected genetic variants as a result of the
interaction in the dashboard mentioned in the vari-
ant analysis stage.
Additionally, the design of web user interfaces has
been adapted to wide range of display devices. The
“mobile first” concept, which encourages to design
the graphical interfaces starting by mobile devices,
and then to adapt it to large-scale display devices, is
a key factor for the successful web interfaces devel-
opment. For this purpose the GenDomus web inter-
face is based on a responsive template which contains
CSS, named queries, and Bootstrap
13
JavaScript li-
brary.
13
http://getbootstrap.com/
ENASE 2017 - 12th International Conference on Evaluation of Novel Approaches to Software Engineering
100

7 CONCLUSIONS AND FUTURE
WORK
Many applications have been implemented to support
collaborative activities related to genetic domain, oth-
ers have incorporated mechanism to explore genetic
data in an efficient way. However they do not com-
bine the advanced interactions, collaborative work ap-
proach and cognitive process to support the genetic
diseases diagnosis. In this paper, we present the de-
sign and first steps in the implementation of GenDo-
mus, a prototype application that combines the inter-
action mechanisms, collaborative work aspects and
the cognitive process to allow users optimizing the
work relating to explore, visualize and analyse genetic
data in order to achieve an effective genetic disease
diagnosis.
The GenDomus’s architecture is designed to re-
trieve data from various sources of information
through an underlying genomic conceptual model and
provides communication facilities to convert genomic
analysis into collaborative work. Asynchronous com-
munication encourages collaboration, making it pos-
sible to propagate the state of the data analysis to
each of the devices used by the members of the anal-
ysis team. To achieve such architecture, our design is
based on FIWARE, an underlying platform that meets
the key components to support such design.
In order to analyse the large amount of genetic
data, the intuitive GenDomus’s user interface allows
the end user to create their own control panels (dash-
boards) by incorporating connected statistical graphs
that are able to present the data in summary form
and serve as suitable data filters. Such filters allow
analysts to analyse data in a visual and tabular way.
The connected feature of data graphs allows analysts
perceiving the hidden and existent effects among the
variables of analysis. In addition, the design of web
interface follows the ”mobile first” approach in order
to face with fragmentation issues between devices, so
the web interface is adaptable to a wide range of dis-
play devices.
GenDomus is a prototype in continuous evolution.
In fact, a first demonstration of GenDomus applica-
tion has already been made to project’s stakehold-
ers. For such presentation, the application was con-
figured and deployed in a collaborative room, a phys-
ical space equipped with several deployment devices
(i.e., laptop, TV, tablets) and designed to facilitate
the collaborative work of analysts when exploring and
analysing the genetic variations in search of relevant
findings. In this scenario, the functionalities imple-
mented so far have been evaluated and the feedback
received has been incorporated into the current devel-
opment.
For the future, we hope to develop the remaining
functionality previously designed. Mainly, our efforts
will focus on developing the recommendation mech-
anism designed to support the user in the discovery of
knowledge. In addition, we plan to evaluate the appli-
cation in a real-world environment with expert users
in the genomic domain.
ACKNOWLEDGEMENTS
The author thanks the members of the PROS Center’s
Genome group for fruitful discussions. In addition, it
is also important to highlight that Secretar
´
ıa Nacional
de Educaci
´
on, Ciencia y Tecnolog
´
ıa (SENESCYT)
and Escuela Polit
´
ecnica Nacional from Ecuador and
the Ministry of Higher Education, Science and Tech-
nology (MESCyT) from Santo Domingo, Dominican
Republic, have supported this work. This project
also has the support of Generalitat Valenciana through
project IDEO (PROMETEOII/2014/039) and Spanish
Ministry of Science and Innovation through project
DataME (ref: TIN2016-80811-P).
The author thanks Francisco Valverde Girom
´
e and
Mar
´
ıa Jos
´
e Villanueva Del Pozo for their collabora-
tion with this this project.
REFERENCES
Alem
´
an, A., Garcia-Garcia, F., Salavert, F., Medina, I., and
Dopazo, J. (2014). A web-based interactive frame-
work to assist in the prioritization of disease candidate
genes in whole-exome sequencing studies. Nucleic
Acids Research, 42(W1):1–6.
Baier, H. and Schultz, J. (2014). ISAAC - InterSpecies
Analysing Application using Containers. BMC bioin-
formatics, 15(1):18.
Chatzimichali, E. A., Brent, S., Hutton, B., Perrett, D.,
Wright, C. F., Bevan, A. P., Hurles, M. E., Firth,
H. V., and Swaminathan, G. J. (2015). Facilitating
collaboration in rare genetic disorders through effec-
tive matchmaking in DECIPHER. Human mutation,
36(10):941–9.
Choi, M., Scholl, U. I., Ji, W., Liu, T., Tikhonova, I. R.,
Zumbo, P., Nayir, A., Bakkalo
˘
glu, A., Ozen, S., San-
jad, S., Nelson-Williams, C., Farhi, A., Mane, S., and
Lifton, R. P. (2009). Genetic diagnosis by whole ex-
ome capture and massively parallel DNA sequencing.
Proceedings of the National Academy of Sciences of
the United States of America, 106(45):19096–101.
Coll, F., Preston, M., Guerra-Assunc¸
˜
ao, J. A., Hill-
Cawthorn, G., Harris, D., Perdig
˜
ao, J., Viveiros, M.,
Portugal, I., Drobniewski, F., Gagneux, S., Glynn,
J. R., Pain, A., Parkhill, J., McNerney, R., Martin, N.,
GenDomus: Interactive and Collaboration Mechanisms for Diagnosing Genetic Diseases
101

and Clark, T. G. (2014). PolyTB: a genomic varia-
tion map for Mycobacterium tuberculosis. Tuberculo-
sis (Edinburgh, Scotland), 94(3):346–54.
Danecek, P., Auton, A., Abecasis, G., Albers, C. a., Banks,
E., DePristo, M. a., Handsaker, R. E., Lunter, G.,
Marth, G. T., Sherry, S. T., McVean, G., and Durbin,
R. (2011). The variant call format and VCF tools.
Bioinformatics (Oxford, England), 27(15):2156–8.
Duncan, S., Sirkanungo, R., Miller, L., and Phillips, G. J.
(2010). DraGnET: software for storing, managing
and analyzing annotated draft genome sequence data.
BMC bioinformatics, 11:100.
Ebbert, M. T. W., Wadsworth, M. E., Boehme, K. L., Hoyt,
K. L., Sharp, A. R., O’Fallon, B. D., Kauwe, J. S. K.,
and Ridge, P. G. (2014). Variant Tool Chest: an im-
proved tool to analyze and manipulate variant call
format (VCF) files. BMC bioinformatics, 15 Suppl
7:S12.
FIWARE Academy (2011). Application
Mashup Generic Enabler (WireCloud).
http://edu.fiware.org/course/view.php?id=53. [On-
line; accessed 24-April-2016].
Fiware.org (2015). FIWARE Catalogue
- Application Mashup - Wirecloud.
https://catalogue.fiware.org/enablers/application-
mashup-wirecloud. [Online; accessed 27-April-
2016].
Fiware.org (2016). Welcome to the FIWARE Wiki.
https://forge.fiware.org/plugins/mediawiki/wiki/
fiware/index.php/Welcome to the FIWARE Wiki.
[Online; accessed 19-December-2016].
Garc
´
ıa Sim
´
on, A. (2016). Desarrollo de servicios para
una aplicaci
´
on web colaborativa en el marco de la
plataforma FIWARE.
Gelbart, W. M. (1998). Databases in genomic research. Sci-
ence (New York, N.Y.), 282(5389):659–61.
Gonzalez, M. A., Lebrigio, R. F. A., Van Booven, D., Ulloa,
R. H., Powell, E., Speziani, F., Tekin, M., Sch
¨
ule, R.,
and Z
¨
uchner, S. (2013). GEnomes Management Ap-
plication (GEM.app): a new software tool for large-
scale collaborative genome analysis. Human muta-
tion, 34(6):842–6.
Hamosh, A., Scott, A. F., Amberger, J. S., Bocchini, C. A.,
and McKusick, V. A. (2005). Online Mendelian Inher-
itance in Man (OMIM), a knowledgebase of human
genes and genetic disorders. Nucleic Acids Research,
33(DATABASE ISS.):D514–7.
Hart, S. N., Duffy, P., Quest, D. J., Hossain, A., Meiners,
M. a., and Kocher, J.-P. (2016). VCF-Miner: GUI-
based application for mining variants and annotations
stored in VCF files. Briefings in bioinformatics, 17
(2)(April):346.
Hickson, I. (2011). The websocket api. W3C Working Draft
WD-websockets-20110929, September.
I
˜
niguez-Jarr
´
ın, C. (2016). A conceptual modelling-based
approach to generate data value through the end-user
interactions: A case study in the genomics domain.
CEUR Workshop Proceedings, 1765(21/12/2016):14–
21.
K
¨
ohler, S., Doelken, S. C., Mungall, C. J., Bauer, S., Firth,
H. V., Bailleul-Forestier, I., Black, G. C. M., Brown,
D. L., Brudno, M., Campbell, J., Fitzpatrick, D. R.,
Eppig, J. T., Jackson, A. P., Freson, K., Girdea, M.,
Helbig, I., Hurst, J. A., J
¨
ahn, J., Jackson, L. G., Kelly,
A. M., Ledbetter, D. H., Mansour, S., Martin, C. L.,
Moss, C., Mumford, A., Ouwehand, W. H., Park,
S. M., Riggs, E. R., Scott, R. H., Sisodiya, S., Vooren,
S. V., Wapner, R. J., Wilkie, A. O. M., Wright, C. F.,
Vulto-Van Silfhout, A. T., Leeuw, N. D., De Vries, B.
B. A., Washingthon, N. L., Smith, C. L., Westerfield,
M., Schofield, P., Ruef, B. J., Gkoutos, G. V., Haendel,
M., Smedley, D., Lewis, S. E., and Robinson, P. N.
(2014). The Human Phenotype Ontology project:
Linking molecular biology and disease through phe-
notype data. Nucleic Acids Research, 42(D1):D966–
74.
Landrum, M. J., Lee, J. M., Riley, G. R., Jang, W., Rubin-
stein, W. S., Church, D. M., and Maglott, D. R. (2014).
ClinVar: Public archive of relationships among se-
quence variation and human phenotype. Nucleic Acids
Research, 42(D1):D980–D985.
Mardis, E. R. (2008). The impact of next-generation se-
quencing technology on genetics.
Oliv
´
e, A. (2007). Conceptual Modeling of Information Sys-
tems. Springer Berlin Heidelberg, Berlin, Heidelberg,
1 edition.
Ram, S. and Wei, W. (2004). Modeling the Semantics of
3D Protein Structures. In Genome, pages 696–708.
Springer Berlin Heidelberg.
Reyes Rom
´
an, J. F., Pastor,
´
O., Casamayor, J. C., and
Valverde, F. (2016a). Applying Conceptual Modeling
to Better Understand the Human Genome. In Con-
ceptual Modeling: 35th International Conference, ER
2016, Gifu, Japan, November 14-17, 2016, Proceed-
ings, pages 404–412. Springer International Publish-
ing.
Reyes Rom
´
an, J. F., Pastor,
´
O., Valverde, F., and Rold
´
an,
D. (2016b). How to deal with Haplotype data: An
Extension to the Conceptual Schema of the Human
Genome. CLEI ELECTRONIC JOURNAL, 19(2).
Sherry, S. T., Ward, M. H., Kholodov, M., Baker, J., Phan,
L., Smigielski, E. M., and Sirotkin, K. (2001). dbSNP:
the NCBI database of genetic variation. Nucleic acids
research, 29(1):308–311.
Tidwell, J. (2012). Designing interfaces, volume XXXIII.
O’Reilly.
Villanueva, M. J., Valverde, F., and Pastor, O. (2013). In-
volving end-users in domain-specific languages devel-
opment experiences from a bioinformatics SME. In
ENASE 2013 - Proceedings of the 8th International
Conference on Evaluation of Novel Approaches to
Software Engineering, pages 97–108.
ENASE 2017 - 12th International Conference on Evaluation of Novel Approaches to Software Engineering
102
