
Investigating the Prioritization of Unit Testing Effort
using Software Metrics
Fadel Toure
1
, Mourad Badri
1
and Luc Lamontagne
2
1
Department of Mathematics and Computer Science, University of Quebec, Trois-Rivières, Canada
2
Department of Software Engineering and Computer Science, University of Laval, Quebec, Canada
Keywords: Tests Prioritization, Unit Tests, Source Code Metrics, Logistic Regression, Machine Learning.
Abstract: In object-oriented software, unit testing is a level of software testing where each individual class is tested by
a dedicated unit test class. Unfortunately, due to time and resources constraints, this phase does not cover all
classes. The testing efforts are often focused on particular classes. In this paper, we investigate an approach
based on software information history to support the prioritization of classes to be tested. To achieve this
goal, we first analyzed different attributes of ten open-source Java software systems for which JUnit test
cases have been developed for several classes. We used the mean and the logistic regression analysis to
characterize the classes for which JUnit test classes have been developed by testers. Second, we used two
classifiers trained on metrics values and unit tests information collected from the selected systems. The
classifiers provide, for each software, a set of classes on which unit testing efforts have to be focused. The
obtained sets have been compared to the sets of classes for which JUnit test classes have been developed by
testers. Results show that: (1) the metrics average values of tested classes are significantly different from the
metrics average values of other classes, (2) there is a significant relationship between the fact that a JUnit
test class has been developed for a class and its attributes, and (3) the sets of classes suggested by classifiers
reflect the testers’ selection properly.
1 INTRODUCTION
Testing plays a crucial role in software quality
assurance. It is, however, a time and resource-
consuming process. Unit testing is one of the main
phases of the testing process where each software
unit is early and individually tested using dedicated
unit test cases. In object-oriented (OO) software
systems, units are software classes and testers
usually write a dedicated unit test class for each
software class they decided to test. The main goal of
unit testing is to early reveal the faults of software
classes. In the case of large-scale OO software
systems, because of resources limitation and time
constraints, the unit testing efforts are often focused.
Testers usually select a limited set of software
classes for which they write dedicated unit tests.
Knowing that it is often difficult and not realistic to
test equally all software classes, it is important for
testers to target the most critical and fault-prone
ones. Unfortunately, the task is not obvious and
requires a deep analysis of software. In this paper,
we focus on unit testing of classes and particularly
on how to automatically target suitable classes for
unit testing using classifiers algorithms trained from
unit tests information and source code metrics.
A large number of OO metrics were proposed in
literature (Chidamber and Kemerer, 1994;
Henderson-Sellers, 1996). Some of these metrics,
related to different OO internal class attributes, were
already used in recent years to predict unit testability
of classes in OO software systems (Gupta et al.,
2005; Bruntink and Van Deursen, 2006; Badri et al.,
2010; Badri and Toure, 2011; Badri and Toure,
2012; Toure et al., 2014a; Toure et al., 2014b).
These studies have analyzed various open source
Java software systems and corresponding JUnit test
classes. One of the observations that have been made
in these studies is that unit test cases have been
developed only for a subset of classes. To the best
of our knowledge, no study focused on how the
selection of classes for which JUnit test cases have
been developed is made by testers, which criteria
have been considered for the selection of these
classes and how to automate or improve the
selection of classes on which unit testing efforts
have to be focused using source code metrics. One
Toure, F., Badri, M. and Lamontagne, L.
Investigating the Prioritization of Unit Testing Effort using Software Metrics.
DOI: 10.5220/0006319300690080
In Proceedings of the 12th International Conference on Evaluation of Novel Approaches to Software Engineering (ENASE 2017), pages 69-80
ISBN: 978-989-758-250-9
Copyright © 2017 by SCITEPRESS – Science and Technology Publications, Lda. All rights reserved
69

of the research questions we consider in this paper
is: can the selection of these classes (made by
testers) for unit tests be predicted or explained by
software classes’ attributes? As far as we know, this
issue has not been empirically investigated.
Understanding the testers’ selection criteria using
software metrics could help to: (1) know whether
these criteria are similar (reproducible) or not (from
one system to another), (2) characterize typical
software classes that require unit test cases to be
written, and (3) automate the selection of suitable
classes for the unit testing phase. In this case, we
could automatically determine the classes requiring
a more unit testing effort on which testers have to
focus to ensure software quality. We used, in this
study, some OO metrics to characterize software
classes. We considered three class attributes: size,
complexity and coupling, which we believe to be
determinative factors in the choice of testers. The
objective is first to identify the metrics that best
distinguish the classes for which unit test cases have
been developed by testers from other classes.
Software metrics will be used in a second step, in
combination with test information history, to explore
an automatic approach to prioritize the classes on
which the unit testing efforts have to be focused.
The rest of the paper is organized as follows.
Section 2 presents some related works. Section 3
presents the OO software metrics we used in our
study. Section 4 describes the data collection
procedure. Section 5 presents the empirical study
that we conducted. Section 6 focuses on the main
threats to validity related to the empirical
experimentations. Finally, Section 7 concludes the
paper, summarizes the contributions of this work
and outlines several directions for future
investigations.
2 RELATED WORK
Many researchers have proposed different tests
prioritization techniques in the literature. Test cases
prioritization has been widely discussed in the
context of regression testing, and from different
perspectives. The various proposed techniques are
based on different criteria such as fault detection,
coverage rates, software history information, and
risk analysis.
In fault detection based techniques, the main goal
is to run test cases that target the most fault prone
components.
Since these components are not known
in practice, the proposed techniques use different
factors of fault exposure as proxies, which can be
estimated in different ways from the software
artifacts. In a controlled environment, Rothermel et
al. (1999) showed that rescheduling test cases
improve the fault detection rate during regression
testing. The authors analyzed different test cases
scheduling techniques and used the APFD (Average
Percentage of Faults Detected) metric to compare
models’ performance. Yu and Lau (2012) proposed
a fault-based test cases prioritization that directly
utilizes the theoretical knowledge of their fault-
detecting ability. The technique is based on the
relationships between test cases and faults.
In coverage based techniques, the main goal is to
run test suites that cover most modified software
artefacts during regression testing. This goal leads to
fault detection rate improvement. Wong et al. (1997)
suggest a first prioritization strategy for regression
test case suites which optimizes the factor "cost
coverage" (branches that have undergone the
change). The authors focus on the prioritization of a
subset of test cases of a test suite by using a "safe
regression selection" technique. More complex
algorithms will be proposed by Mirarab et al.
(2007). The authors used Bayesian Networks to
build a unified model based on information provided
by CK metrics (Chidamber and Kemerer, 1994),
changes, and coverage rates. The defined approach
optimizes the coverage and, as a corollary, improves
the fault detection rate when compared to the
random test cases scheduling. The authors integrated
later an information feedback mechanism in the
Bayesian model in order to improve its
performances. However, the feedback mechanism
led to a relative slight improvement from the basic
Bayesian approach. Walcott and Kapfhammer
(2006) integrated time constraints in their
prioritization technique and used genetic algorithms
with artifact coverage rate as fitness function. The
authors considered different levels of software
artifacts granularity. Results showed a better APFD
value when considering the source code block level
of granularity. Rothermel et al. (1999) compared the
performances of different techniques. They describe
nine test cases prioritization techniques based on
random prioritization, coverage prioritization and
fault detection (using proxy) prioritization. They
reported the empirical results by measuring the
effectiveness of these techniques to improving fault
detection rate (AFPD). Results provide insights into
the tradeoffs among various techniques for test cases
prioritization.
The history based prioritization uses information
from the previous regression testing of the same
software system and current modification
information in order to prioritize the new test suites.
This makes the technique unsuitable for the first
ENASE 2017 - 12th International Conference on Evaluation of Novel Approaches to Software Engineering
70

regression testing of software. Porter and Kim
(2002) used the historical execution data to prioritize
test cases in a suite of regression tests. The authors
investigated the long run performance of
prioritization techniques based on data history
within environment under time and resources
constraints. The regression tests selection is driven
by the probabilities that integrate model features and
results of the previous test case execution. Lin et al.
(2013) investigate the weight of used information
between two versions of history based prioritization
techniques. The authors propose an approach that
mitigates the weight of information by integrating
the source code history of faults. Results indicated
that the approach provides a better fault detection
rate.
Some studies proposed mixing techniques based
on the history of faults detection and coverage
information. Carlson et al. (2011) conjectured that if
test cases have common properties, then test cases
within the same group may have similar fault
detection ability. The authors proposed a clustering
based prioritization technique that incorporates code
complexity, code coverage and system data history
of real faults. Applied to industrial software
products, results show that the approach could
improve the effectiveness of test cases prioritization
techniques.
Elbaum et al. (2004) analyzed the conditions into
which techniques are relevant. The authors observed
that the effectiveness of orientation techniques
varies a lot depending on various attributes of the
software and test suites. This makes difficult for a
practitioner to choose an appropriate prioritization
technique for a testing scenario. The problem has
been addressed by analyzing the fault detection rates
that result from applying several different
prioritization techniques to different programs and
their modified versions. Results provide insights and
conditions into which types of prioritization
techniques are or are not appropriate under specific
testing scenarios.
All previous techniques prioritize test suites in
the context of regression testing.
Some other
techniques allow, upstream, the prioritizing of
components to be tested. The main objective is to
optimize the testing effort to target the most fault
prone components. Boehm and Basili (2001)
proposed a Pareto distribution in which 80% of all
defects within software are found in 20% of the
modules. Ray and Mohapatra (2012) rely on the
Pareto distribution proposed by Boehm and Basili
(2001) to address the question of components
prioritization. The objective was to locate critical
parts of software code that present high risks of
faults (because of their complexity) and high impact
(because of their severity). The authors conducted an
empirical study on three small software systems.
Results indicated that the proposed approach
improves the test efficiency by targeting critical
bugs on systems. Shihab et al. (2010) explored the
prioritization for unit testing phase in the context of
legacy systems. They presented an approach that
assists testers with limited resources, to test legacy
systems efficiently. The technique leverages the
development history of a project to generate a
prioritized list of functions that managers should
focus their unit tests writing resources on. The
approach has been evaluated on two software
systems. The findings suggest that heuristics based
on the function size, modification frequency and bug
fixing frequency should be used to prioritize the unit
tests writing efforts for legacy systems.
The approach of Ray and Mohapatra (2012)
ignores the history of the software, whereas the
approach of Shihab et al. (2010) is not suitable for
new software because it requires own software
history information. Moreover, neither approach
takes advantage of the large amounts of information
available in software public repositories, coming
from the tests of various open-source software
systems. In this paper, we study the prioritization of
software classes to be tested for OO software
systems in the context of unit tests. We conjecture
that testers generally rely on class characteristics
which are captured by source code metrics, in order
to select the component for which they will write
dedicated unit tests. Thus, we propose an approach
that takes advantage of the experience of different
software testers as well as objective attributes of
software classes (metrics), in order to prioritize
classes for which unit test cases should be written.
3 SOFTWARE METRICS
We present, in this section, the OO source code
metrics we selected for the empirical study. These
metrics have received considerable attention from
researchers and are also being increasingly adopted
by practitioners. In fact, several studies have shown
that considered metrics are related to testability
(Bruntink and Van Deursen, 2004; Gupta et al.,
2005; Bruntink and Van Deursen, 2006; Badri et al.,
2010; Badri and Toure, 2011; Badri and Toure,
2012; Toure et al., 2014a; Toure et al., 2014b),
maintainability (Li and Henry, 1993; Dagpinar and
Jahnke, 2003; Zhou and Leung, 2007), and fault
proneness (Basili et al., 1996; Zhou and Leung,
2006; Aggarwal et al., 2009; Shatnawi, 2010).
Investigating the Prioritization of Unit Testing Effort using Software Metrics
71

Furthermore, these metrics have been incorporated
into several development tools. Two of the selected
metrics were proposed by Chidamber and Kemerer
(1994). We also include in our study the well-known
LOC metric. We give in what follows a brief
definition of each metric. The selected source code
metrics are related to three class attributes: coupling,
complexity and size.
Coupling between Objects: The CBO metric counts
for a given class, the number of other classes to
which it is coupled (and vice versa).
Weighted Methods per Class: The WMC metric
gives the sum of complexities of the methods of a
given class, where each method is weighted by its
cyclomatic complexity (McCabe, 1976). Only
methods specified in the class are considered.
Lines of Code per class: The LOC metric counts for
a given class its number of source lines of code.
The selected metrics have been computed using the
Borland Together Tool (http://www.borland.com).
4 DATA COLLECTION
4.1 Data Collection Procedure
The systems we selected for our study are of
different sizes and from different domains. In
addition, these systems have been developed by
different teams in Java. The selected systems have
been tested using JUnit framework. JUnit
(
http://www.junit.org/) is a simple Framework for
writing and running automated unit tests for Java
classes. The unit test cases in JUnit are written by
testers in Java. JUnit gives testers some support so
that they can write the test cases more conveniently.
A typical usage of JUnit is to test each class C
s
of
the software by means of a dedicated test class C
t
.
To actually test a class C
s
, we need to execute its test
class C
t
. This is done by calling JUnit’s test runner
tool. JUnit will report how many of the test methods
in C
t
succeeded, and how many failed.
By analyzing the code of the JUnit test cases of
the selected systems, we noticed that developers
usually name the JUnit dedicated test case classes by
adding the prefix (suffix) “Test” (“TestCase”) into
the name of the classes for which JUnit test cases
were developed. This observation has been the basis
for the identification of the link between classes and
corresponding JUnit test classes in other previous
studies (Bruntink and Van Deursen, 2006; Mockus
et al., 2009; Rompaey and Demeyer, 2009). In our
study, we adopted the same approach. The matching
procedure has been performed on the subject
systems by three research assistants separately in a
first step. Results have been checked, discussed and
validated in a second step. The software classes for
which JUnit test classes have such naming
mechanism are referred as tested classes. So, these
classes are the classes on which (in each system)
testers have deliberately focused while developing
unit test cases. We assign the modality 1 to the set of
tested classes and the modality 0 to the other classes.
In what follows, we will characterize and analyze
both categories of classes using statistics based on
source code metrics.
4.2 Selected Systems
We extracted information from the repositories of 10
open source OO software systems that were
developed in Java. For each system, only a part of
the classes has been tested using JUnit framework.
The selected systems are:
ANT (http://www.apache.org/). ANT is a Java
library and command-line tool that drives processes
described in build files as target and extension points
dependent upon each other. This system consists of
713 classes with a total of roughly 64,000 lines of
code.
DBU (http://dbunit.sourceforge.net/). DbUnit is a
JUnit extension (also usable with Ant) used in
database-driven projects that, among other things,
put a database into a known state between test runs.
This system consists of 238 classes with a total of
roughly 12,300 lines of code.
IO
(https://commons.apache.org/proper/commons-io/).
Commons IO is a library of utilities for developing
Input/Output functionalities. It is developed under
Apache Software Foundation (ASF). This system
consists of 104 classes with a total of roughly 7,600
lines of code.
IVY (http://ant.apache.org/ivy/). The agile
dependency manager known as IVY, is a popular
dependency manager. It is characterized by
flexibility, simplicity and tight integration with
Apache Ant. This system consists of 610 classes
with a total of roughly 50,080 lines of code.
LOG4J (http://wiki.apache.org/logging-log4j/).
Log4j is a fast and flexible framework for logging
applications debugging messages. This system
consists of 252 classes with a total of roughly 20,300
lines of code.
JFC (http://www.jfree.org/jfreechart/). JFreechart
is a free chart library for Java platform. This system
consists of 496 classes with a total of roughly 68,000
lines of code.
ENASE 2017 - 12th International Conference on Evaluation of Novel Approaches to Software Engineering
72
JODA (http://joda-time.sourceforge.net/). JODA-
Time is the de facto standard library for advanced
date and time in Java. Joda-Time provides a quality
replacement for the Java date and time classes. The
design supports multiple calendar systems, while
still providing a simple API. This system consists of
225 classes with a total of roughly 31,000 lines of
code.
POI (http://poi.apache.org/). POI is a Java APIs
for manipulating various file formats based upon the
Office Open XML standards (OOXML) and
Microsoft's OLE 2 Compound Document format
(OLE2). It can read and write MS Excel files using
Java. This system consists of 1,539 classes with a
total of roughly 136,000 lines of code.
MATH (http://commons.apache.org/proper/
commons-math/). Commons MATH is a library of
lightweight, self-contained mathematics and
statistics components addressing the most common
problems not available in the Java programming
language or Commons Lang. This system consists of
125 classes with a total of roughly 8,106 lines of
code.
LUCENE (http://lucene.apache.org/). LUCENE
is a high-performance, full-featured text search
engine library. It is a technology suitable for nearly
any application that requires full-text search,
especially cross-platform. This system consists of
659 classes with a total of roughly 56,900 lines of
code.
4.3 Descriptive Statistics
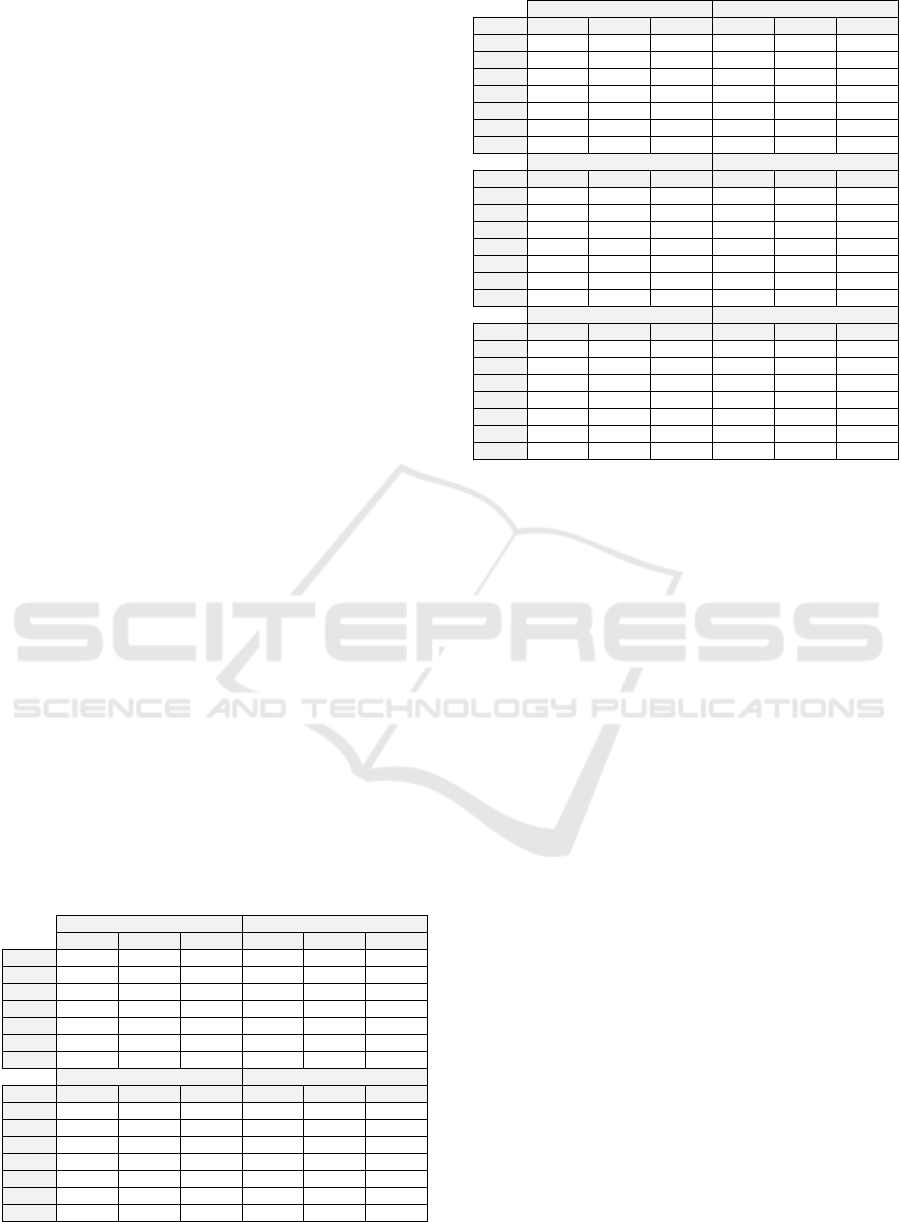
Table 1 summarizes the statistics of selected metrics
for the 10 systems. Note that for our investigations,
trivial artifacts like interfaces and pure abstract
classes have been removed from the data.
Table 1: Descriptive statistics of the source code metrics.
ANT JFC
CBO LOC WMC CBO LOC WMC
Obs. 663 663 663 411 411 411
Min. 0 1 0 0 4 0
Max. 41 1252 245 101 2041 470
Sum 4613 63548 12034 4861 67481 13428
µ 6.958 95.849 18.151 11.827 164.187 32.672
σ 7.25 132.915 24.168 14.066 228.056 46.73
Cv 1.042 1.387 1.332 1.189 1.389 1.43
DBU JODA
DBU CBO LOC WMC CBO LOC WMC
Obs. 213 213 213 201 201 201
Min. 0 4 1 0 5 1
Max. 24 488 61 36 1760 176
Sum 1316 12187 1989 1596 31339 6269
µ 6.178 57.216 9.338 7.94 155.915 31.189
σ 5.319 60.546 9.451 6.443 210.974 30.553
Cv 0.861 1.058 1.012 0.811 1.353 0.98
IO POI
IO CBO LOC WMC CBO LOC WMC
Obs. 100 100 100 1382 1382 1382
Min. 0 7 1 0 2 0
Max. 39 968 250 168 1686 374
Sum 405 7604 1817 9660 130185 23810
µ 4.05 76.04 18.17 6.99 94.2 17.229
σ 5.702 121.565 31.751 10.782 154.282 28.319
Cv 1.408 1.599 1.747 1.543 1.638 1.644
IVY MATH
IVY CBO LOC WMC CBO LOC WMC
Obs. 610 610 610 94 94 94
Min. 0 2 0 0 2 0
Max. 92 1039 231 18 660 174
Sum 5205 50080 9664 306 7779 1824
µ 8.533 82.098 15.843 3.255 82.755 19.404
σ 11.743 141.801 27.38 3.716 97.601 25.121
Cv 1.376 1.727 1.728 1.141 1.179 1.295
LOG4J LUCENE
LOG4J CBO LOC WMC CBO LOC WMC
Obs. 231 231 231 615 615 615
Min. 0 5 1 0 1 0
Max. 107 1103 207 55 2644 557
Sum 1698 20150 3694 3793 56108 10803
µ 7.351 87.229 15.991 6.167 91.233 17.566
σ 10.119 130.419 25.7 7.243 192.874 35.704
Cv 1.377 1.495 1.607 1.174 2.114 2.033
Table 1 shows that the selected software systems
are of different sizes. The lines of code vary from
7,600 lines spread over 100 software classes for IO
system, to more than 130,185 lines of code over
1,382 software classes for POI system. The number
of classes and their cyclomatic complexity follow
the same trend. Descriptive statistics also show 4
groups of systems according to the systems’ size: (1)
the small-size systems, about 100 software classes
such as IO and MATH, (2) the medium-size systems
around 200 classes as LOG4J, DBU and JODA, (3)
the large-size systems, between 400 and 600 classes
as LUCENE, IVY, ANT and JFC, and (4) the very
large-size systems over than 1,000 software classes
as POIs.
Note that the average cyclomatic complexity
varies widely between systems with similar sizes.
For example, JODA and DBU have a similar
number of classes (around 200) but quite a different
average of cyclomatic complexity (9.34 vs 31.18).
The systems LUCENE and JFC also have this
characteristic. In our data set, each observation
(software class) has, in addition to the metrics CBO,
LOC, and WMC, a binary attribute TESTED taking
modalities 1 or 0 to indicate whether it has been
tested (JUnit test class has been developed) or not.
5 EMPIRICAL ANALYSIS
5.1 Research Questions
We investigated the following research questions:
Investigating the Prioritization of Unit Testing Effort using Software Metrics
73

Q1: Can the sets of tested classes (in comparison to
the other classes) be characterized by source code
attributes?
Q2: Are there common criteria (in terms of class
attributes) used by testers to select the classes for
which they explicitly write unit test classes?
Q3: Can we automatically learn from the history of
the selection made by other testers on different
software systems using a suitable set of class
attributes to generate a set of classes similar to the
set of tested classes given by the testers of a new
system?
5.2 Goals
We investigate, in this section, the relationship
between class attributes and the fact that the class is
tested or not. We considered the source code metrics
CBO, LOC and WMC described previously as
observable (measurable) characteristics of software
classes. In a first step, we performed a Z-Test to
compare the mean values of the set of tested classes
to the mean values of the set of not-tested classes
(classes for which JUnit test classes have not been
developed). In a second step, we performed a
univariate binary logistic regression analysis. The
objective was to study the significance level of these
relationships with each metric. Finally, we used
machine learning classifiers in a third step, to
suggest a set of classes to be tested for a system
from its source code metrics and history test
information of other systems. The goal, in this case,
is to investigate to what extent the selection criteria
of classes to be tested in a given system are reusable
to support the test prioritization of classes for
another software system.
5.3 Mean Analysis
We relied on Z-Test of related samples to compare
the set of tested classes to the other classes for each
system. The Z-Test is typically used to compare the
means values of two large samples (>32
observations) of known variances. In our case, the
test will determine whether the set of tested classes
has a mean value of CBO, LOC and WMC
significantly different from the set of other classes.
We wanted to know whether the selected metrics
could significantly characterize both sets of classes.
We thus made the following null and alternative
hypotheses for each given system s and metric ms:
H0: The ms mean value of tested classes
(modality 1) is not significantly different from the
ms mean value of other classes (modality 0).
H1: The ms mean value of tested-classes is
significantly different from the ms mean value of
other classes.
The Z-Test determines a p-value that is
compared with the typical significance level α = 5%.
The p-value is the probability that the difference δ
between the mean values (μ) of two sets is not equal
to 0 by chance. The computed Z coefficient is
compared to a reference threshold (Z/Cree = 1.96 in
our case) for a normal distribution. We also
determined the standard deviation σ of each set.
Table 2 shows the results of the 10 analyzed
systems. The modalities 1 and 0 indicate
respectively the set of tested and not-tested classes.
We note that for almost all systems (except MATH),
the WMC and LOC mean values of tested classes
are significantly higher than those of not-tested
classes. For only MATH system, the difference of
WMC and LOC mean values of the two sets was not
significant: p-value of 0.092 and 0.143 (≥ 0.05). We
can generally, in the case of WMC and LOC, reject
the null hypothesis. The CBO metric seems to be
less discriminating between the two sets of classes.
Indeed, the mean differences between the sets are
not significant for LOG4J, MATH and IO systems.
This is not surprising and can be explained, among
other, by the level of observability of the software
source code attributes. Indeed, the lines of code
(LOC) and the high cyclomatic complexity (WMC)
are directly and more visible in the source code than
the level of coupling between classes. The incoming
coupling, captured by CBO, is not easily visible in a
single class source code. Indeed, identifying
coupling between classes requires global and deep
analysis of the system architecture. These
preliminary results suggest that the mean values of
software metrics of both sets of classes are
significantly different. The considered software
metrics (especially LOC and WMC) can distinguish
the set of tested classes from the set of not-tested
classes. This suggests the existence of relationship
between the software attributes captured by metrics
and the selection criteria considered by testers when
selecting software classes for which unit tests will be
written. We explore these relationships individually
in the following section.
5.4 Univariate Logistic Regression
Analysis
After characterizing the metrics mean values of
tested classes and not-tested classes sets, we present
in this section the empirical study we conducted to
evaluate individual relationship between each of
ENASE 2017 - 12th International Conference on Evaluation of Novel Approaches to Software Engineering
74

source code metrics (LOC, WMC and CBO) and the
status (tested or not) of software classes. We used
univariated logistic regression to analyze the
relationship between the considered OO metrics and
TESTED binary variable. Logistic Regression (LR)
is a standard statistical modelling method in which
the dependent variable can take on only one of two
different values. It is suitable for building software
quality classification models. It is used to predict the
dependent variable from a set of independent
variables to determine the percent of variance in the
dependent variable explained by the independent
variables. This technique has been widely applied to
the prediction of fault-prone classes (Basili et al.,
1996; Zhou and Leung, 2006; Aggarwal et al., 2009;
Shatnawi, 2010). LR is of two types: Univariate LR
and Multivariate LR. A multivariate LR model is
based on the following equation:
,
,…
∑
∑
The Xis are the independent variables and the
(normalized) bis are the estimated regression
coefficients (approximated contributions)
corresponding to the independent variables Xis. The
larger the absolute value of the coefficient, the
stronger the impact of the independent variable on
the probability P. In our case, P is the probability of
a class to be tested. The univariate regression
analysis we used is, in fact, a special case of the
multivariate regression analysis, where there is only
one independent variable (one OO metric). The p-
value related to the statistical hypothesis is the
probability of the coefficient being different from
zero by chance and is also an indicator of the
accuracy of the estimated coefficient. To decide
whether a metric is a statistically significant
predictor of tested classes, we compared the
obtained p-value to α = 0.05. Nagelkerke R
2
is
defined as the proportion of the total variance in the
dependent variable that is explained by the model.
The higher R
2
is, the higher the effect of the
independent variables, and the more accurate the
model. We also calculated the area under ROC
(Hosmer and Lemeshow, 2000) curve (AUC) to
evaluate the model adjustment level with data. A
model is considered to be well-adjusted if the AUC
value is greater than 0.70 (Hosmer and Lemeshow,
2000). The results are summarized in Table 3. The
results indicate that ANT and JODA have a
significant R
2
values for all metrics (p-values <5%),
with an AUC value < 70%. The significant value of
R
2
suggests that the information provided by metrics
has significantly improved the baseline model.
Baseline model is the prediction model in which
probabilities are based on the distribution of
dependent variable modalities. The b coefficients are
all significant according to their p-values. However,
the models are not good predictors (AUC < 0.70) of
TESTED variable. For ANT system, this result may
be explained by the low unit test class coverage
(about 16.9%). For JODA, the explanation may lie
in the low rate of tested classes among the complex
classes. Indeed, the average WMC complexity of
JODA’s not-tested classes is of 22.94 vs 15.52 for
ANT. Finally, for both systems, a key factor of
classes that have been tested is related to their
cyclomatic complexity (WMC).
Logistic models derived from that metric have
the highest R
2
value (7.7% for ANT and 16% for
JODA). For the most of models, the IO and MATH
systems present a no-significant R
2
and b values and
a low predictive ability (AUC < 70%). For IO
system, the size factor (LOC), is an exception and
has a good performance (significant R
2
of 15.4%,
significant b of 1.053 and significant AUC of 0.710
> 0.7). The size seems to be one of the main factors
that explain the choice of the software classes to be
tested by testers.
The positive sign of the b coefficients indicates
that large classes were tested while the small classes
were not. The AUC greater than 0.70 suggests that
the model derived from LOC fits the data, which
means that obtained model could be a good predictor
of TESTED variable. The average size ratio of tested
over not-tested classes is of 2.55 with the absolute
highest Z value (3.08) according to Table 2. This
confirms the performance of the size (LOC) factor.
For JFC, DBU, POI, IVY, LOG4J and LUCENE
systems, we observe a significant b, and R
2
coefficients with higher AUC scores (> 0.70). In
these systems, the selection criteria of classes to be
tested are significantly explained by the considered
software metrics. We also note, when considering
previous results in Table 2, that the Z scores of these
systems are particularly high. This result can be
explained by the multiplicity of selection criteria for
unit testing or the existence of a strong correlation
between software metrics of the systems. JFC and
IVY have significant performance for all metrics. In
both systems, all the metrics appear to have been
considered during the selection of classes to be
tested (at least the attributes they capture). Note that
the coupling is the worst performing metric.
Coupling seems to be the least considered factor
when selecting classes to be tested.
Investigating the Prioritization of Unit Testing Effort using Software Metrics
75
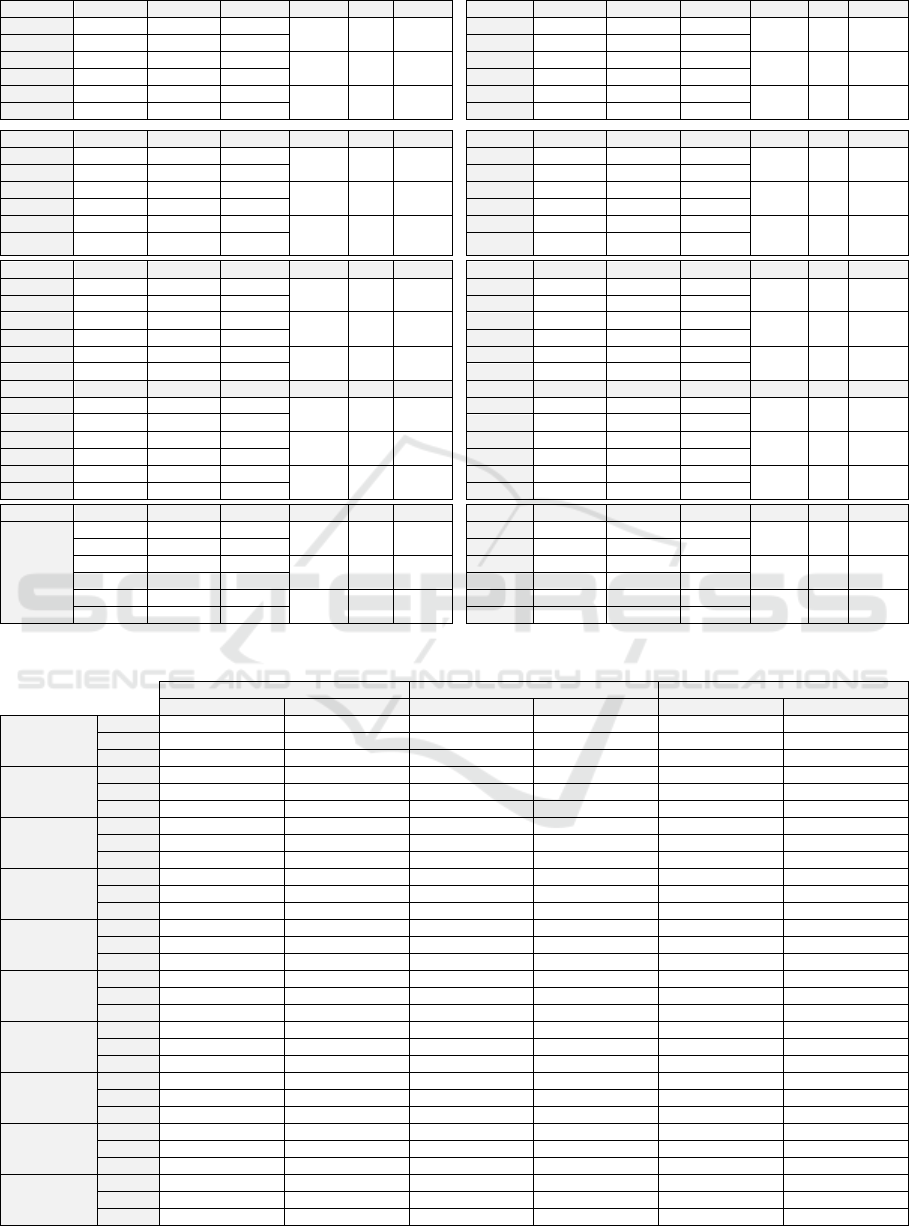
Table 2: Results of Z-Test.
ANT Obs. µ σ δ Z p-value JFC Obs. µ σ δ Z p-value
CBO | 1 112 10.41 8.6
-4.15 4.82 < 0.0001
CBO | 1 229 15.98 15.29
-0.4 -2.88 0.004
CBO | 0 551 6.26 6.75 CBO | 0 182 6.6 10.27
LOC | 1 112 157.45 154.72
-74.12 4.77 < 0.0001
LOC | 1 229 232 273.2
-74.12 -4.77 < 0.0001
LOC | 0 551 83.33 124.64 LOC | 0 182 78.86 104.61
WMC | 1 112 31.11 31.18
-15.59 5.05 < 0.0001
WMC | 1 229 46.28 57.17
-15.59 -5.05 < 0.0001
WMC | 0 551 15.52 21.61 WMC | 0 182 15.55 17.7
DBU Obs. µ σ δ Z p-value JODA Obs. µ σ δ Z p-value
CBO | 1 86 8.78 5.48
-4.36 -6.14 < 0.0001
CBO | 1 76 10.62 7.34
-4.31 -4.47 < 0.0001
CBO | 0 127 4.42 4.46 CBO | 0 125 6.31 5.26
LOC | 1 86 72.93 49.08
-26.36 -3.35 0.001
LOC | 1 76 231.89 279.65
-122.17 -3.55 0
LOC | 0 127 46.57 65.49 LOC | 0 125 109.72 138.41
WMC | 1 86 11.41 7.17
-3.47 -2.86 0.004
WMC | 1 76 44.75 39.98
-21.81 -4.46 < 0.0001
WMC | 0 127 7.94 10.56 WMC | 0 125 22.94 19.11
IO Obs. µ σ δ Z p-value POI Obs. µ σ δ Z p-value
CBO | 1 66 4.68 6.27
-1.86 -1.73 0.083
CBO | 1 387 10.76 13.72
-5.24 -6.96 < 0.0001
CBO | 0 34 2.82 4.34 CBO | 0 995 5.52 8.99
LOC | 1 66 95.85 144.34
-58.26 -3.08 0.002
LOC | 1 387 150.89 200.23
-78.74 -7.2 < 0.0001
LOC | 0 34 37.59 37.88 LOC | 0 995 72.15 125.65
WMC | 1 66 22.45 37.82
-12.6 -2.5 0.013
WMC | 1 387 29.08 37.94
-16.46 -8.03 < 0.0001
WMC | 0 34 9.85 11.37 WMC | 0 995 12.62 21.91
IVY Obs. µ σ δ Z p-value MATHS Obs. µ σ δ Z p-value
CBO | 1 95 18.23 16.1
-11.49 -6.73 < 0.0001
CBO | 1 58 3.24 3.82
-0.04 -0.05 0.963
CBO | 0 515 6.74 9.78 CBO | 0 36 3.28 3.65
LOC | 1 95 189.97 209.36
-127.77 -5.79 < 0.0001
LOC | 1 58 92.95 114.66
-26.61 -1.46 0.143
LOC | 0 515 62.2 115.33 LOC | 0 36 66.33 61.02
WMC | 1 95 34.47 38.66
-22.07 -5.39 < 0.0001
WMC | 1 58 22.31 30.35
-7.59 -1.69 0.092
WMC | 0 515 12.41 23.24 WMC | 0 36 14.72 12.56
LOG4J Obs. µ σ δ Z p-value LUCENE Obs. µ σ δ Z p-value
CBO | 1 44 8.41 8.1
-1.31 -0.9 0.366
CBO | 1 114 9.9 10.72
-4.59 -4.42 < 0.0001
CBO | 0 187 7.1 10.57 CBO | 0 501 5.32 5.89
LOC | 1 44 175.27 176.85
-108.76 -3.91 < 0.0001
LOC | 1 114 193.84 340.65
-125.96 -3.89 0
LOC | 0 187 66.51 107.84 LOC | 0 501 67.88 128.78
WMC | 1 44 34.16 43.04
-22.44 -3.4 0.001
WMC | 1 114 35.89 61.18
-22.49 -3.85 0
WMC | 0 187 11.72 17.19 WMC | 0 501 13.4 25.06
Table 3: Univariate logistic regression results.
CBO LOC WMC
values p-value values p-value values p-value
ANT
R² 0.066 < 0.0001 0.057 < 0.0001 0.077 < 0.0001
b 0.264 < 0.0001 0.238 < 0.0001 0.284 < 0.0001
AUC 0.667 0.684 0.694
JFC
R² 0.168 < 0.0001 0.235 < 0.0001 0.253 < 0.0001
b 0.532 < 0.0001 0.999 < 0.0001 1.124 < 0.0001
AUC 0.723 0.768 0.771
DBU
R² 0.214 < 0.0001 0.062 0.002 0.043 0.009
b 0.533 < 0.0001 0.266 0.004 0.207 0.012
AUC 0.762 0.756 0.755
JODA
R² 0.138 < 0.0001 0.116 < 0.0001 0.160 < 0.0001
b 0.392 < 0.0001 0.430 0.001 0.456 < 0.0001
AUC 0.670 0.690 0.679
IO
R² 0.041 0.083 0.154 0.001 0.095 0.008
b 0.269 0.145 1.053 0.010 0.762 0.049
AUC 0.620 0.710 0.684
POI
R² 0.065 < 0.0001 0.071 < 0.0001 0.097 < 0.0001
b 0.284 < 0.0001 0.307 < 0.0001 0.389 < 0.0001
AUC 0.686 0.739 0.756
IVY
R² 0.160 < 0.0001 0.131 < 0.0001 0.105 < 0.0001
b 0.417 < 0.0001 0.369 < 0.0001 0.332 < 0.0001
AUC 0.792 0.805 0.779
MATH
R² 0.000 0.963 0.027 0.167 0.035 0.115
b -0.005 0.963 0.193 0.221 0.241 0.187
AUC 0.533 0.557 0.546
LOG4J
R² 0.004 0.465 0.136 < 0.0001 0.149 < 0.0001
b 0.061 0.450 0.419 0.000 0.471 0.000
AUC 0.599 0.786 0.799
LUCENE
R² 0.079 < 0.0001 0.086 < 0.0001 0.085 < 0.0001
b 0.284 < 0.0001 0.366 < 0.0001 0.391 < 0.0001
AUC 0.657 0.749 0.750
ENASE 2017 - 12th International Conference on Evaluation of Novel Approaches to Software Engineering
76

Overall, the logistic regression analysis
suggests that the criteria that guide the testers when
selecting software classes to be tested can be, in
most cases, well explained by cyclomatic
complexity, size and coupling.
5.5 Classifiers and Cross-System
Validation
We used machine learning classifiers trained on a
system’s test information data to provide a set of
classes to be tested for other software systems. The
objective of this experiment is to see to what extent
the criteria used by the testers to decide which
software classes they will test can be reused on
different systems. The hypothesis is the following:
Considering the values of CBO, LOC and WMC
metrics for all classes of a system S
i
for which
testers have already provided a set of tested classes,
is it possible to build a learner automatically which
is able to suggest, for another system S
j
, a set of
classes (to be tested) "similar" to the set of tested
classes that would have been proposed by S
j
testers?
Validating this hypothesis would indicate the
existence of class attributes that determine the
testers’ selection. From these attributes, it will then
be possible to build an automated tool that could
help to prioritize software classes during unit testing.
Such tool could rely on tests information and
associated class metrics automatically gathered from
different open source software repositories to
support automatic unit tests orientation.
We chose multivariate logistic (LR) regression
and Naive Bayesian (NB) classifier. Multivariate LR
is particularly suitable for the binary variables
prediction. It allows analyzing multiple output
parameters that may explain the classifier model
performance. Even if the NB classifier assumes a
strong hypothesis on sample data, the classifier is
particularly efficient and fast for large observations
size such as in our case. Furthermore, it requires a
relatively small training set, which is an advantage
when trainings are done on small systems. For both
classifiers, data collected from each of the 10
systems will be used in turn as training set and the
derived model will be cross-validated on the 9
remaining systems. In Table 4, LR and NB represent
the Multivariate Logistic Regression and Naïve
Bayes classifiers. The table presents, in each box,
the accuracy (1-error) of classifications obtained for
both classifiers, trained on the system dataset of
rows i, validated on the dataset’s system on column
j. The boxes in the diagonal (k, k) present the
adjustment (1 – optimistic error) of classifiers on the
dataset of system k. We interpret the performance of
classifiers by analyzing the results obtained
according to the training data (rows) and validating
data (columns). We consider the models with
accuracy values greater than 0.70 (error < 0.30) as
good classifiers. From Table 4, the analysis of
training and test data shows 4 groups of systems.
IO and MATH compose the first group. Both
systems have unpredictable testing information.
Furthermore, the unit test information from these
systems forms bad training sets. Indeed, the
classifiers trained from these datasets have no
predictive ability on the sets of tested classes of
other systems. Overfitting problems may explain the
low performances. Indeed, both classifiers provide a
good adjustment (LR: 0.74, NB: 0.71 for IO, LR:
0.745, NB: 0.723 for MATH), but cannot predict
any dataset from other systems (rows 4 and 9).
Furthermore, the small size of both systems reduces
the training data set (100 observations for IO and
125 for MATH) and may also explain the poor
performances observed on the 4
th
and 9
th
rows. In
software testing perspective, the overfitting results
of IO and MATH as training sets indicate that the
testers took into account specific criteria of the
systems when selecting the classes to be tested.
Those specific criteria are captured by our metrics
(Good adjustment values of classifiers) but are not
considered by testers of other systems. The fact that
no classifier trained on other systems were able to
accurately predict the test information of both
systems (columns 4 and 9) confirms the specificity
of the criteria used by IO and MATH testers.
In the second group, we find DBU system. The
trained classifiers have a little predictive ability on
other systems. LR and NB classifiers do not have the
same performances depending on the validating
systems. The LR classifier predicts IVY and
LUCENE test information accurately when NB
classifier provides good adjustment on DBU test set
(0.756). NB seems to overfitting DBU dataset as in
first group systems, but LR classifier does not over
fit the training data, according to the adjustment
values (0.664). The selection made by testers seems
to consider some of common and DBU specific
criteria captured by considered metrics.
The third group is composed of JFC and JODA
systems. The classifiers trained on the group have a
good predictive ability on other systems but their
testing information is not well predicted by other
groups (<0.7). The result may be obtained when the
selection made by testers mix common criteria
captured by metrics for some selected classes with a
random or different criteria that are not captured by
LOC, WMC and CBO for other classes.
Investigating the Prioritization of Unit Testing Effort using Software Metrics
77
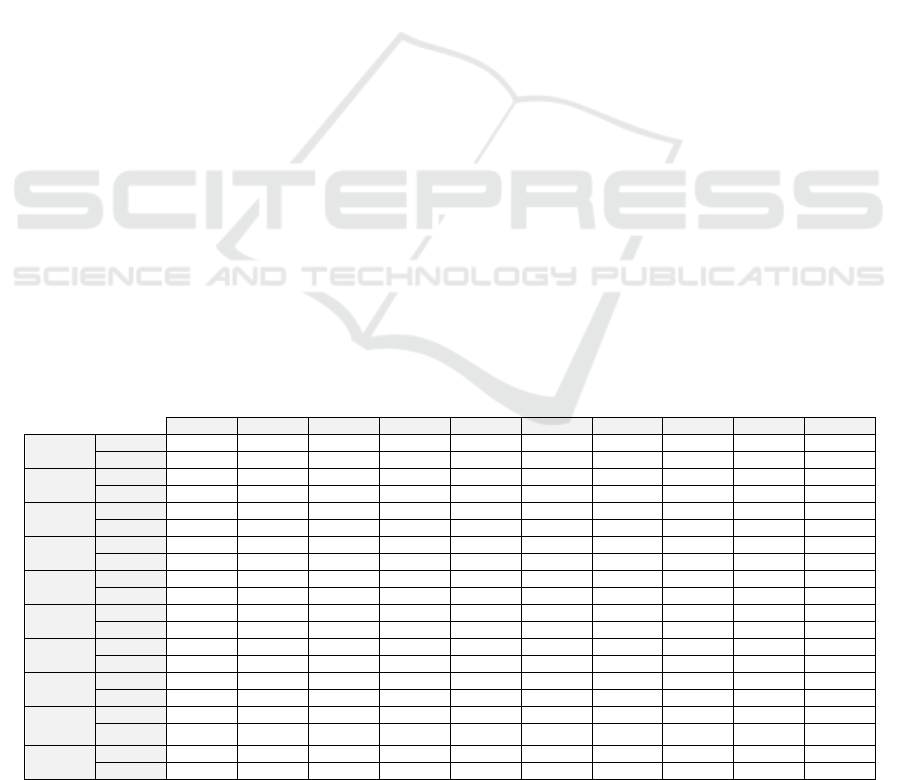
The last group is formed of ANT, IVY, LOG4J,
LUCENE and POI. The classifiers trained on the
data from the fourth group of systems can accurately
predict test information of the other systems of the
group. This result indicates that the testers of
different systems used similar criteria that are
captured by the considered metrics. LR and NB
classifiers trained on JFC and JODA (from the third
group of systems) accurately predicted the unit test
information of this group, even if they are not well-
adjusted on their dataset.
The learning algorithms and cross-validation
results, especially for systems of the 4
th
group, show
that it is possible, based on only several metrics, to
construct classifier models from existing software
datasets that automatically suggest, for another
software system, a set of classes to be tested. For the
last group, the suggested set is more than 70%
similar to the set of tested classes that would have
proposed a tester knowing the system. Results also
indicate that the criteria for selecting tested classes
are relatively the same (consistent) and significantly
captured by CBO, LOC and WMC metrics.
6 THREATS TO VALIDITY
The study we conducted in this paper was performed
on 10 open-source systems containing almost a half
million of lines of code (453K). The sample is large
to allow obtaining significant results, but the
measuring methods and approaches have limitations
that can restrict the generalization of certain
conclusions. We have identified external validity
threats that can prevent the generalization of results
and construct validity threats which can skew the
measurements.
For external validity, the threats are mainly
related to the type and the domain of considered
systems. The application domains (Calculus, Code
Parsers, Graphic Charts, etc.) and types (Standalone
application, libraries, plugins etc.) of analyzed
systems may impact the selected metrics and reduce
the classifier performances during the cross system
validation. Indeed, some analyzed systems are
mathematical algorithms libraries (IO), while others
have more complex architectures and involve many
OO-technology specific artifacts such as inheritance
and polymorphism (JFC). Thus, the learning
algorithms that trained on some types of systems can
greatly adjust to validation datasets from systems of
similar domain and not able to suggest a good set of
classes (to be tested) for other types and domain
systems. It would be interesting, in this context, to
include the domain and the type of systems as
classifier parameters to take into account this bias.
On the other hand, the data we analyzed from the
different repositories does not provide any
information on selection criteria of tested classes. It
may be that, for some systems, tested classes were
randomly selected. In these cases, obtained models
and results cannot be generalized, even for software
systems in the same domain and type.
For construct validity, the main threat lies in the
technique used for matching JUnit test suites to
software classes to identifying the tested classes.
Indeed, unpaired software classes that are tested by
transitive method calls, are ignored by our approach.
Table 4: Cross-System Validations.
ANT JFC DBU JODA IO POI IVY MATH LOG4J LUCENE
ANT
LR
0.833
0.513 0.596 0.692 0.360
0.728 0.820
0.404
0.823 0.816
NB
0.778
0.628 0.629 0.692 0.390
0.735 0.814
0.394
0.779 0.813
JFC
LR 0.697 0.698 0.601 0.602 0.500
0.724 0.766
0.511
0.736 0.771
NB 0.632 0.689 0.685 0.597 0.530
0.707 0.730
0.511
0.701 0.736
DBU
LR 0.677 0.664 0.671 0.622 0.490 0.681
0.743
0.457 0.645
0.725
NB 0.511 0.684
0.756
0.448 0.600 0.627 0.617 0.489 0.589 0.571
JODA
LR
0.796
0.620 0.620
0.711
0.390
0.721 0.814
0.415
0.779 0.807
NB
0.742
0.681 0.620 0.692 0.420
0.721 0.799
0.457
0.771 0.800
IO
LR 0.359 0.623 0.624 0.458
0.740
0.395 0.418 0.617 0.329 0.403
NB 0.403 0.652 0.667 0.413
0.710
0.505 0.454 0.628 0.494 0.433
POI
LR
0.837
0.582 0.596 0.682 0.370
0.728 0.822
0.415
0.823 0.816
NB 0.605 0.681
0.709
0.527 0.540
0.718 0.725
0.511
0.714 0.712
IVY
LR
0.828
0.511 0.596 0.622 0.340
0.726 0.822
0.383
0.801 0.820
NB
0.707
0.696 0.634 0.667 0.480
0.728 0.786
0.479
0.749 0.772
MATH
LR 0.193 0.414 0.404 0.338 0.590 0.295 0.188
0.745
0.160 0.184
NB 0.363 0.606 0.521 0.478 0.620 0.418 0.400
0.723
0.411 0.405
LOG4J
LR
0.804
0.577 0.554 0.647 0.440
0.728 0.818
0.436
0.840 0.816
NB 0.692 0.672 0.629 0.637 0.490
0.744 0.783
0.468
0.758 0.774
LUCENE
LR
0.706
0.533 0.596 0.657 0.360
0.730 0.823
0.394
0.814 0.820
NB
0.706
0.689 0.615 0.662 0.500
0.736 0.784
0.468
0.753 0.777
ENASE 2017 - 12th International Conference on Evaluation of Novel Approaches to Software Engineering
78

It would be possible to reduce this bias if we
consider a larger set formed by the union of classes
for which JUnit test classes have been written and
the classes that have been implicitly tested by
methods transitive calls.
7 CONCLUSIONS
We analyzed 10 open source software systems
containing more than 4400 classes for which testers
developed dedicated unit test classes using JUnit for
several classes of each system. The selection criteria
of classes that have been tested are not known. We
explored the possibility of explaining and reusing
these criteria for different systems through three
experiments using three source code metrics. We
first analyzed, for each system, the set of tested
classes and not-tested classes using the Z-Test.
Results show that for all metrics except CBO, the
mean values are significantly different and
consistent (the tested sets have higher average values
for LOC and WMC). Secondly, we performed a
binary univariate logistic regression analysis to
determine the individual effect of each metric on the
tested classes’ selection made by testers. Results
show a significant relationship with the considered
software metrics. We finally used multivariate LR
and NB classifiers to build models that support unit
tests prioritization. The goal was to compare classes
suggested by classifiers and the set of tested classes
provided by systems’ testers. The classifiers were
trained on each system dataset taken individually
and validated on the 9 remaining systems. Results
suggest that more than 70% of classes provided by
testers (tested classes) can be automatically
suggested by the classifiers. The results of this
experiment suggest the viability of a unit tests
prioritization automation technique using classifiers
trained on different software source code metrics
and history of the unit tests information. It would be
interesting to group systems according to their
domains, types and include other software source
code metrics such as RFC (Response For Class) to
observe the changes on results. It would also be
interesting to apply an adapted Leave-One-Out-
Validation technique (LOOV) by validating one
system with a classifier trained on the test
information of the remaining systems. We could
improve classifier performances, prevent overfitting
problems and be able to use more classifiers that
require a larger training datasets. Moreover, since
the proposed prioritization technique suggests a
slightly different (30%) set of classes from the
testers set of tested classes, it would be pertinent to
analyze and compare their actual performance on
covering faulty classes. This topic will be the next
direction of our investigations.
REFERENCES
Aggarwal K.K., Singh Y., Kaur A., and Malhotra R.,
2009. Empirical Analysis for Investigating the Effect
of Object-Oriented Metrics on Fault Proneness: A
Replicated Case Study, Software Process
Improvement and Practice, vol. 14, no. 1, pp. 39-62.
Badri L., Badri M. and Toure F., 2010. Exploring
Empirically the Relationship between Lack of
Cohesion and Testability in Object-Oriented Systems,
JSEA Eds., Advances in Software Engineering,
Communications in Computer and Information
Science, Vol. 117, Springer, Berlin.
Badri M. and Toure F., 2011. Empirical analysis for
investigating the effect of control flow dependencies
on testability of classes, in Proceedings of the 23rd
International Conference on Software Engineering and
Knowledge Engineering (SEKE '11).
Badri M. and Toure F., 2012. Empirical analysis of object
oriented design metrics for predicting unit testing
effort of classes, Journal of Software Engineering and
Applications (JSEA), Vol. 5 No. 7, pp.513-526.
Basili V.R., Briand L.C. and Melo W.L., 1996. A
Validation of Object-Oriented Design Metrics as
Quality Indicators, IEEE Transactions on Software
Engineering. vol. 22, no. 10, pp. 751-761.
Boehm B. and Basili V. R., 2001. Software defect
reduction top-10 list, Computer, vol. 34, no. 1, pp.
135–137.
Bruntink M., and Deursen A.V., 2004. Predicting Class
Testability using Object-Oriented Metrics, 4th Int.
Workshop on Source Code Analysis and Manipulation
(SCAM), IEEE.
Bruntink M. and Van Deursen A., 2006. An Empirical
Study into Class Testability, Journal of Systems and
Software, Vol. 79, No. 9, pp. 1219-1232.
Carlson R., Do H., and Denton A., 2011. A clustering
approach to improving test case prioritization: An
industrial case study, Software Maintenance, 27th
IEEE International Conference, ICSM, pp. 382-391.
Chidamber S.R. and Kemerer C.F., 1994. A Metrics Suite
for Object Oriented Design, IEEE Transactions on
Software Engineering, vol. 20, no. 6, pp. 476–493.
Dagpinar M., and Jahnke J., 2003. Predicting
maintainability with object-oriented metrics – an
empirical comparison, Proceedings of the 10th
Working Conference on Reverse Engineering
(WCRE), IEEE Computer Society, pp. 155–164.
Elbaum S., Rothermel G., Kanduri S. and Malishevsky
A.G., 2004. Selecting a cost-effective test case
prioritization technique, Software Quality Control,
12(3):185–210.
Gupta V., Aggarwal K.K. and Singh Y., 2005. A Fuzzy
Approach for Integrated Measure of Object-Oriented
Investigating the Prioritization of Unit Testing Effort using Software Metrics
79

Software Testability, Journal of Computer Science,
Vol. 1, No. 2, pp. 276-282.
Henderson-Sellers B., 1996. Object-Oriented Metrics
Measures of Complexity, Prentice-Hall, Upper Saddle
River.
Hosmer D. and Lemeshow S., 2000. Applied Logistic
Regression, Wiley-Interscience, 2nd edition.
Kim J. and Porter A., 2002. A history-based test
prioritization technique for regression testing in
resource constrained environments, In Proceedings of
International Conference on Software Engineering.
Li W., and Henry S., 1993. Object-Oriented Metrics that
Predict Maintainability Journal of Systems and
Software, vol. 23 no. 2 pp. 111-122.
Lin C.T., Chen C.D., Tsai C.S. and Kapfhammer G. M.,
2013. History-based Test Case Prioritization with
Software Version Awareness, 18th International
Conference on Engineering of Complex Computer
Systems.
McCabe T. J., 1976. A Complexity Measure, IEEE
Transactions on Software Engineering: 308–320.
Mirarab S. and Tahvildari L., 2007. A prioritization
approach for software test cases on Bayesian
networks, In FASE, LNCS 4422-0276, pages 276–
290.
Mockus A., Nagappan N. and Dinh-Trong T. T., 2009.
Test coverage and post-verification defects: a multiple
case study, in Proceedings of the 3rd International
Symposium on Empirical Software Engineering and
Measurement (ESEM), pp. 291– 301.
Ray M. and Mohapatra D.P., 2012. Prioritizing Program
elements: A pretesting effort to improve software
quality, International Scholarly Research Network,
ISRN Software Engineering.
Rompaey B. V. and Demeyer S., 2009. Establishing
traceability links between unit test cases and units
under test, in Proceedings of the 13th European
Conference on Software Maintenance and
Reengineering (CSMR ’09), pp. 209–218.
Rothermel G., Untch R.H., Chu C. and Harrold M.J.,
1999. Test case prioritization: an empirical study,
International Conference on Software Maintenance,
Oxford, UK, pp. 179–188.
Shatnawi R., 2010. A Quantitative Investigation of the
Acceptable Risk Levels of Object-Oriented Metrics in
Open-Source Systems, IEEE Transactions On
Software Engineering, Vol. 36, No. 2.
Shihaby E., Jiangy Z. M., Adamsy B., Ahmed E. Hassany
A. and Bowermanx R., 2010. Prioritizing the Creation
of Unit Tests in Legacy Software Systems, Softw.
Pract. Exper., 00:1–22.
Toure F., Badri M. and Lamontagne L., 2014a. Towards a
metrics suite for JUnit Test Cases. In Proceedings of
the 26th International Conference on Software
Engineering and Knowledge Engineering (SEKE
Vancouver, Canada. Knowledge Systems Institute
Graduate School, USA pp 115–120.
Toure F., Badri M. and Lamontagne L., 2014b. A metrics
suite for JUnit test code: a multiple case study on open
source software, Journal of Software Engineering
Research and Development, Springer, 2:14.
Walcott K.R., Soffa M.L., Kapfhammer G.M. and Roos
R.S., 2006. Time aware test suite prioritization,
Proceedings of the International Symposium on
Software Testing and Analysis (ISSTA 2006). ACM
Press, New York, 1–12.
Wong W., Horgan J., London S., and Agrawal, H., 1997.
A study of effective regression in practice,
Proceedings of the 8th International Symposium on
Software Reliability Engineering, November, p. 230–
238.
Yu Y. T. and Lau M. F., 2012. Fault-based test suite
prioritization for specification-based testing,
Information and Software Technology Volume 54,
Issue 2, Pages 179–202.
Zhou Y. and Leung H., 2006. Empirical Analysis of
Object-Oriented Design Metrics for Predicting High
and Low Severity Faults, IEEE Transaction Software
Engineering, vol. 32, no. 10, pp. 771-789.
Zhou Y., and Leung H., 2007. Predicting object-oriented
software maintainability using multivariate adaptive
regression splines, Journal of Systems and Software,
Volume 80, Issue 8, August 2007, Pages 1349-1361,
ISSN 0164-1212.
ENASE 2017 - 12th International Conference on Evaluation of Novel Approaches to Software Engineering
80
