
How have Software Engineering Researchers been Measuring
Software Productivity?
A Systematic Mapping Study
Edson Oliveira
1
, Davi Viana
2
, Marco Cristo
1
and Tayana Conte
1
1
Universidade Federal do Amazonas (UFAM), Manaus, Amazonas, Brazil
2
Universidade Federal do Maranhão (UFMA), São Luís, Maranhão, Brazil
Keywords: Software Engineering, Software Metrics, Software Productivity, Mapping Study.
Abstract: Context: productivity has been a recurring topic, and despite its importance, researchers have not yet
reached a consensus on how to properly measure productivity in software engineering. Aim: to investigate
and better understand how software productivity researchers are using software productivity metrics.
Method: we performed a systematic mapping study on publications regarding software productivity,
extracting how software engineering researchers are measuring software productivity. Results: In total, 91
software productivity metrics were extracted. The obtained results show that researchers apply these
productivity metrics mainly focusing on software projects and developers, and these productivity metrics
are predominantly composed by Lines of Code (LOC), Time and Effort measures. Conclusion: although
there is no consensus, our results shows that single ratio metrics, such as LOC/Effort, for software projects,
and LOC/Time, for software developers, are a tendency adopted by researchers to measure productivity.
1 INTRODUCTION
Productivity has been a recurring topic since the
beginning of software engineering research.
Numerous studies have shown the importance of
productivity in Software Engineering. Researchers
have reported that: productivity is one of the
components that contribute to software quality
(Cheikhi et al., 2012); that its measurement is
necessary to assess the efficiency of software
organizations (DeMarco, 1986); that its
improvement can lower the costs and time-to-market
of software organizations (Boehm, 1987); and that it
increases their competitiveness in the market
(Aquino Junior and Meira, 2009). These findings
show that software productivity is a key topic in
Software Engineering.
Software measurement provides information on
selected objects and events, making them
understandable and controllable (Fenton & Pfleeger,
1998). Consequently, variables of interest, such as
productivity, can be evaluated and estimated.
Independent of the desired purpose, measurement is
necessary to achieve any kind of improvement in
software development, as “you cannot control what
you cannot measure” (DeMarco, 1986).
Despite the importance of software productivity
and the many existing studies involving
productivity, researchers have not yet reached a
consensus on how to properly measure productivity
in software engineering (Hernández-López et al.,
2011). This lack of consensus motivates the
execution of a systematic mapping to determine how
researchers have been measuring software
productivity and, in particular, which metrics they
have applied for that purpose.
Systematic mapping studies are designed to give
an overview of a research area through the
classification of published contributions given an
object of study. Our aim, in this study, is to perform
a systematic mapping in order to investigate how
software engineering researchers are measuring and
applying software productivity metrics.
The remainder of this paper is organized as
follows: Section 2 presents related work. Section 3
describes our adopted review protocol. Then,
Section 4 presents the results of the mapping study,
while Section 5 presents the discussion of our
results. Finally, Section 6 concludes the paper.
76
Oliveira, E., Viana, D., Cristo, M. and Conte, T.
How have Software Engineering Researchers been Measuring Software Productivity? - A Systematic Mapping Study.
DOI: 10.5220/0006314400760087
In Proceedings of the 19th International Conference on Enterprise Information Systems (ICEIS 2017) - Volume 2, pages 76-87
ISBN: 978-989-758-248-6
Copyright © 2017 by SCITEPRESS – Science and Technology Publications, Lda. All rights reser ved

2 RELATED WORK
In Software Engineering, productivity is frequently
defined, from an economic viewpoint, as the
effectiveness of productive effort, measured in terms
of the rate of output per unit of input. Consequently,
direct measures do not characterize the construct of
productivity in an economic sense of the term, i.e.,
by means of an association between some input
effort and the quantity of output obtained as result.
Petersen (2011) carried out a systematic mapping
and systematic review about software productivity
metrics. He aimed at identifying and classifying
metrics from studies on software productivity
prediction and measurement. From the set of 38
identified studies, 22 involved productivity
prediction and 16, reactive measurements of
productivity. The author also presented a
classification scheme of the extracted software
productivity metrics, based on the identified studies.
That work differs from ours in the focus of research.
Petersen (2011) only considered studies on
productivity metrics that included an evaluation of
the metric. Our systematic mapping focuses on any
study on software productivity that applies an
explicitly defined metric of productivity.
Cheikhi et al. (2012) presented a study regarding
harmonization in international standards of software
productivity. According to the authors, they figured
out key differences in these standards in order to
propose a standards-based model on software
productivity. They also proposed a software
productivity metrics model, organizing the inputs
and outputs, still based on the standards. Finally, in
their conclusion, the authors state that each work
group (of each investigated standard) used a
different point of view regarding productivity and
that a consensus between these international
standards models is not yet possible. Considering
that work, ours is not limited to international
standards, covering any productivity metric
proposed in literature.
Hernández-López et al. (2013) performed
another systematic literature review about the
measurement of software productivity. In that
review, however, they focused on the job role in
Software Engineering. Their goal was to obtain an
overview of the state of the art in productivity
measurement, assessing the inputs and outputs of
productivity metrics, in order to create new
productivity measures for software practitioners.
Their results presented two productivity measures to
assess software engineering practitioners: the
traditional SLOC/time and planning project units
per unit time. As mentioned before, our work is
different from the one by Hernández-López et al.
(2013), given its broader scope of research.
All these related studies investigated software
productivity measurements using different points of
view. Petersen (2011) mapped studies that
investigated and evaluated software productivity
measures. Cheikhi et al. (2012) investigated
productivity metrics from the point of view of
international standards. Finally, Hernández-López et
al. (2013) focused on the inputs and outputs of
software productivity measurement at the job level.
Our contribution is the investigation of software
productivity metrics from the point of view of the
researchers, i.e. how they use productivity metrics to
investigate software productivity in their studies.
3 REVIEW PROTOCOL
The main goal of a literature review, such as a
systematic mapping, is to provide an overview of a
research area by identifying the quantity, type of
research and results available within the area
(Petersen et al. 2008). According to Kitchenham &
Charters (2007), the research question specification
is the most important part of any systematic
literature review. Table 1 presents the structured
goal from our systematic mapping, following the
model proposed by Basili & Rombach (1988).
Table 1: Mapping Study's goal.
To analyze productivity metrics
for the purpose of characterize
with respect to their definition
from the point of view of researchers
in the context of
software development
and maintenance
Table 2 presents the main research question and the
sub-questions, derived from the main question. The
answers of research sub-questions help to compose
the final answer to the main question. Sub-question
SQ-1 aims to identify the abstraction, or unit of
analysis, for which the productivity metrics were
defined. SQ-2 aims to explore the definition of
productivity metrics, including their inputs, outputs,
and the used quantitative approach. Finally, the
context in which the productivity metric was defined
is addressed in SQ-3.
How have Software Engineering Researchers been Measuring Software Productivity? - A Systematic Mapping Study
77

Table 2: Questions from the Mapping Study.
Main RQ: How have Software Engineering researchers been measuring software productivity?
SQ-1 With which abstraction was the defined software productivity metric associated?
SQ-2 How was the productivity metric defined?
SQ-3 To which context was the software productivity metric defined?
3.1 Search Strategy
In any systematic literature review, not all
publications are relevant according to the proposed
objectives and the stated research questions.
Therefore, the researcher must adopt strategies and
criteria to include the relevant publications and
exclude those that are not relevant.
The publications’ search strategy for this systematic
mapping includes the selection of search engines,
the language of the studies, the publication’s type,
and the publication’s knowledge area. These
strategies aim to narrow the search scope in order to
eliminate unnecessary effort due to the noise of non-
relevant publications in the obtained results. This
happens because the query results returned by search
engines in systematic reviews often have a high
percentage of non-relevant publications (Jalali &
Wohlin, 2012).
Search engines: We chose the Elsevier Scopus
1
and ISI Web of Science
2
digital libraries to search
for the scientific publications. These two are
digital meta-libraries which, besides indexing
other digital libraries, also allow the
establishment of filters for selecting the
language, document type and area of knowledge
which were defined in our search strategy;
Publication type: Only scientific publications,
conference papers and journal were considered
for this mapping, because their content is
reviewed by other independent researchers (peer
review method);
Language: Only publications in English were
considered, due to its adoption by most
international conferences and journals;
Knowledge area: The search strategy was
narrowed to include only publications in the field
of business and software engineering. The latter
is evident given that it is the research field of this
work, while the first one is also important,
because productivity is a relevant topic of
interest to the business industry.
1
http://www.scopus.com
2
http://www.webofknowledge.com
The search string was defined using the PICO
criteria (Population, Intervention, Comparison,
Outcome), suggested by Petticrew and Roberts
(2006). These criteria facilitate the identification of
the terms for the search string.
Population: For this mapping, the population
topics are software development and
maintenance, where the productivity metrics are
applied. Therefore, we derived terms like:
software development, software maintenance,
software process, software engineering;
Intervention: Interventions are the treatment
applied to the population, which in our case are
the productivity metrics. The terms metric,
measure, measurement, and measuring were
used as synonyms for metrics. For productivity,
we defined the term productivity, performance,
efficiency and effectiveness. As these synonyms
used alone brought many publications out of
scope, we decided to use them with abstract
qualifiers. Therefore, we choose the following
abstractions: organization, process, project,
individual, programmer, developer, where
programmer and developer are synonyms for
individual. Thus, we used combinations, such as
process performance and individual efficiency;
Comparison: In a systematic mapping, we were
not interested in limiting the search to
publications that only compared their results with
some "control" variable. For this reason, this
criterion is not applicable to our systematic
mapping;
Outcome: As we were interested in any study
that involved the application of a productivity
metric, this criterion also does not apply. In this
way, we broadened our search scope to include
even studies that did not focused on productivity
metrics or their evaluation;
Table 3 presents the search string used in the two
selected search engines, according to the search
strategy defined above.
3.2 Publication Selection Criteria
The publication selection criteria aim to guarantee
the relevance of the retrieved studies by the selected
ICEIS 2017 - 19th International Conference on Enterprise Information Systems
78

Table 3: Search string used in this systematic mapping.
("software process" OR "software development" OR "software engineering" OR "software maintenance")
AND
(productivity OR
"organization efficiency" OR "process efficiency" OR "development efficiency" OR "project efficiency" OR
"programmer efficiency" OR "individual efficiency" OR "developer efficiency" OR "task efficiency" OR
"organization effectiveness" OR "process effectiveness" OR "development effectiveness" OR "project effectiveness" OR
"programmer effectiveness" OR "individual effectiveness" OR "developer effectiveness" OR "task effectiveness" OR
"organization performance" OR "process performance" OR "
development performance" OR "project performance" OR
"programmer performance" OR "individual performance" OR "developer performance" OR "task performance")
AND
(measure OR measurement OR measuring OR metric)
search engines. These selection criteria serve to filter
whether a publication will be included or excluded
from the systematic mapping. These criteria were
divided in two steps.
The criteria set for the first step was defined to
have only one criterion for inclusion and exclusion.
As mentioned above, there are many researchers that
investigate software productivity, but not all of them
have their main research focus on the productivity
metrics. Therefore, identifying whether the
publication defines a productivity metric is very
difficult if we only consider the publication title and
abstract. Consequently, we chose to simplify this
first step to include publications that investigate
software productivity, leaving the identification of a
defined productivity metric to the second step. The
criteria set for the first step is shown below, where
the acronym IC stands for inclusion criteria and the
acronym EC stands for exclusion criteria:
IC-1 – The publication title and/or summary
describes a study that investigates software
productivity in software development or
maintenance (i.e. this study investigates
software productivity, possibly defining the
productivity metrics used);
EC-1 – The publication does not meet the
inclusion criterion CI-1.
The execution of the second step involved the
complete reading of the publication. The criteria set
adopted for this second step are shown below, using
the same acronyms defined above:
IC-1 – The publication explicitly defines and
uses productivity metrics in a study to evaluate
a software development or software
maintenance.
EC-1 – The productivity metric was not
explicitly defined or was defined as a direct
measure.
EC-2 – The software productivity metric was
defined for a very specific context, i.e., such
that it would be difficult to find a similar
context outside the scope of the original study.
As an example, we cite a productivity metric
defined to measure a specific process applied in
a particular software organization.
EC-3 – Productivity metrics were not used, i.e.,
the metrics were defined in the publication, but
were neither collected nor applied to perform a
study of software productivity.
EC-4 – The publication study was published in
a vehicle that does not ensure an external review
by other researchers (peer review).
EC-5 – The publication was not written in
English or was not available online.
The proposed goal of this systematic mapping was
the basis for developing these criteria. Our intention
was to establish relevant publications as those in
which their researchers explicitly define and use a
productivity metric for evaluating a software
development or maintenance. Therefore, those
publications that only focus on the definition of a
productivity metric itself and/or only with the
purpose of productivity estimation, but do not apply
the metric for collecting data for analysis, are not
considered relevant to the scope of this systematic
mapping. The application of productivity metrics
with some data is a requirement that meets our
purposes as an indication of metric evaluation.
3.3 Data Extraction Strategy
The extraction process has the goal to extract
relevant data from the selected publications. This
systematic mapping divided the relevant data into
three specific groups: publication data, productivity
metric definition data, and publication context data.
Publication data – It helps to map how often
and in which publication venues (i.e. scientific
community) researchers have published studies
on productivity using productivity metrics. The
extracted data in this group were: publication
year, publication forum, publication title and
How have Software Engineering Researchers been Measuring Software Productivity? - A Systematic Mapping Study
79
publication authors;
Productivity definition data – The extracted
data about the productivity metric definition
were: the abstraction in which the productivity
metric was defined, and the productivity metric
definition (including its description, input and
output measures, and quantitative approach);
Context data – Contextual data is important
since metrics defined in one context usually do
not apply to other contexts (Petersen & Wohlin,
2009). The specific extracted data were: the data
source used in the publication (Industry or
Academy); the type of software development
(new development or maintenance); and the
used programming language.
We chose to employ Content Analysis for the data
analysis in this systematic mapping. This technique
has procedures for categorizing the data and for
determining the frequency of these categories.
Content Analysis facilitates data tabulation,
simplifying the analysis of the evidence (Dixon-
Woods et al., 2005).
4 RESULTS
This systematic mapping involved three researchers,
in order to reduce the bias of a single researcher
applying our research method. Two researchers
specified the review protocol and reviewed the
search strategy. A third researcher reviewed the
publication selection and execution criteria.
Regarding the first step, two researchers
independently performed the classification of a
sample of 50 randomly selected publications based
on the selection criteria. This procedure allowed the
evaluation of the classification confidence (Siegel &
Castellan, 1988). The agreement between these two
researchers was evaluated using the Kappa statistical
test (Cohen, 1960). The result of this evaluation for
the first step had a significant agreement between
the researchers (kappa = 0.699) according to the
interpretation proposed by Landis & Koch (1977).
The full version of this systematic mapping,
including all results and references, is available in a
technical report (Oliveira et al., 2017).
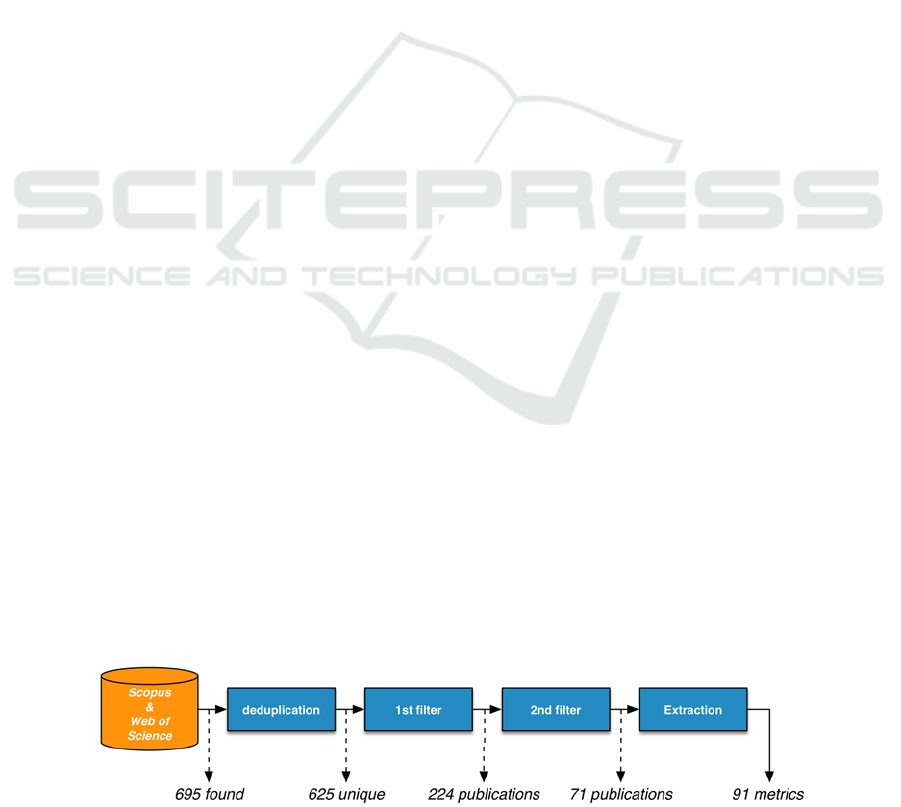
4.1 Identified Publications
We started by finding a total of 595 publications in
the Scopus digital library and 100 publications in the
Web of Science digital library. After removing
duplicated publications, the number of selected
publications to employ the first step criteria was 625.
Out of these 625 publications, we excluded 401
publications for not meeting the inclusion criteria in
this first step. The remaining 224 publications were
fully read and 71 publications remained after
carrying out the second step. At the end of this
process, we extracted a total of 91 metrics from
these 71 publications. Figure 1 summarizes the
complete selection and data extraction process.
The frequency of publications per year involving
software productivity metrics spans from the early
1980s and goes until 2015 (Figure 2). According to
our criteria, the interest of researchers in
productivity studies, using software productivity
metrics, has intensified since the early 1990s. In
particular, since 1990, in most years more than two
studies (frequency median) were published, with
some years having five or more published studies. In
two years (1991 and 2013), no study met our
criteria, but these were exceptions to the observed
trend.
4.2 Publication Venues
One of the aims from a systematic mapping is to
identify which publication venues are often used by
researchers to disseminate their work. Table 4 lists
the most popular venues (with at least three
published works) ordered by frequency.
The list in Table 4 represents more than 43% of
the publication venues. There was not a prominent
forum, i.e. one with the majority of the selected
publications. The forum with the largest number of
publications (with more than 11%) was IEEE
Transactions on Software Engineering (IEEE TSE),
followed by IEEE Software (IEEE Softw.) and by
the International Conference on Software
Engineering (ICSE), both with more than 8% of the
publications.
Figure 1: Results from the search and data extraction strategy process.
ICEIS 2017 - 19th International Conference on Enterprise Information Systems
80
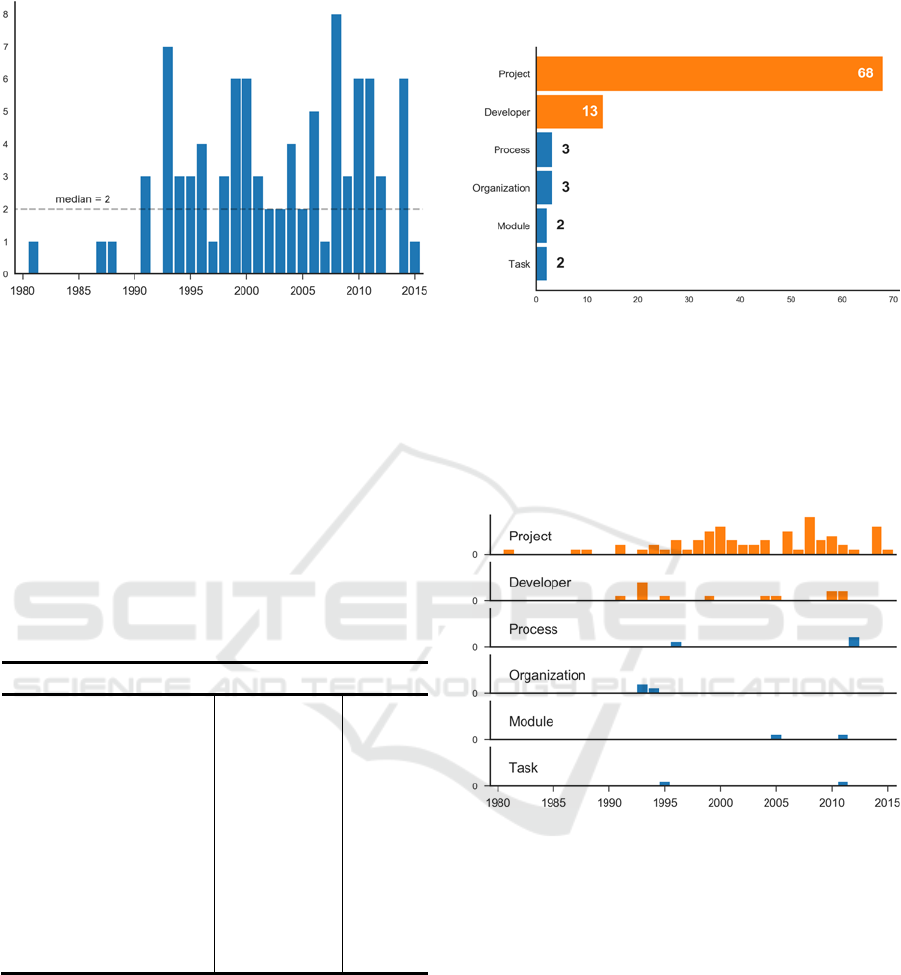
Figure 2: Frequency of publications per year.
In his systematic mapping about software
productivity metrics, Petersen (2011) also presented
a list containing the most publishing forums. His list
consisted of seven venues. Comparing his results
with ours, we note that there are four common
forums: IEEE SE, ICSE, JSS and IST. Despite the
focus differences between this mapping study and
Petersen's mapping, this result strengthens the
observation that at least these four forums are the
most frequently used forums that researchers use to
publish studies involving software productivity.
Table 4: Researcher’s used publication venues.
Forum Acronym Qty.
IEEE Transactions on
Software Engineering
IEEE TSE 8
IEEE Software IEEE Softw. 6
International Conference
on Software Engineering
ICSE 6
Journal of Systems and
Software
JSS 4
International Software
Metrics Symposium
METRICS,
ESEM
4
Journal of Information
and Software Technology
IST 3
4.3 With which Abstraction was the
Defined Software Productivity
Metric Associated? (SQ-1)
We extracted a total of 91 software productivity
metrics from the set of 71 selected publications.
Software project and software developer abstractions
were the most frequent investigated abstractions, or
unit of analysis (highlighted in orange in Figure 3).
These two abstractions stand out in frequency, when
compared to the other identified abstractions, i.e.,
task, process, organization and module.
Figure 3: Extracted productivity metrics per abstraction.
Analyzing these abstractions per year (Figure 4), we
note that since the early 90s, in almost every year,
there was at least one study on software project
productivity. We also highlight that developer
productivity studies were sparser over the years than
project productivity.
Figure 4: Frequency of publications per abstraction along
time.
The answer to SQ-1 suggests that researchers
primarily employ software productivity metrics to
evaluate software projects. Also, to a lesser extent,
despite a larger difference, researchers employ
software productivity metrics to evaluate software
developers. The other identified abstractions can be
considered isolated studies.
4.4 How was the Productivity Metric
Defined? (SQ-2)
To better analyze the results for this question, we
categorized the extracted productivity metrics’
definitions according to their structure. The structure
decomposition we adopted divided the productivity
How have Software Engineering Researchers been Measuring Software Productivity? - A Systematic Mapping Study
81
metric definition into: (i) the measures inputs and
outputs, and (ii) the used quantitative approach. The
quantitative approach is the function that results in a
productivity value when applied to these input and
output measures as arguments. The quantitative
approaches identified in this mapping were: single
ratio, weighted factors, statistical pattern and Data
Envelopment Analysis (DEA). The first two employ
a ratio between the measured inputs and outputs; the
other two employ sophisticated statistical methods to
combine the input and output measures.
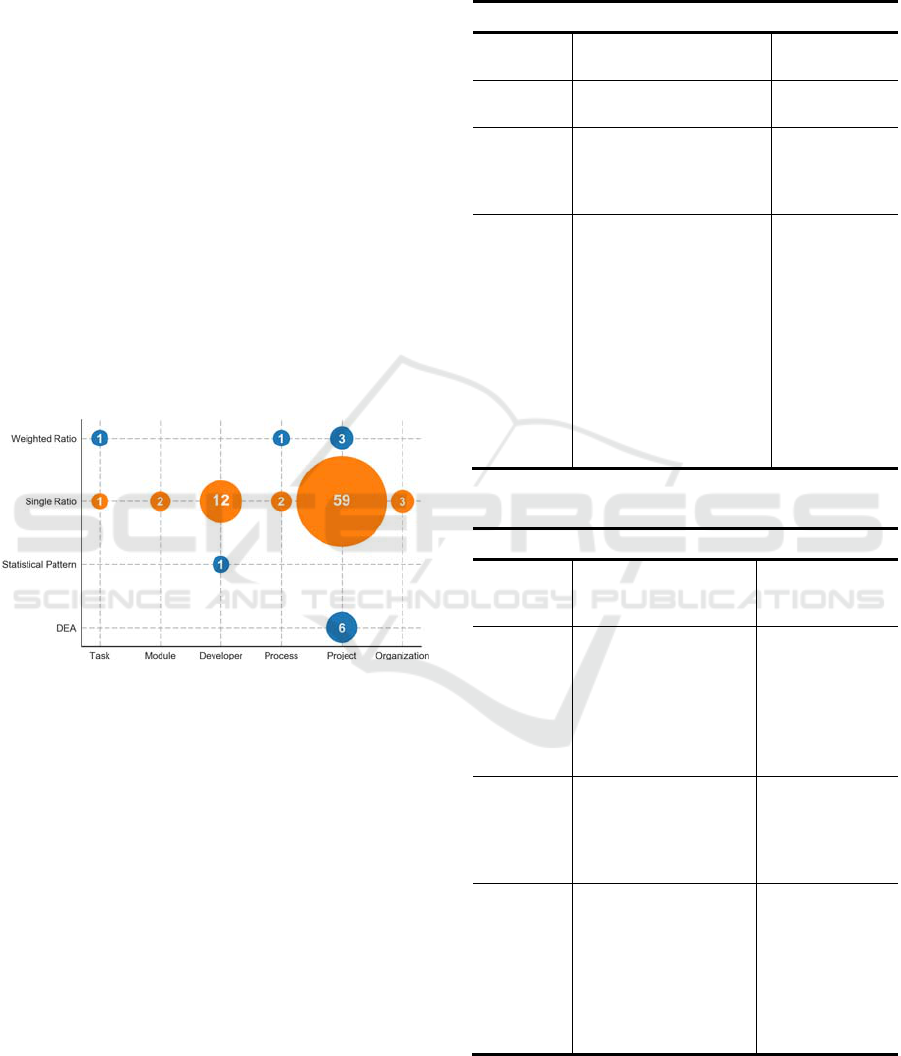
Regarding the quantitative approaches, we noticed
that single ratio was the most adopted approach
(79/91 metrics) and the only one that covers all the
identified abstractions in this systematic mapping
(Figure 5). These were highly used to measure the
productivity of software projects and developers. On
the other hand, the other quantitative approaches had
small frequencies (12/91 metrics) and did not cover
all abstractions. We can also highlight the DEA
approach for the evaluation of software projects’
productivity, with nine metrics.
Figure 5: Software productivity metrics’ quantitative
approach per abstraction.
During the decomposition of the productivity
metrics to its input and output variables, we
observed some important aspects of the metrics
definitions. Not all researchers, even if using the
same underlying metrics, define them in the same
way. Researchers use the same input and output
measures with different variable names, but with the
same measurement unit. For example, effort had
some definitions such as man-month, person-day,
developer-year and staff-month, all using person-
time units. Another example is the output size
measured in lines of code (LOC), which had
definitions such as NCLOC (non-comment lines of
code), KLOC (Kilo lines of code) and SLOC (source
lines of code).
To improve the analysis of productivity metrics,
these measures were mapped to a more general
measure. The mappings we adopted for input
measures are shown in Table 5, and the mappings
for output measures are shown in Table 6.
Table 5: Input measures mapping.
Measure Variable Name Unit Used
Person Developer person
Cost C, Man-Cost person-cost
Time
Hour, T, Time, Minute,
DevTime, TimeMonth,
Month, CycleTime, Year
hour, minute,
month, year
Effort
Developer-Hour,
Developer-Quarter,
Developer-Year, E, Eft,
EngineeringMonth, H,
Man-Day, Man-Hour,
Man-Month, Effort, PD,
PH, Man-Quarter, PM,
Man-ProjectTime, SM,
Person-Days,
Person-Month,
Staff-Hour, Staff-Month
person-hour,
person-day,
person-month,
person-
quarter,
person-year
Table 6: Output measure mapping.
Measure Variables Name Unit Used
Halstead
Effort
Halstead Effort halstead effort
Task
Number of: Classes,
Modifications,
ModificationsRequest,
ModuleModifications,
Modules, WorkItems,
Pages, Requirements
#Classes,
#Modifications,
#Modules,
#WorkItems,
#Pages,
#Requirements
FP
FP, CFP, EFP, S,
CodeSize,
OOmFPWeb, UFP,
OOFP, SM
function points
LOC
LOC, KLOC, KSLOC,
SLOC, ELOC, NLOC,
AvgLOC, WSDI, SLC,
KNCSS, LOC added,
S, SL L, CP, Size,
TotalChurn, NCLOC,
CodeContribution
lines of code
These tables show the variable name and unit used
within the publication’s definition of the
productivity metric. The last column shows the
ICEIS 2017 - 19th International Conference on Enterprise Information Systems
82
measure we decided to use in this mapping hereafter.
These mappings allowed a better aggregation of the
results and facilitate the content analysis of the
extracted productivity metrics. In these tables, we
can see that there are many variable names for
measuring Time, Effort, Task, Function Points and
Lines of Code. The diversity between Time and
Effort occurred because they were measured with
different time units. Function Points and Lines of
Code had different names because of the different
methods or strategies used by researchers. We
decided to aggregate the sum of various software
artifacts in a measure we named Task, representing
the output of a worked task.
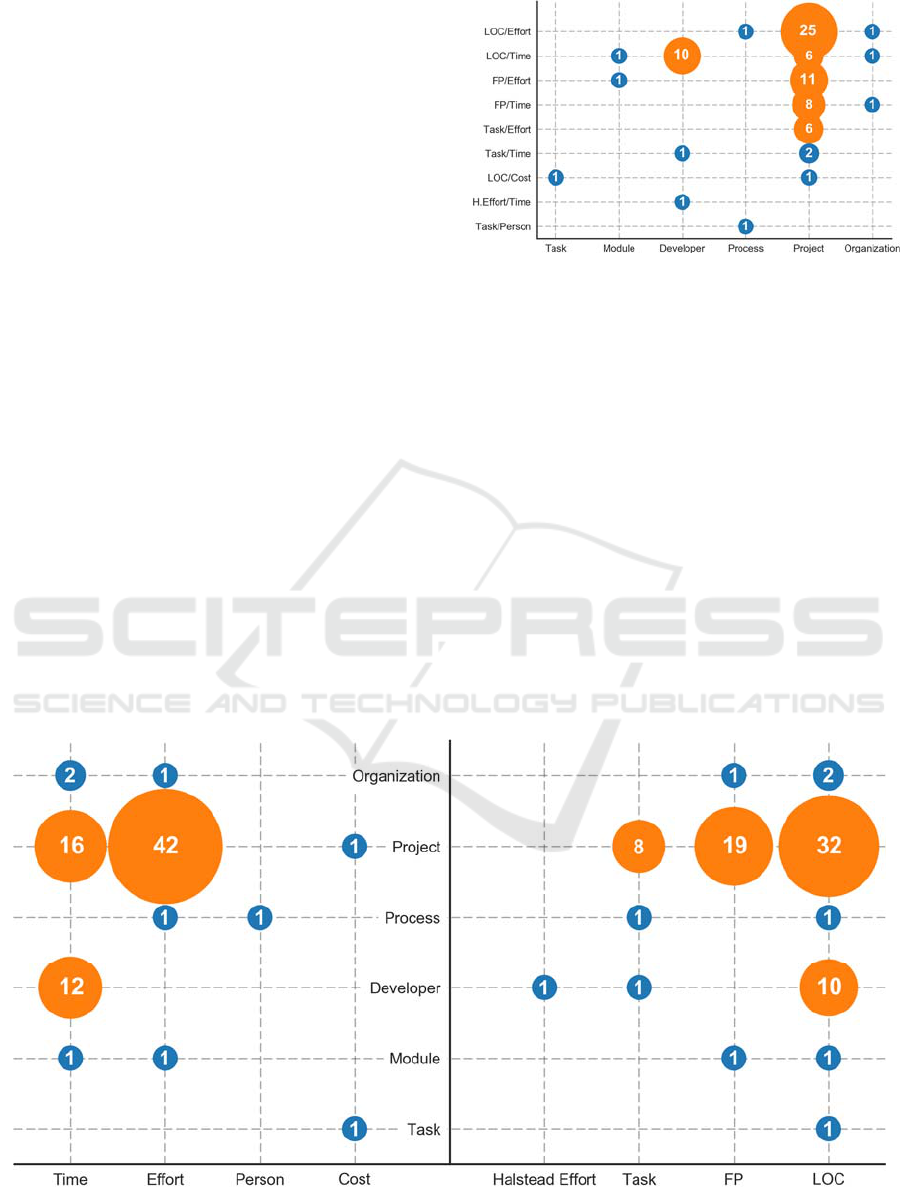
Single Ratio Productivity Metrics – Analyzing
only single ratio productivity metrics using the
mapping strategy previously explained, a total of
nine different productivity metrics approach were
obtained (see Figure 6). In this figure, the frequency
represents the number of productivity metrics from
the 79/91 productivity metrics that were extracted
from the selected publications.
In Figure 6, we highlighted productivity metrics
used by more than three publications. All these
metrics were defined for the software project
abstraction, except one that was defined for the
software developer. These metrics used only five
measures: LOC, FP and Task for output; Effort and
Time for input. These measures are used by 72
publications. LOC/Effort alone represent more than a
third of all single ratio quantitative approaches.
Figure 6: Single ratio productivity metrics per abstraction.
To further explore the definition of these metrics, we
isolated the input and output measures from the
metric definition (see Figure 7). Clearly, Lines of
Code (LOC) and Effort were the most frequently
used measures, and LOC was used by all abstracts
found in this systematic mapping. Function Points
(FP) and Time were the second most used measures
of input. In Figure 7, we highlighted measures with a
frequency above three. In this sense, Task, besides
the other already mentioned measures, was the only
other measure highlighted with a frequency above
three. Task was used to measure the developer,
process, and project. We also noticed that the most
common measures used to compose the productivity
definition for software developers were LOC and
Time. Regarding software projects, the definitions
were more diverse.
Figure 7: Input and output measures per abstraction.
How have Software Engineering Researchers been Measuring Software Productivity? - A Systematic Mapping Study
83
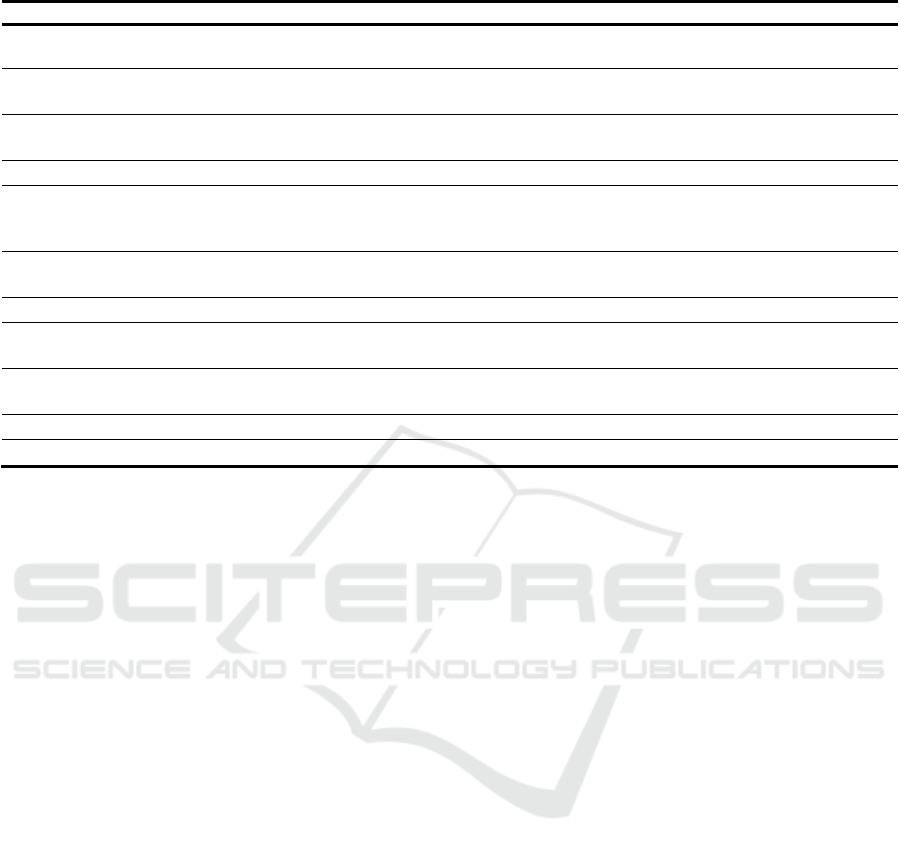
Table 7: Software productivity metrics with other quantitative approaches.
Abstraction Quantitative Approach Input Unit Output Unit
Developer Statistical Pattern Effort
Complexity/LOC
#Comments/LOC
Project DEA Constant (1)
LOC/Cost
LOC/Time
Project DEA Effort
#Users, #Interfaces
#Conversion-Programs
Project DEA Effort Function-Points, #Defects
Project DEA Effort
Function-Points
#Users, #Localities
#Business-Units
Project DEA #Developers, #Bug-Submitters
Rank (of SourceForge),
#Downloads, #Kb-Donwloaded
Project DEA Effort, Staff-Cost, Vendor-Cost LOC
Project Weighted Factors Time, %Reuse
#Web-Pages, #New-Images
#High-Effort-Functions
Project Weighted Factors Time, %Cost-of-Reuse
LOC-of-New-Code
LOC-of-Reused-Code
Process Weighted Factors Effort, Time LOC
Task Weighted Factors Time, #Tasks LOC
Other Quantitative Approaches – Considering the
other quantitative approaches, Table 7 shows the list
of eleven productivity metrics not based on a single
ratio approach (with one metric used by two
publications). Most of these metrics (8 metrics) were
defined for the software project abstraction. Data
Envelopment Analysis (DEA) was the most used
quantitative approach (with 6 metrics), being all of
its metrics devised to measure software projects. The
metrics based on the weighted factors were defined
for project, process, and task abstraction, while the
Statistical Pattern based metric was only used in a
single publication for the developer abstraction. This
statistical pattern productivity metric was defined
based on a machine learning cluster algorithm.
Considering the input and output units used in
these metrics, we can see in Table 7 that time-based
measures (Time and Effort) were also predominant
as input measures. Output measures have a great
variation of measures, although most of them
involved the software Size using either LOC or FP,
or an alternative form of counter, such as the number
of web pages, the number of functions, and others.
Finally, when answering research sub-question
SQ-2, we can state that software productivity metrics
were defined by researchers mainly by the means of
a single ratio quantitative approach. The most used
input measures in this approach were: Time and
Effort for software projects, and Time for software
developers. Lines of code (LOC) and Function
Points (FP) were the most used output measures,
being FP only used for software projects. Other
approaches were found, but most of them were used
in only one study.
4.5 To Which Context was the
Software Productivity Metric
Defined? (SQ-3)
Context is a set of environmental characteristics
where the software productivity metric was applied.
However, not all publications made clear which was
the context in which the productivity metric was
defined. The most found contextual data in the
selected publications were: source of data (industry
or academy), development type (new development or
maintenance) and the programming language used.
The majority of publications used data from
industry obtained for all abstractions (Figure 8). In
this sense, it is clear the interest in software projects
from the industry. Only a few studies used data from
the academy, covering only software projects and
developer’s productivity.
ICEIS 2017 - 19th International Conference on Enterprise Information Systems
84
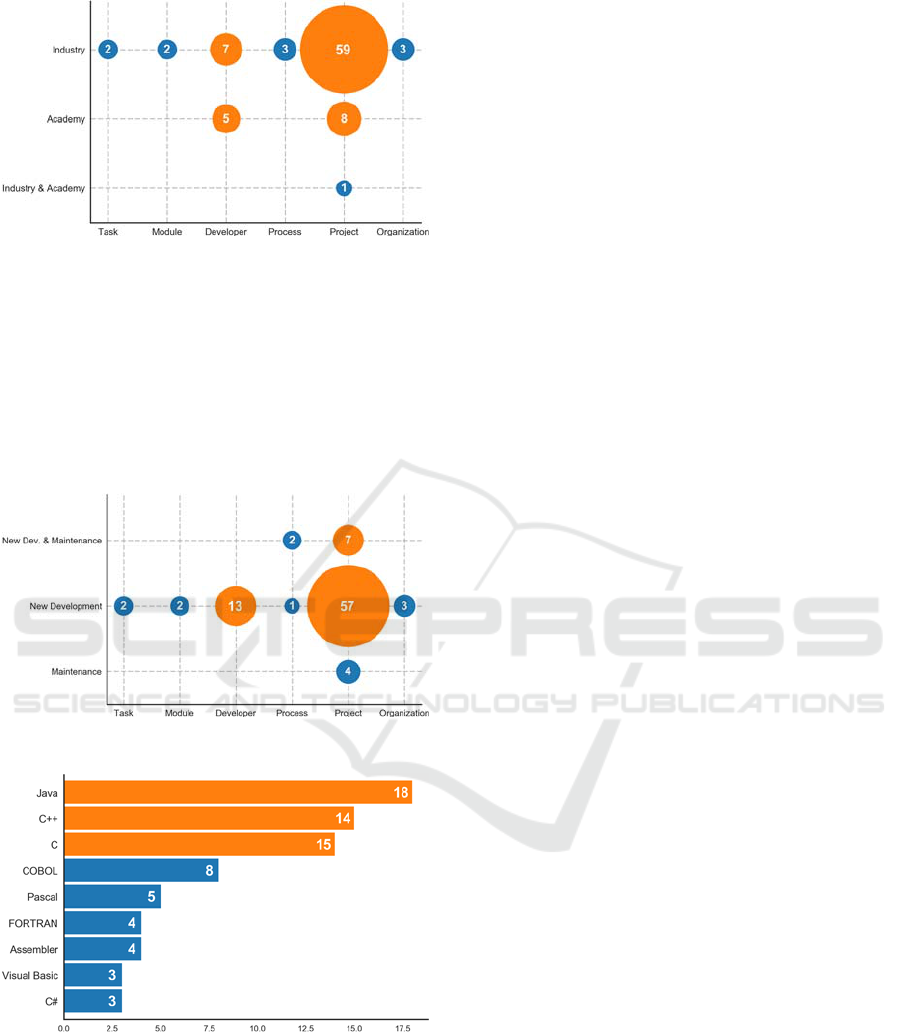
Figure 8: Data sources per abstraction.
Considering the development type, nearly all
productivity metrics were defined and used within
the context of the development of a new software
(Figure 9). Only four productivity metrics were
exclusively defined in the context of software
maintenance, evaluating software projects. Some
publications used the same metrics to evaluate both
software projects and software processes.
Figure 9: Development types per abstraction.
Figure 10: Programming languages used in the
publications.
Figure 10 shows the list of extracted programming
languages from the selected publications. The shown
languages had a frequency greater than two. A total
of 35 different programming languages were used in
the publications.
Answering research question SQ-3, the most
common context in which software productivity
metrics were defined and used by researchers was
using data coming from industry, from new software
developments, and evaluating software projects or
developers, using mainly C, C++ or Java.
5 DISCUSSION
5.1 How Have Software Engineering
Researchers been Measuring
Software Productivity? (Main RQ)
This systematic mapping aimed to analyze the
software productivity metrics applied to evaluate
software development and maintenance from the
point of view of software engineering researchers.
Most researchers investigated project and developer
productivity in new developments with data from
industry and using a single ratio productivity metric.
They mainly used Time and Effort as input
measures, and LOC as output measure. This is
surprising, mainly because this metric has received
many criticisms (Barb et al., 2014), especially from
researchers that advocate the use of function points.
Here we show that, more intensely over the past
15 years, software engineering researchers have
focused on understanding software project’s
productivity. They have been using a variety of
quantitative approaches, such as single ratio,
weighted factors, and DEA, with a variety of input
and output measures of the software development.
However, single ratio was the major choice. This is
expected, since the survival of software
organizations depends to a certain extent on the
success of their software projects.
To a smaller degree, developers were another
focus of software engineering research. The amount
of productivity metrics defined for developers
appeared second, highlighted above the other
abstractions found. This fact is also not surprising,
considering that human factors have achieved a
greater importance in the software engineering
research field (Amrit et al., 2014). However, the
interest in the developer’s productivity is still small,
which is evidenced by the number of metrics
devised to evaluate software projects’ productivity
and developer productivity. This is an even relevant
issue if we consider the role of the developer in the
software development, as it is the element that
brings more uncertainty to software projects
(Trendowicz & Münch, 2009). As result, they
How have Software Engineering Researchers been Measuring Software Productivity? - A Systematic Mapping Study
85

strongly contribute to the software project’s success
or failure.
Finally, we can answer our main research
question: software engineering researchers have
been mainly measuring productivity of software
projects and software developers from industry.
They have been measuring software projects and
software developers predominantly using
LOC/Effort and LOC/Time metrics, respectively.
The choice of these metrics is due to fact that they
are easily obtained, as pointed out by other
researchers (Boehm, 1987; Mockus, 2009;
Hernández-López et al., 2013).
5.2 Relationship to Existing Evidence
In this study, we also analyzed productivity metrics
according to their definition structure. We
considered some aspects of metrics structure, such
as the chosen abstraction, the adopted inputs and
outputs measures and the quantitative approach used
in the metrics. As previously mentioned, most
productivity metrics were defined for software
project and developers, using mainly Time and
Effort as input measure, and LOC as output measure,
integrated predominantly by a single ratio
quantitative approach.
Petersen (2011) also investigated the structure of
software productivity metrics. In his work, the
classification scheme also considered the abstraction
and quantification approach, but did not include the
input and output measures used by the identified
metrics. Comparing our results with the ones by
Petersen's (2011), we found out that the software
project was the most frequent focus of researchers,
largely outnumbering studies addressing software
developers. Comparing the quantitative approaches,
we found out that our findings were quite different.
While Petersen's (2011) results indicate that DEA,
weighted factors, event-based simulation and single
ratio were the most adopted productivity metrics,
our results indicate that single ratio was the most
frequent approach, by a large extent. These
differences are due to the different focuses of the
studies and, consequently, different adopted search
strategies.
Hernández-López et al. (2013) addressed works
in their systematic review according to the input and
output measures in software productivity metrics.
They focused on the individuals, including the
software developer. Our results, when only
considering developer’s productivity metrics,
corroborates the results found by Hernández-López
et al. (2013). Time and LOC were the most frequent
input and output measures used in productivity
metrics for software developers, respectively. These
findings are consistent with other studies (Boehm,
1987; Hernández-López et al., 2013; Meyer et al.,
2014) where Time and LOC are the most commonly
chosen input and output measures.
6 CONCLUSIONS
In this systematic mapping, we investigated how
software engineering researchers have been
measuring software productivity. From a total of 71
publications, 91 productivity metrics were identified.
We analyzed the extracted metrics using different
aspects of their definitions, such as the abstraction,
the considered inputs and outputs, the adopted
quantitative approach, the context in which these
productivity metrics were defined, and the data
source used by the researchers.
The obtained results show that most researchers
defined and used productivity metrics for software
project and developers, therefore indicating their
main focus of research. Researchers defined
productivity metrics using mainly Time and Effort as
input measure, and LOC as output measure,
integrating them largely using a single ratio
quantitative approach. A possible explanation for
these choices is that these measures are, to some
extent, easier to obtain, and that such approach is a
simple way to integrate these measures.
Every study has threats that could affect the
validity of its results (Wohlin et al., 2012). The main
threat to the conclusion validity of our systematic
mapping is the generalization of our results. We
mitigated that problem by choosing two digital
meta-libraries, that index other digital libraries from
different areas of knowledge, including two areas
where productivity is a recurrent topic. Another
threat to the validity of our results is the possibility
that the first author may have introduced his bias
during the review protocol execution. To reduce this
threat, the execution process was performed and
reviewed by other experienced researchers.
The results of our study suggest that, although
there is no consensus, a tendency of how to measure
software productivity exists. If this tendency is the
only practical way to do it, especially with data from
industry, is an open question that will guide our
future work on the measurement of software
productivity. One possible future work is to compare
this result with a survey on how practitioners
measure productivity. Finally, we hope that our
findings may contribute to the evolution and the
ICEIS 2017 - 19th International Conference on Enterprise Information Systems
86

improvement of the research field of software
engineering productivity.
ACKNOWLEDGEMENTS
We thank the financial support granted by SEFAZ,
FAPEAM, through process number 062.00578/2014,
CAPES, and CNPq. Finally, we also thank the
researchers of USES group for their support during
this study.
REFERENCES
Amrit, C., Daneva, M. & Damian, D., 2014. Human
factors in software development: On its underlying
theories and the value of learning from related
disciplines. A guest editorial introduction to the
special issue. Information and Software Technology,
56(12), pp.1537–1542.
Aquino Junior, G.S. de & Meira, S.R.L., 2009. Towards
effective productivity measurement in software
projects. In Proceedings of the 4th International
Conference on Software Engineering Advance. IEEE,
pp. 241–249.
Barb, A.S., Neill, J., Sangwan, S., Piovoso, J., 2014. A
statistical study of the relevance of lines of code
measures in software projects. Innovations in Systems
and Software Engineering, pp.243–260.
Basili, V.R. & Rombach, H.D., 1988. Tame Project:
Towards Improvement-Oriented Software
Environments. IEEE Transactions on Software
Engineering, 14(6), pp.758–773.
Boehm, 1987. Improving Software Productivity.
Computer, 20(9), pp.43–57.
Cheikhi, L., Al-Qutaish, R.E. & Idri, A., 2012. Software
Productivity: Harmonization in ISO/IEEE Software
Engineering Standards. Journal of Software, 7(2),
pp.462–470.
Cohen, J., 1960. A coefficient of agreement of nominal
scales. Educational and Psychological Measurement,
20(1), pp.37–46.
DeMarco, T., 1986. Controlling Software Projects:
Management, Measurement, and Estimation, Upper
Saddle River, NJ: Prentice Hall PTR.
Dixon-Woods, Agarwal, M., Jones, S., Young, D., B.,
Sutton, A., 2005. Synthesising qualitative and
quantitative evidence: a review of possible methods.
Journal of Health Services Research and Policy,
10(1), pp.45–53.
Fenton, N.E. & Pfleeger, S.L., 1998. Software Metrics: A
Rigorous and Practical Approach 2nd ed., Boston,
MA, USA: PWS Publishing Co.
Hernández-López, A., Colomo-Palacios, R., García-
Crespo, A., Cabezas-Isla, F., 2011. Software
Engineering Productivity: Concepts, Issues and
Challenges. International Journal of Information
Technology Project Management, 2(1), pp.37–47.
Hernández-López, A., Colomo-Palacios, R. & García-
Crespo, Á., 2013. Software Engineering Job
Productivity—a Systematic Review. International
Journal of Software Engineering and Knowledge
Engineering, 23(3), pp.387–406.
Jalali, S. & Wohlin, C., 2012. Systematic literature
studies: Database Searches vs. Backward Snowballing.
In Proceedings of the ACM-IEEE international
symposium on Empirical software engineering and
measurement - ESEM ’12. New York, New York,
USA: ACM Press, p. 29.
Kitchenham, B. & Charters, S., 2007. Guidelines for
performing Systematic Literature Reviews in Software
Engineering, Keele, UK.
Landis, J.R. & Koch, G.G., 1977. The Measurement of
Observer Agreement for Categorical Data. Biometrics,
33(1), p.159.
Meyer, A.N., Fritz, T., Murphy, G. C., Zimmermann, T.,
2014. Software developers’ perceptions of
productivity. In Proceedings of the 22nd ACM
SIGSOFT International Symposium on Foundations of
Software Engineering. New York, New York, USA:
ACM Press, pp. 19–29.
Mockus, A., 2009. Succession: Measuring transfer of code
and developer productivity. In Proceedings of the
2009 IEEE 31st International Conference on Software
Engineering. Vancouver, BC: IEEE, pp. 67–77.
Oliveira, E., Viana, D., Cristo, M. & Conte, T., 2017. “A
Systematic Mapping on Productivity Metrics in
Software Development and Maintenance”, TR-USES-
2017-0002. Available online at:
http://uses.icomp.ufam.edu.br/relatorios-tecnico.
Petersen, K., Feldt, R., Mujtaba, S., Mattsson, M., 2008.
Systematic mapping studies in software engineering.
EASE’08 Proceedings of the 12th international
conference on Evaluation and Assessment in Software
Engineering, pp.68–77.
Petersen, K. & Wohlin, C., 2009. Context in industrial
software engineering research. 2009 3rd International
Symposium on Empirical Software Engineering and
Measurement, ESEM 2009, pp.401–404.
Petersen, K., 2011. Measuring and predicting software
productivity: A systematic map and review.
Information and Software Technology, 53(4), pp.317–
343.
Petticrew, M. & Roberts, H., 2006. Systematic Reviews in
the Social Sciences: A Practical Guide,
Siegel, S. & Castellan, N.J., 1988. Nonparametric
statistics for the behavioral sciences (2nd ed.),
Trendowicz, A. & Münch, J., 2009. Factors Influencing
Software Development Productivity - State of the Art
and Industrial Experiences. Advances in Computers,
77(9), pp.185–241.
Wohlin, C., Runeson, P., Höst, M., Ohlsson, M., Regnell,
B., Wesslén, A., 2012. Experimentation in Software
Engineering, Berlin, Heidelberg: Springer Publishing
Company, Incorporated.
How have Software Engineering Researchers been Measuring Software Productivity? - A Systematic Mapping Study
87
