
A Cross-layer Monitoring Solution based on Quality Models
Damianos Metallidis, Chrysostomos Zeginis, Kyriakos Kritikos and Dimitris Plexousakis
ICS-FORTH, Heraklion, Crete, Greece
Keywords:
Quality Models, Dependencies, Monitoring, Cross-layer, Metric Aggregators.
Abstract:
In order to implement cross-organizational workflows and to realize collaborations between small and medium
enterprises (SMEs), the use of Web service technology, Service-Oriented Architecture and Infrastructure-as-a-
Service (IaaS) has become a necessity. Based on these technologies, the need for monitoring the quality of (a)
the acquired resources, (b) the services offered to the final users and (c) the workflow-based procedures used
by SMEs in order to use services, has come to the fore. To tackle this need, we propose four metric Quality
Models that cover quality terms for the Workflow, Service and Infrastructure layers and an additional one for
expressing the equality and inter-dependency relations between the previous ones. To support these models
we have implemented a cross-layer monitoring system, whose main advantages are the layer-specific metric
aggregators and an event pattern discoverer for processing the monitoring log. Our evaluation is based on the
performance and accuracy aspects of the proposed cross-layer monitoring system.
1 INTRODUCTION
Nowadays, many organizations form dynamic co-
operations in order to effectively deal with market
requirements. Companies focus on their core busi-
ness and goals whilst outsourcing secondary activi-
ties to other organizations. To enable co-operation
between organizations, the information processing in-
frastructures of the participating SMEs need to be
linked. Workflow management systems that con-
trol the processes in the individual SMEs are a key
feature. Moreover, in order to implement cross-
organisational workflows and to realise collaborations
between SMEs, the use of Web service technology
and service-oriented architecture has become a neces-
sity. Whilst, SMEs are continuously moving towards
service-oriented infrastructures, the need of hosting
them has raised an important issue for the quality of
the underlying cloud infrastructures, the services of-
fered to final users, as well as of the workflow-based
procedures used by SMEs.
Cross-layer monitoring of Service-Based Appli-
cations (SBAs) is the continuous and closed loop pro-
cedure of measuring, monitoring, reporting, and im-
proving the Quality of Service (QoS) of systems and
applications delivered by service-oriented solutions.
Monitoring involves several distinct activities includ-
ing (a) logging and analysis of execution details of the
workflow, service and infrastructure functional lay-
ers (b) obtaining metrics for each of one of them,
(c) detecting situations that require management at-
tention and (d) determining appropriate control ac-
tions. State-of-the-art research in this area reveals that
most approaches are based on individual layers with-
out considering the cross-layer dependencies (Zegi-
nis et al., 2013) that Quality Models (QMs) might
have (Seth et al., 2005). In order to address the quality
aspects of a monitoring framework dealing with the
three functional layers of a SBA (i.e. Workflow, Ser-
vice and Infrastructure), we introduce a monitoring
framework that is based on three layer-specific QMs,
along with an additional dependency QM, catering for
the cross-layer relationships between quality metrics
defined in the three QMs. Finally, the proposed mon-
itoring framework stands on top of our previous re-
search work (Zeginis et al., 2015) that emphasizes on
the processing of the aggregated monitoring data, so
as to detect critical event patterns that lead to specific
Service Level Objective (SLO) violations.
The rest of the paper is structured as follows. Sec-
tion 2 summarizes the related work, Section 3 intro-
duces the cross-layer monitoring framework, while
Section 4 defines the QMs and Section 5 provide de-
tails for the quality metrics aggregation. Section 6 de-
scribes an event pattern detection mechanism, while
Sections 7 and 8 provide implementation details and
experimental results respectively. Finally, Section 9
concludes and provides future work directions.
Metallidis, D., Zeginis, C., Kritikos, K. and Plexousakis, D.
A Cross-layer Monitoring Solution based on Quality Models.
DOI: 10.5220/0006306305070514
In Proceedings of the 7th International Conference on Cloud Computing and Services Science (CLOSER 2017), pages 479-486
ISBN: 978-989-758-243-1
Copyright © 2017 by SCITEPRESS – Science and Technology Publications, Lda. All rights reserved
479

2 RELATED WORK
Monitoring of SBAs have attracted the interest of
many researchers in the recent years. Many ap-
proaches have been proposed, mainly at the Service
layer, however most of them are fragmented and focus
only on one layer disregarding the possible mapping
of metric data values among the layers.
In (Alhamazani et al., 2015) researchers devel-
oped and validated CLAMBS, Cross-Layer Multi-
Cloud Application Monitoring and Benchmarking as-
a-Service for efficient QoS monitoring and bench-
marking of cloud applications hosted on multi-clouds
environments. Advantage of CLAMBS is its ca-
pability of monitoring and benchmarking individ-
ual application components, such as databases and
web servers, distributed across cloud layers (*-aaS),
spread among multiple cloud providers. In (Calero
and Gutierrez, 2015), a novel monitoring architec-
ture is addressed that deals with the aspect of cloud
provider and cloud consumer. This architecture of-
fers a monitoring PaaS to each cloud consumer that
allows to customize the monitoring metrics. This is
accomplished by the means of an adaptive distributed
monitoring architecture automatically deployed in the
cloud infrastructure. Kazhamiakin et al. (Kazhami-
akin et al., 2009) define appropriate mechanisms and
techniques to address monitoring in an integrated
cross-layer framework. More precisely, they have
stated the problem of cross-layer SBA monitoring and
adaptation on a series of case studies and define the re-
quirements for the integrated approaches that provide
coherent solutions to monitor and adapt the whole ap-
plication. In (Guinea et al., 2011), authors present
an integrated approach for monitoring and adapting
multi-layered SBAs. The approach comprises four
main steps: a) monitoring and correlation, b) anal-
ysis of adaptation needs, c) identification of multi-
layer adaptation strategies and d) adaptation enact-
ment. Their main goal is to reveal correlations be-
tween what is being observed at the software and at
the infrastructure layer to enable global system rea-
soning.
Many layer-specific approaches regarding
QMs, (Joshi et al., 2011) (Cardoso et al., 2002)
are based on stochastic models and probabilistic
theory having as a major concern the scalability of
the cloud resources based on quality metric results.
Several approaches have been proposed capturing
infrastructure QMs with focus on cloud resources.
Authors in (Bardsiri and Hashemi, 2014) define
QMs which support the evaluation of public cloud
services; the validation of these QMs is performed
according to empirical case studies without taking
into account the relations that Workflow Quality
Model (WM), Infrastructure Quality Model (IM)
and Service Quality Model (SM) can have between
them. In (Gomez-Perez et al., 2013), the authors
introduce the hypothesis that reliability of workflows
can be notably improved by advocating scientists to
preserve a minimal set of information that is essential
to assist the interpretations of these workflows and
hence improve their reproducibility and reusability.
More precisely two quality dimensions were ap-
proached, (a) the stability of a workflow defined as a
measurement of the ability of a workflow to preserve
its properties through time and (b) the reliability of a
workflow defined as a measurement for converging
towards a scenario free of decay, i.e. complete and
stable through time.
In order to state the advantages and disadvan-
tages of the research approaches, we have conducted
a comparison of the aforementioned approaches (Ta-
ble 1), based on certain criteria indicating the support
of quality metrics for each of the functional layers.
3 CROSS-LAYER MONITORING
ARCHITECTURE
In (Zeginis et al., 2013) we have already proposed
a cross-layer monitoring and adaptation framework
for SBAs. In this section we introduce an enhanced
framework (Figure 1) focusing on the monitoring
part. The main idea of our approach is that mea-
surements at different layers are encapsulated by sen-
sors attached to respective layer-specific components
and that these measurements are stored in databases.
The core functionalities of this cross-layer monitoring
framework are (i) gathering of monitoring data, (ii)
assessment of monitoring data and (iii) storing them
in a time-series database (TSDB) (Namiot, 2015).
The architecture of the proposed distributed mon-
itoring framework consists of three Monitoring Man-
agers for the Workflow, Service and Infrastructure
layers. In each of these layers a metric aggregator and
an assessment component exist, which are responsi-
ble for (a) collecting and calculating metric measure-
ments based on the respective QM and (b) passing
them to the assessment component which is responsi-
ble for the detection of specific Service Level Object
(SLO) violations.
• Service and Infrastructure Monitoring managers
provides the following functionalities
– Aggregation of information based on the qual-
ity metrics that we defined in each of the layers.
CLOSER 2017 - 7th International Conference on Cloud Computing and Services Science
480
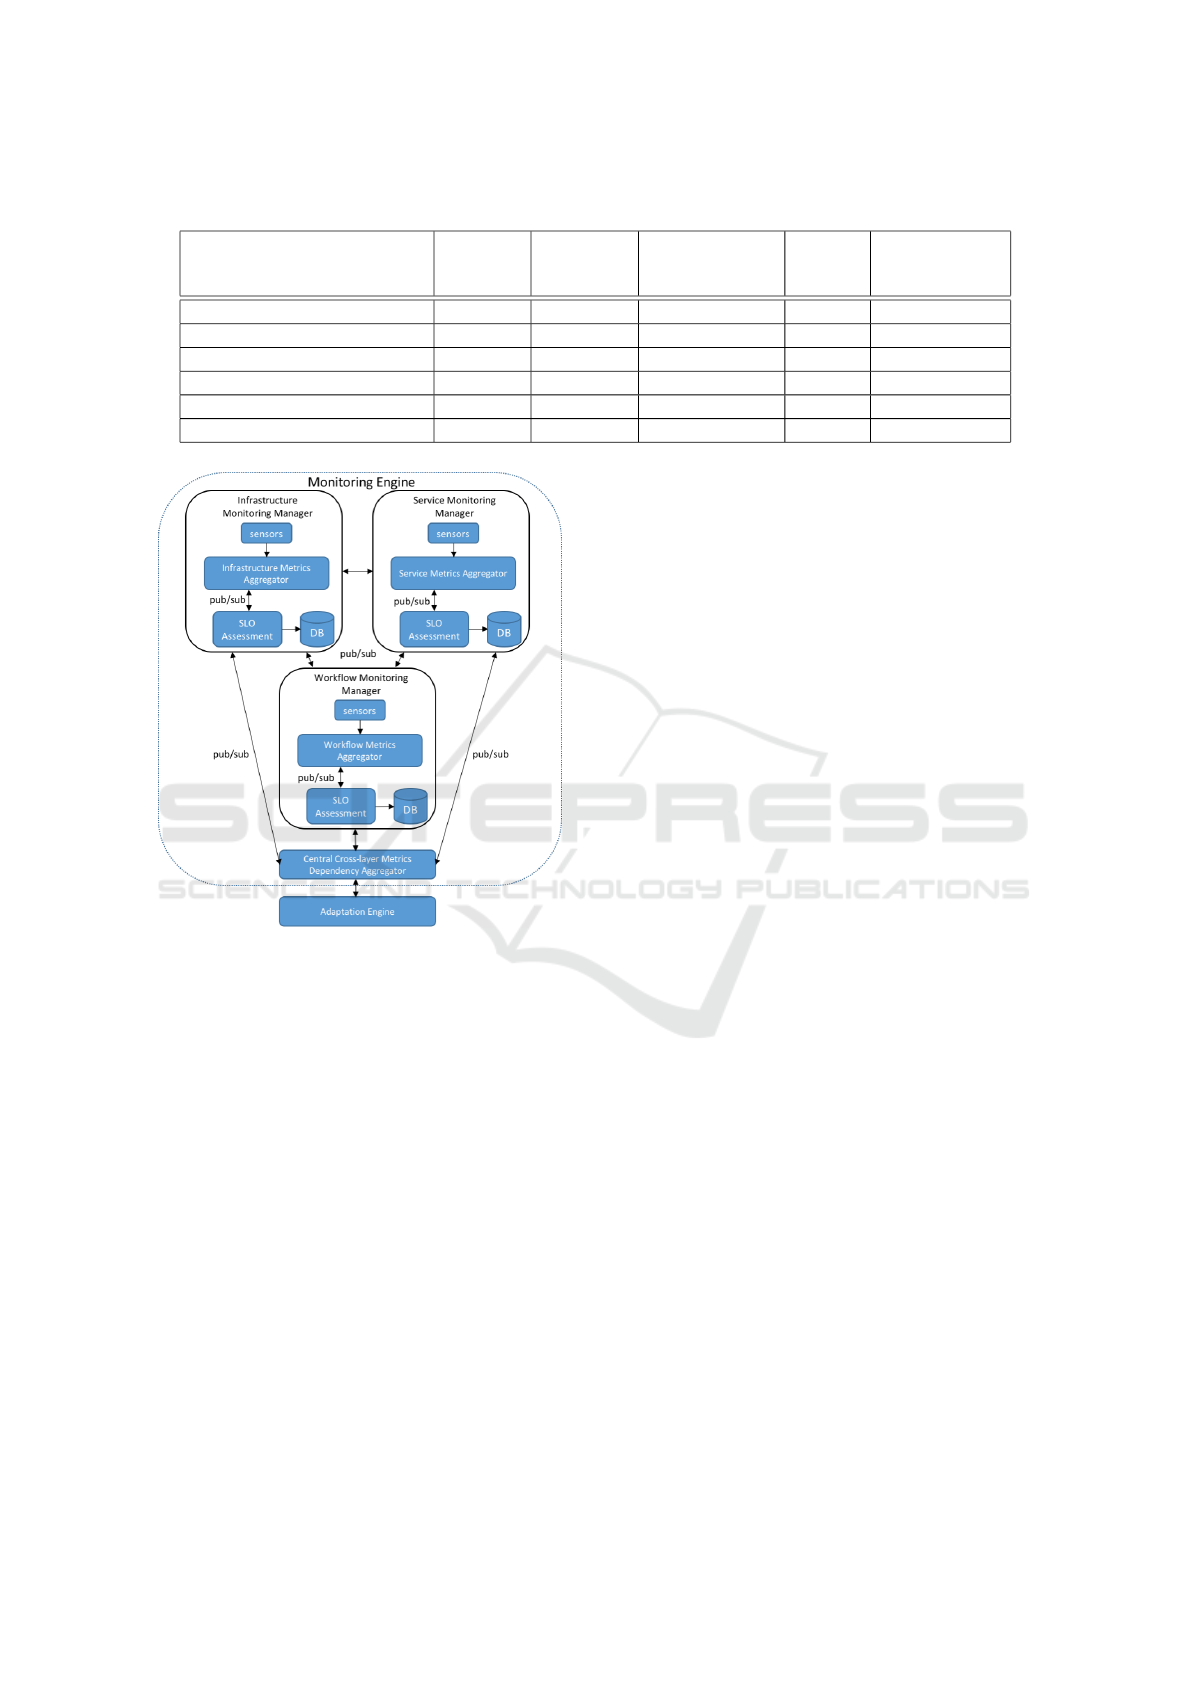
Table 1: Comparison of monitoring research approaches.
Business
Layer
Workflow
Layer
Infrastructure
Layer
Service
Layer
Cross-Layer
Metric
Dependencies
(Kazhamiakin et al., 2009) X X X
(Guinea et al., 2011) X X partially
(Gomez-Perez et al., 2013) X
(Alhamazani et al., 2015) X X
(Calero and Gutierrez, 2015) X X
Proposed approach X X X X
Figure 1: Architecture of monitoring framework.
– Assessment of the aggregated information in
order to detect SLO violations.
– Storing of the aggregated data to the manage-
ment database. According to the level of the
aggregation being supported where in this case
we selected to store metric data in TSBD in-
stances.
– As the cross-layer dependencies have been
spotted, Service and Infrastructure managers
propagates the measurement in the instance of
WM in order to fill possible metric values that
where identified during the cross-layer depen-
dency done. The propagation is done from
lower to higher levels e.g, SM to WM.
• The Workflow Monitoring manager additionally
supports:
– The functionality of a dependency aggregator
which actually implements the cross-layer de-
pendency model that has been defined. We have
added this required functionality on the Work-
flow Monitor Manager in order to expose cross-
layer dependencies detected within the same
public cloud sector.
Finally, the Cross-Layer Dependency Metrics Ag-
gregator collects metrics from the three layers and
aggregated information indicating the cross-layer de-
pendencies and provides the following functionali-
ties: (a) publish the SLO violations to the adaptation
engine in order to decide on the best adaptation ac-
tions, (b) infers the detected patterns of monitoring
data to the Pattern Discoverer implemented in (Zegi-
nis et al., 2013).
4 QUALITY MODELS
As already introduced in (Metallidis et al., 2016),
quality metric models, quality metrics, calculation
formulas and particular types of metric relationships
are defined in a formal way in order to indicate the
structure of the respective layer. We have structurally
separated the quality terms in two major categories:
(i) Quality dimensions describe the quality aspect
which can be used to provide an aspect-specific par-
tition of quality terms. Quality dimensions are inde-
pendent of the layer that a term maps to, (ii) Quality
attributes are properties of an object which are mea-
sured by metrics.
At the Workflow layer we define four main quality
dimensions: (i) time, (ii) cost, (iii) reliability, and (iv)
security. Time quality dimension is a fundamental as-
pect of performance that describes the time needed
in order to measure, execute, record, respond and tra-
verse through operations. Cost quality dimension rep-
resents the cost associated with operations (e.g the
provision of VM) and the execution of procedures. It
is an important factor to evaluate whether organiza-
tion still follows precisely their financial plan. Relia-
bility dimension refers to the likelihood that a compo-
nent (e.g workflow, task, service) will not malfunction
A Cross-layer Monitoring Solution based on Quality Models
481

or fail during the workflow execution. Finally, secu-
rity quality dimension indicates the degree at which
components and systems are free from unauthorized
accesses or change, subject to policy.
At the Service layer we define five main quality di-
mensions: (i) performance, (ii) stability, (iii) scalabil-
ity, (iv) elasticity and (v) security. The performance
dimension refers to the velocity of a Web service to
respond to any request. Stability quality dimension
indicates the ability to provide reliable, continuous,
adaptable, consistent and recoverable services despite
undesired situations like increased load, congestion,
system failure and natural disasters. Service scalabil-
ity (Herbst et al., 2013) is defined as the ability of a
service to scale when additional workload is received
to still keep up with the SLOs promised (e.g., when
reaching maximum capacity for the service, the capa-
bility of the application encompassing additional re-
sources in order to still satisfy its performance goals).
Similarly, elasticity quality dimension is the degree
at which a software system is able to autonomously
scale the amount software instances or stretch the cur-
rent VMs exploited (scale up) based on workload fluc-
tuations e.g when the client expects to call a service
(possibly multiple times) and gets a result according
to the respective quality constraints posed. Finally,
security dimension describes the means of providing
AAA (auditability, authorisability and authenticity),
confidentiality, and non-reputability (Trimintzios, ).
At the Infrastructure layer we define five quality
attributes: (i) performance, (ii) networking, (iii) CPU
utilization, (iv) memory and storage, (v) PaaS/IaaS
scalability and elasticity and one quality dimension
for security. Performance quality attribute is being
used in order to characterize the underlying clouds
infrastructure performance in terms of response times
upon actions of VM deployment/redeployment, soft-
ware deployment/re-deployment, migration of ser-
vice instances between different VMs and replica-
tion of software components between types of dif-
ferent VMs. Networking quality attribute character-
izes the quality of network between a data center’s
SaaS/Application provider and the client of SaaS.
Bandwidth quality attribute characterizes the volume
of information per unit of time that a transmission
medium (e.g., I/O device, Network Interface Con-
troller) can handle. Quality attribute of CPU utiliza-
tion depicts the level at which processors are being
leveraged within a cloud infrastructure in favor of a
client under the two different types of hypervisors.
For accessing and storing data we have defined met-
rics for the quality attributes of memory and stor-
age for the following types: RAM and Hard Disks.
PaaS/IaaS Scalability is the ability of the underly-
ing infrastructure to sustain increasing workloads by
making use of additional resources, which are directly
requested, including all the hardware and virtualiza-
tion layers. The differentiation from the security qual-
ity dimensions at the service layer is that we consider
system components like VMs instead of service com-
ponents in order to calculate the corresponding met-
rics.
To formalize relationships between quality met-
rics across the three layer-specific QMs we have con-
sidered an initial set of cross-layer dependencies in
the form of a Dependency Quality Model. These de-
pendencies indicate that (a) the computation of a met-
ric at one layer can be used for the (partial) computa-
tion of a relevant metric at another layerand (b) metric
values from different layers that are inter-dependent,
for example the high or low value of a metric in one
layer can affect the value of a metric in another layer.
Relevance could map to either both metrics belong-
ing to the same quality dimension, or being described
by similar quality attributes. The measurability of
all metrics defined is guaranteed via the cross-layer
dependencies of the metric aggregation formulas and
the fact that raw quality metrics with no dependencies
can be calculated by sensors placed by the distributed
monitoring system on one of the respective layers.
5 QUALITY METRICS
AGGREGATION
The proposed monitoring framework comprises three
metric aggregators, responsible for gathering the
layer-specific metric values and pushing them to the
time-series database. The service layer aggregator de-
picted in Figure 2 performs aggregation in four steps.
In the first step, Prometheus API client
1
, is used for
monitoring the service layer client calls by retriev-
ing raw metric data. Then, at the aggregation phase
the aggregator calculates the raw metric data and ag-
gregates them based on the definitions of composite
metrics made in SM, whilst on the third step metric
values are being pulled from KairosDB
2
time-series
database in case they are required for the calculation
of data metrics based on historic data values, (Met-
allidis et al., 2016). At the final step the aggregator
pushes the values of raw and composite metrics to the
TSDB.
The Infrastructure layer aggregator similarly per-
forms aggregation in three steps (Figure 3). In the
first step, we use JSON Exporter of Nagios monitor-
1
https://prometheus.io/
2
https://kairosdb.github.io/
CLOSER 2017 - 7th International Conference on Cloud Computing and Services Science
482
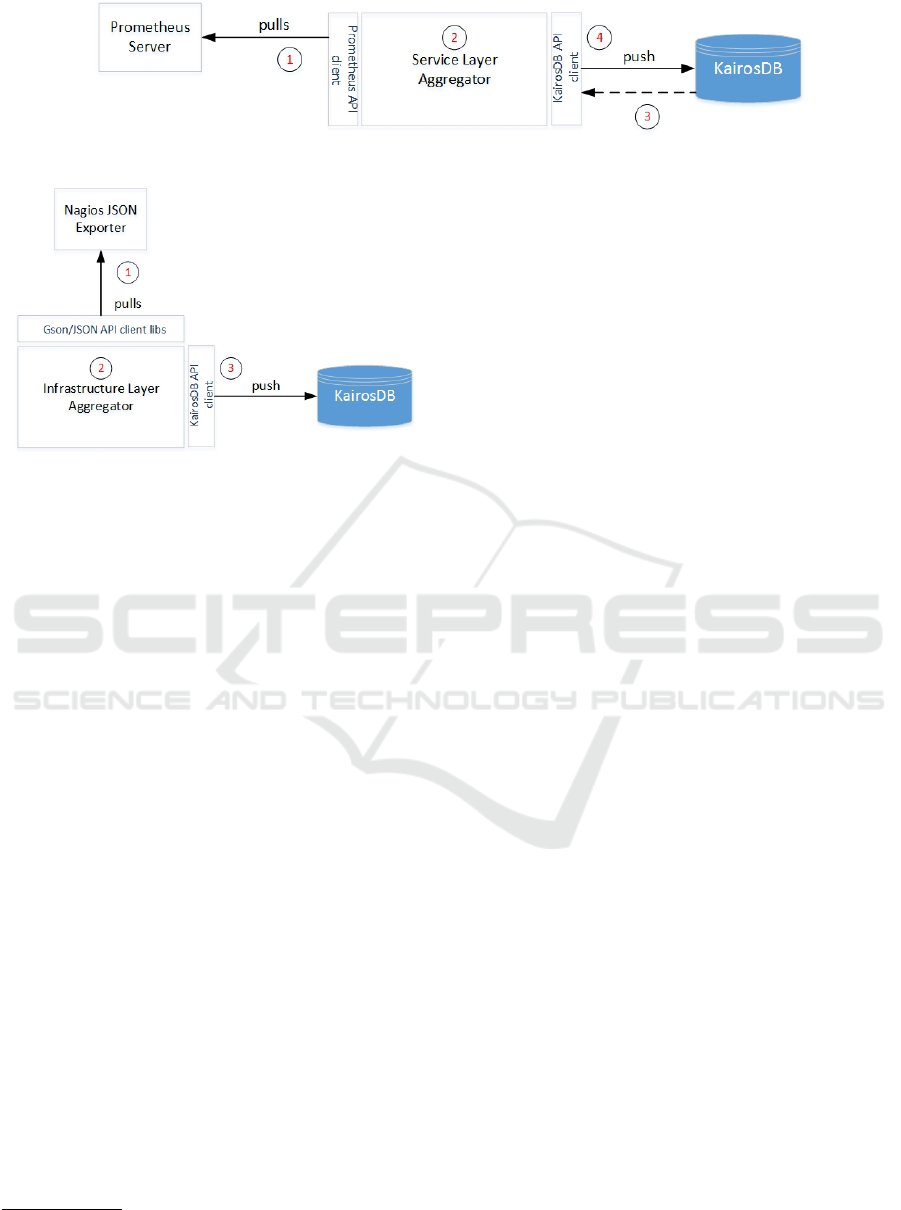
Figure 2: Architecture of Service layer aggregator.
Figure 3: Architecture of Infrastructure layer aggregator.
ing tool
3
and appropriate Java client libraries that ma-
nipulate JSON objects, in order to retrieve data for
each of the raw metrics. At the second step the aggre-
gation of the composite metrics takes place. We ag-
gregate and push metrics every one minute, in order
to be uniform with the frequency selection of service
layer aggregator which also aggregates and push val-
ues every minute. Aggregations are performed out-
side KairosDB, in plain Java classes, as the possible
usage of a KairosDB aggregator would add unneces-
sary complexity to the implementation of the aggre-
gator. At the third step we push the composite metric
data to the KairosDB.
There is a separation of the workflow aggrega-
tor and the dependency aggregator although in our
implementation they are deployed on the same VM.
The workflow aggregator collects raw metrics at the
workflow layer and then aggregate them as soon as
the workflow reaches the endpoint. In order to pro-
vide runtime monitoring, we have used the Listen-
ers that Activiti
4
workflow engine offers. When the
flow reaches the endpoint, then a listener is responsi-
ble for the collection and aggregation of the metrics.
Listeners are the major components in the procedure
of monitoring at the Workflow layer. The reason that
both of the workflows have the same endpoint in Fig-
ure 4, is that the collection and aggregation part is
the same for all the workflows operating within the
worklfow management engine. On the second step,
as soon as the the aggregations are completed, we use
3
https://www.nagios.org/
4
http://activiti.org/
the KairosDB client API which makes the appropri-
ate calls on the KairosDB instance of the workflow
layer VM. We have decided to perform the gather-
ing of the metric information on the endpoint of each
of the workflows, that is a sign that they have com-
pleted successfully. However, in cases of failures, Ac-
tiviti provides an in-memory database were historic
values are stored during the execution of each of the
tasks, thus we can retrieve possible lost values from
the aforementioned database.
There are two types of cross-layer dependencies
that we take into consideration in our approach, (i) de-
pendencies between the Service layer and the Work-
flow layer metrics and (ii) dependencies between
the Infrastructure layer and the Service layer met-
rics. Thus, the cross-layer dependency aggregator
is responsible for collecting the dependency metrics
and for calculating the respective metric value at the
higher layer. In order to pass the dependency met-
rics from lower to higher layers, we have used a pub-
lish/subscribe system. For instance, if we are inter-
ested in a dependency metric between the service and
the workflow layers, as the service monitoring sys-
tem generates a number of raw and composite metric
values, we should limit the retrieved metrics to the
ones that concerns the executed workflow instance.
To achieve this, the publisher passes only the values of
the dependency occurred during the execution of the
specific workflow instance. Once the dependency val-
ues of the composite cross-layer dependency metrics
are calculated, they are pushed to the local database.
6 PROCESSING THE
MONITORING LOG
Once aggregators have retrieved and stored the ag-
gregated metric values to the central time-series
database, the event pattern detection components
starts traversing the execution log in order to detect
critical event patterns that might lead to violations of
composite SLOs. In a previous work (Zeginis et al.,
2015) we have introduced a logical approach to dis-
cover such type of event patterns. Very briefly, in this
approach we proposed an offline deterministic algo-
rithm for discovering frequent event patterns (i.e. as-
A Cross-layer Monitoring Solution based on Quality Models
483
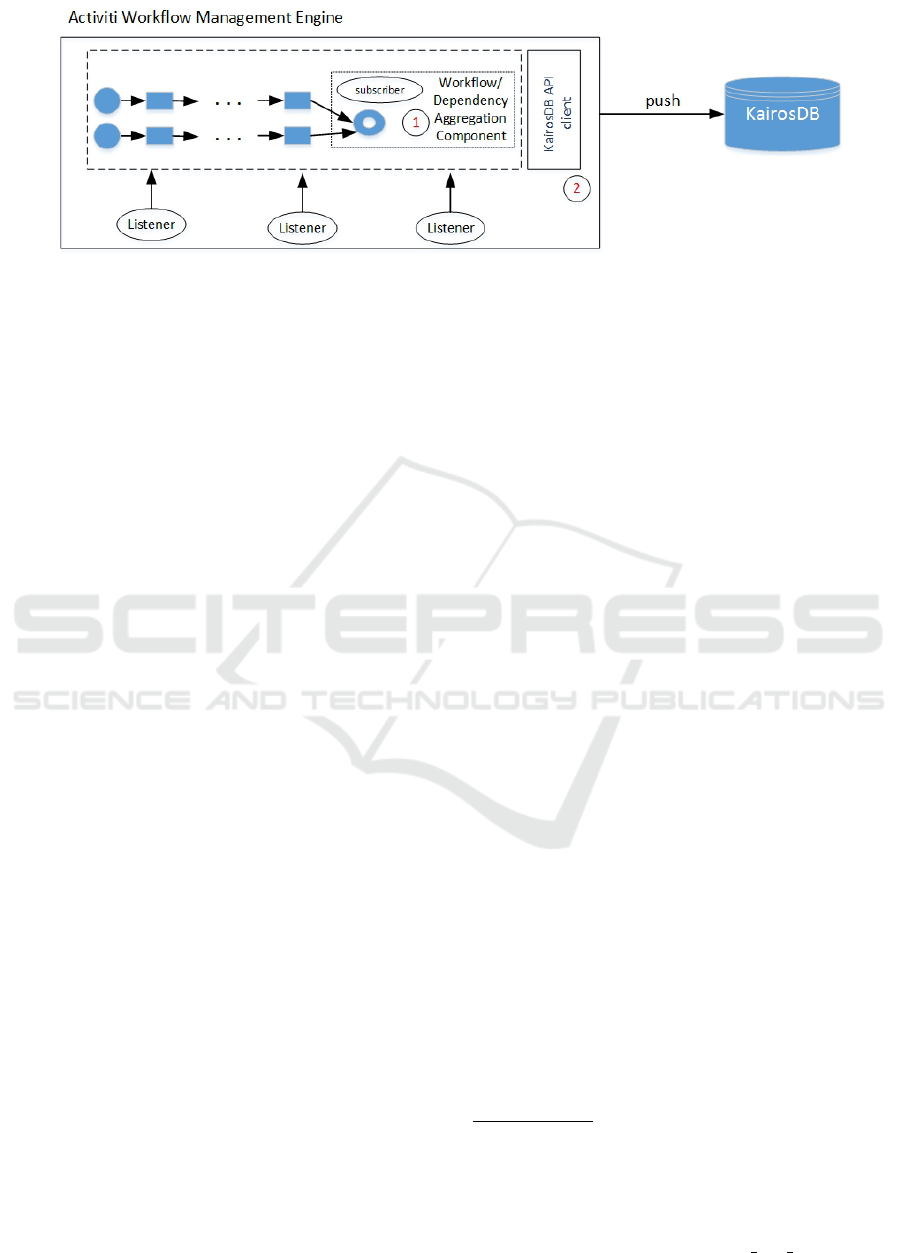
Figure 4: Architecture of Workflow aggregator.
sociation rules) leading to critical events of a specific
metric. This algorithm is based on propositional logic
and takes into consideration both the dependencies of
the components constituting the multi-Cloud applica-
tion system and the aggregate metrics extracted by the
TSDB. In particular, the algorithm requires as input:
(i) the monitoring log, (ii) the metric we are interested
in identifying critical event patterns and, (iii) the met-
rics classification (i.e. success, warning, critical), that
is part of the aggregated event. As it is obvious, all
these required input is provided by the proposed mon-
itoring framework, and especially can be extracted by
the incorporating TSDB, the monitoring sensors and
the aggregators. The algorithm exploits contingency
tables, i.e. tables displaying the frequency distribu-
tions of the candidate patterns and their negations as
antecedents and the specified metric event, as well as
its negation as consequences. The entries of these ta-
bles are utilized to determine the association rules.
The event pattern discovery enables both proac-
tive and reactive adaptation. Proactive adaptation is
achieved by detecting the critical event patterns caus-
ing service failures as early as possible in order to
prevent future critical SLO violations. The detected
patterns are mapped to suitable adaptation strategies
in the form of adaptation rules, that are fired imme-
diately in order to prevent a possible SLO violation.
Furthermore, the proposed framework can also re-
act immediately on detected critical events, thus per-
forming also reactive adaptation on the running SBA.
Upon the detection of a SLO violation, the Adapta-
tion Rule Manager immediately fires the correspond-
ing adaptation rule, dictating the application of a spe-
cific adaptation action. Some predefined simple rules,
mapping critical events to specific adaptation actions,
are manually produced by the SBA Adaptation Man-
ager (usually the SBA provider herself/himself) and
are passed to the Adaptation Rule Manager.
7 IMPLEMENTATION
In order to realize the proposed monitoring frame-
work we came up with some decisions on the mon-
itoring tools to be used for each of the three layers.
Regarding the Infrastructure layer, we used Nagios
monitoring tool, which is the Industry Standard in
IT infrastructure monitoring, offering various moni-
toring sensors. As far as monitoring is concerned on
the service layer, we have conducted a review on ex-
isting monitoring solutions (Prometheus, Inluxdata
5
,
statsD (Graphite)
6
, scollector (Bosun)
7
and freeware
versions of Datadog
8
and New Relic
9
), based on a set
of criteria: (i) commercial / open source, (ii) the local
domain support, which represents the possibility of
the monitoring tools offering monitoring capabilities
in a localhost domain, (iii) the limit of recorded mon-
itoring events, (iv) the definition of custom metrics
in order to measure specific software components, (v)
the support of Real User Monitoring (RUM)
10
which
is a major factor of computing response times and fi-
nally (vi) if it a standalone solution, as we cater for
monitoring tools that do not depend on third party
back-end components. From this comparison (Ta-
ble 2) we decided to use Prometheus, which satisfies
all the required criteria.
At the workflow layer, we have decided to use Ac-
tiviti, which is an open source Business and Work-
flow engine framework that provides an environment
for running workflows and business processes. It pro-
vides us with useful functionalities, such as the provi-
sion of a web-based modeling tool for workflow and
5
https://www.influxdata.com/
6
https://github.com/etsy/statsd
7
http://bosun.org/scollector/
8
https://www.datadoghq.com/
9
https://newrelic.com/
10
https://en.wikipedia.org/wiki/Real user monitoring
CLOSER 2017 - 7th International Conference on Cloud Computing and Services Science
484
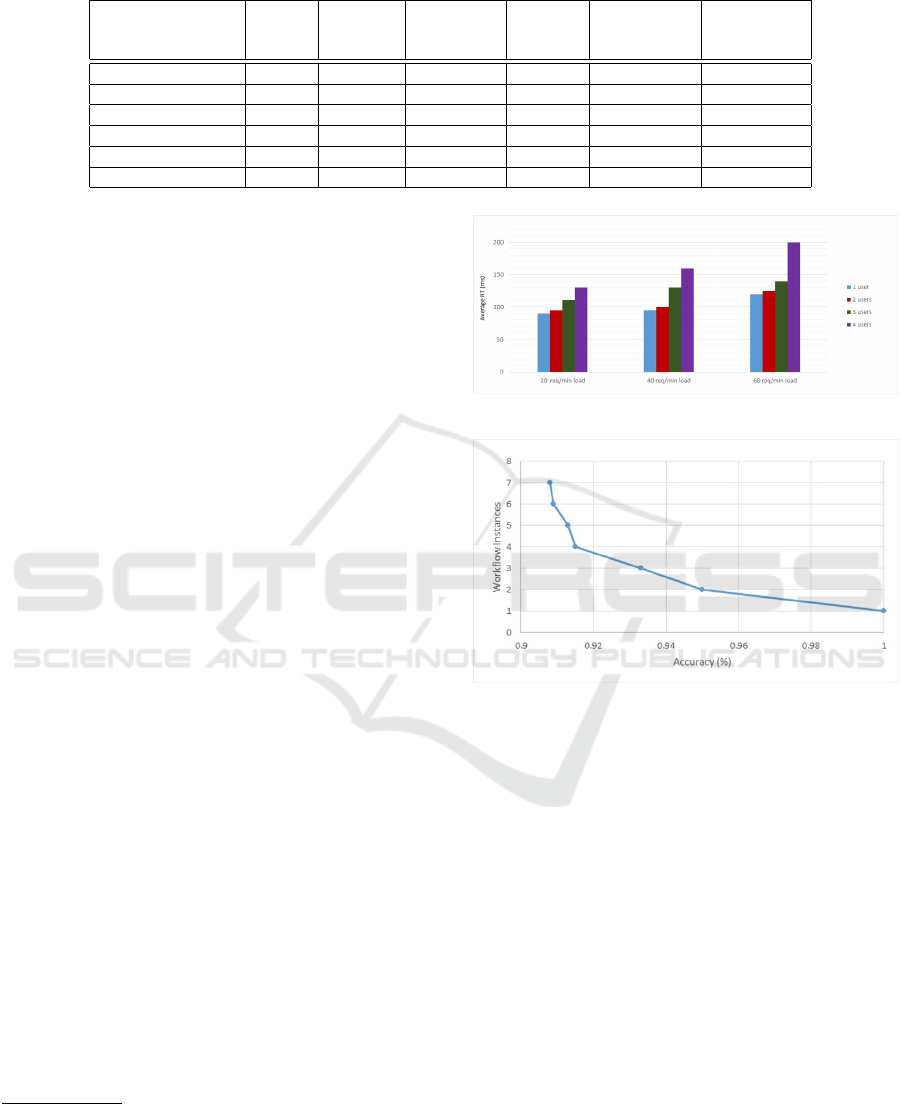
Table 2: Service Monitoring tools comparison.
Open
source
Local
domain
Support
Unlimited
Storage
Custom
Metrics
Support of
Real User
Monitoring Standalone
Datadog X X X
New Relic X X
Prometheus X X X X X X
Influxdata X X X
statsD (Graphite) X X X X X
scollector (Bosun) X X X X
business analysts, an Eclipse plug-in for developers
11
and a web application for managing workflow com-
ponents. Other similar workflow engines are jBPM
12
and BonitaSoft
13
. The main difference between Ac-
tiviti and these workflow engines is that the Activiti
project provides well-structured environment in order
to work with, making this way a lot easier for the de-
velopers to design and sustain their workflows.
8 EVALUATION
In this section we provide experimental results of the
proposed monitoring solution. The main purpose of
these experiments are to measure its performance and
accuracy. The setup of the virtual machines used
in these experiments is the following: Workflow in-
stances of the running examples were carried out in
two cloud infrastructures. The first one is a private
cloud infrastructure offered by the PaaS of VMWare
in which we have provisioned four VMs hosted by a
PC with Intel Core i7-4 Cores 2.50 GHz, 16 GB Ram,
300 GB SSD Hard Disk, running Windows 10 64-bit
Operating System (OS). Two VMs were provisioned
with characteristics of 2 vCPUs, 2 GB Ram, 15 GB
hard disk and OS of Centos7 64-bit. The remaining
two VMs had the characteristics of 2 vCPUs, 4 GB
RAM and 20 GB hard disk and OS of Centos7 64-
bit. In a public cloud infrastructure we have used one
VM with of 2 vCPUs, 4 GB RAM, 100 GB Hard Disk
drive and OS of Ubuntu 14.04 64 bit to host the cen-
tral TSDB.
In the first experiment we measure the average re-
sponse times of the set of services of fortress-web ap-
plication
14
with different amounts of workloads for
each of the users accessing the services simultane-
ously. Firstly, we ran the workflow with a 20 re-
quests/min workload for each set of simultaneous
11
http://docs.alfresco.com/4.1/tasks/wf-install-activiti-
designer.html
12
https://www.jbpm.org/
13
http://www.bonitasoft.com/
14
http://directory.apache.org/fortress/
Figure 5: Average response time for simultaneous users.
Figure 6: Accuracy of the monitoring system.
users and then we follow the same pattern for 40 re-
quests/min and 60 requests/min workloads.
As expected, the response time is increasing ac-
cording to the number of simultaneous users and the
number of workload requests/min. Figure 5 indi-
cates that there is an increasing difference between
the number of simultaneous users. In the workload
of 40 requests/min the difference between two and
four simultaneous users is bigger than 60ms and for
the workload of 60 requests/min is even bigger than
70ms. This indicates that the of response time be-
tween the different numbers of simultaneous users is
bigger than the amount of workload that the services
can tolerate. The reason behind this could be the num-
ber of simultaneous threads that Java instantiates in
order to serve the requests, thus having a late response
time.
In our second experiment we evaluated the ac-
curacy of the distributed monitoring system. This
experiment is based on seven executions, each one
which corresponds to a workflow instance. For each
A Cross-layer Monitoring Solution based on Quality Models
485

execution we calculated the accuracy of the moni-
toring system, produce by dividing the number of
Metrics+Datapoints(received)
Metrics+Datapoints(expected)
. These executions were con-
ducted with a workload of 60 requests/min and for
each one of them we increased the number of users
(one per time). As we can observe in Figure 6 the
system does not fail under 90% of accuracy. The 10%
percent loss of metrics and datapoints is due to the
pulling frequency of the monitoring system.
9 CONCLUSIONS AND FUTURE
WORK
In this paper we have introduced a monitoring frame-
work, that covers three main layers of a SBA, i.e. in-
frastructure, service and workflow layers. To achieve
this we propose the corresponding layer-specific qual-
ity models that define a set of metrics that can be
monitored in each layer. Moreover, in the proposed
framework we introduce the metric aggregators for
each layer as the components that computes compos-
ite metrics values from the raw ones produced by the
monitoring sensors and stores them in a times-series
database, to be further processed by the event-pattern
detection component.
As for future work, we plan to introduce a com-
plex cross-layer adaptation engine that will efficiently
manage the SLO violations both reactively and pro-
actively by exploiting the detected critical event pat-
terns. Furthermore, a future objective is the cre-
ation of a Business quality model, with regard to the
Business functional layer which could include quality
terms related to the quality of the business processes
and higher level Key Performance Indicators (KPIs).
ACKNOWLEDGMENTS
This work is supported by CloudSocket project
15
that
has been funded within the European Commissions
H2020 Program under contract number 644690.
REFERENCES
Alhamazani, K., Ranjan, R., Jayaraman, P. P., Mitra, K.,
Liu, C., Rabhi, F. A., Georgakopoulos, D., and Wang,
L. (2015). Cross-layer multi-cloud real-time appli-
cation qos monitoring and benchmarking as-a-service
framework. CoRR, abs/1502.00206.
15
http://www.cloudsocket.eu
Bardsiri, A. K. and Hashemi, S. M. (2014). Qos metrics for
cloud computing services evaluation. International
Journal of Intelligent Systems and Applications, pages
27–33.
Calero, J. M. A. and Gutierrez, J. (2015). Monpaas: An
adaptive monitoring platformas a service for cloud
computing infrastructures and services. IEEE Trans.
Services Computing, 8(1):65–78.
Cardoso, J., Sheth, A., and Miller, J. (2002). Workflow
Quality Of Service. Technical report, LSDIS Lab,
Computer Science, Universtity of Georgia, Athens
GA, USA.
Gomez-Perez, J. M., Garca-Cuesta, E., Zhao, J., Garrido,
A., and Ruiz, J. E. (2013). How reliable is your work-
flow: Monitoring decay in scholarly publications. vol-
ume 994 of CEUR Workshop Proceedings, pages 75–
86. CEUR-WS.org.
Guinea, S., Kecskemeti, G., Marconi, A., and Wetzstein, B.
(2011). Multi-layered monitoring and adaptation. In
ICSOC, volume 7084 of Lecture Notes in Computer
Science, pages 359–373. Springer.
Herbst, N. R., Kounev, S., and Reussner, R. H. (2013). Elas-
ticity in cloud computing: What it is, and what it is
not. In ICAC, pages 23–27. USENIX Association.
Joshi, K. P., Joshi, A., and Yesha, Y. (2011). Managing the
quality of virtualized services. In 2011 Annual SRII
Global Conference, pages 300–307.
Kazhamiakin, R., Pistore, M., and Zengin, A. (2009).
Cross-layer adaptation and monitoring of service-
based applications. volume 6275 of Lecture Notes in
Computer Science, pages 325–334.
Metallidis, D., Zeginis, C., Kritikos, K., and Plexousakis,
D. (2016). A distributed cross-layer monitoring sys-
tem based on qos metrics models. In 1st International
Workshop on Performance and Conformance of Work-
flow Engines.
Namiot, D. (2015). Time series databases. In DAM-
DID/RCDL, volume 1536 of CEUR Workshop Pro-
ceedings, pages 132–137. CEUR-WS.org.
Seth, N., Deshmukh, S., and Vrat, P. (2005). Service quality
models: a review. International Journal of Quality &
Reliability Management, 22(9):913–949.
Trimintzios, P. Measurement frameworks and metrics for
resilient networks and services: Technical report sys-
tems. Technical report, European Network and Infor-
mation Security Agency (ENISA).
Zeginis, C., Kritikos, K., Garefalakis, P., Konsolaki, K.,
Magoutis, K., and Plexousakis, D. (2013). Towards
cross-layer monitoring of multi-cloud service-based
applications.
Zeginis, C., Kritikos, K., and Plexousakis, D. (2015). Event
pattern discovery in multi-cloud service-based appli-
cations. IJSSOE, 5(4):78–103.
CLOSER 2017 - 7th International Conference on Cloud Computing and Services Science
486
