
Global Solar Radiation Prediction Methodology using Artificial
Neural Networks for Photovoltaic Power Generation Systems
Jane Oktavia Kamadinata
1
, Tan Lit Ken
1
and Tohru Suwa
2
1
Takasago Thermal/Environmental Systems Laboratory, Malaysia-Japan International Institute of Technology,
Universiti Teknologi Malaysia, Kuala Lumpur, Malaysia
2
Department of Mechanical Engineering, President University, Cikarang, Bekasi, Indonesia
Keywords: Artificial Neural Network, Global Solar Radiation Prediction, Sky Image, Photovoltaic Power Generation.
Abstract: Solar radiation is an essential source of energy that has yet to be fully utilized. This energy can be converted
into another form of more usable energy, electricity, by using photovoltaic power generation systems in
order to fight against global warming. When the photovoltaic power generation systems are connected to an
electrical grid, predicting near-future global solar radiation is important to stabilize the entire network. Two
different simple methodologies utilizing artificial neural networks (ANNs) to predict the global solar
radiation in 1 to 5 minutes in advance from sky images are developed and compared. In the first
methodology, two ANNs are combined. The first ANN predicts cloud movement direction, while the second
ANN predicts global solar radiation using the first ANN’s prediction results. On the other hand, a single
ANN directly predicts global solar radiation in the second methodology. Both of the proposed
methodologies are able to capture the trends of the global solar radiation well. Because the proposed
methodologies only use limited number of sampling points, the computational effort is significantly reduced
compared to the existing methodologies where the whole images need processing.
1 INTRODUCTION
Photovoltaic is one of the most promising renewable
technologies for decelerating global warming. The
global solar radiation, which is used by photovoltaic
cells, tends to fluctuate. Due to the uncertainty of
global solar radiation, its prediction methodology is
needed in order to stabilize the entire electrical grid.
When the total electricity provided by photovoltaic
power generation systems to the electrical grid is
significant, balancing the supply and demand is a
critical issue because of the fluctuation. Usually
multiple conventional power generation plants,
which can be thermal, nuclear, or hydroelectricity,
are connected to the electrical grid beside the
photovoltaic power generation systems. The
electricity is provided by the multiple conventional
power plants so that the supply is balanced with the
load. If a large fluctuation occurs in the electricity
provided by the photovoltaic power generation
systems, an extra power plant may have to start or
shut down to compensate the disturbance. In such
situations, the global solar radiation prediction
results in a few minutes in advance are useful to
operate the electrical grid with the power plants.
For the past few years, various global solar
radiation prediction methodologies have been
proposed. Meteorological data along with
geographical information is frequently used for
predicting global solar radiation. Sunshine duration,
relative humidity, and air temperature data have
been used as the inputs for artificial neural network
(ANN) to predict hourly global, diffuse, and direct
solar irradiance (Mellit et al., 2010). Month, day,
hour, temperature, and relative humidity data (Hasni
et al., 2012), and a combination of monthly mean
daily sum satellite-estimated data with latitude,
longitude, and altitude information (Şenkal, 2010)
have been used to predict global solar radiation. The
predictions that use complete meteorological data
provide good accuracy. However, since the past
complete meteorological data is not available for
most of the locations, above methodologies are
useful in limited situations.
Other popular techniques to predict solar
radiation are sky image-based methodologies. Most
of these prediction methodologies focus on cloud
Kamadinata, J., Ken, T. and Suwa, T.
Global Solar Radiation Prediction Methodology using Artificial Neural Networks for Photovoltaic Power Generation Systems.
DOI: 10.5220/0006248700150022
In Proceedings of the 6th International Conference on Smart Cities and Green ICT Systems (SMARTGREENS 2017), pages 15-22
ISBN: 978-989-758-241-7
Copyright © 2017 by SCITEPRESS – Science and Technology Publications, Lda. All rights reserved
15

detection and tracking since solar radiation is highly
affected by clouds. Short-term predictions for all of
the solar radiation components (global, direct, and
diffuse) have been performed by detecting cloud
motion vectors from sky images taken by a total sky
imager (Alonso-Montesinos et al., 2015, Marquez
and Coimbra, 2013). Representative velocities and
grid cloud fractions are used to predict direct solar
radiation (Marquez and Coimbra, 2013). A machine
learning algorithm combined with local irradiance
data and sky images are used to forecast global and
direct solar radiation (Pedro and Coimbra, 2015). A
hybrid of ANN and support vector machine is used
to produce prediction interval for direct solar
radiation forecast (Chu et al., 2015). One of the
major advantages of the prediction methodologies
based on sky images is that they do not need
complete meteorological data, which requires
expensive measurement systems. For smaller
photovoltaic power generation systems, it is not
practical to have such systems. However, sky image-
based methodologies require large computational
effort in order to process multiple sky images as
hundreds of thousands of pixels are contained in a
single image.
In this work, two methodologies to predict global
solar radiation in 1 to 5 minutes in advance by using
measured global solar radiation, and sky images are
proposed. In order to achieve accurate and fast
prediction, ANNs are used in these methodologies.
Unlike most of the sky image-based prediction
methodologies, the proposed methodologies process
image information obtained from less than fifty
pixels in each image, resulting in much less
computational effort. The proposed methodologies
do not require meteorological data such as humidity
or air temperature. Hence they are suitable for areas
where the complete weather measurement system is
not available.
2 GLOBAL SOLAR RADIATION
PREDICTION
METHODOLOGIES
In this paper, two solar radiation prediction
methodologies using ANNs with sky images are
proposed. The first proposed methodology, 2-step
method, consists of 2 ANNs. In this methodology,
image information from sampling points is extracted
from the sky images. Then, the extracted image
information is used as the inputs for the first ANN to
predict the direction of cloud movement. Lastly, the
image information from sampling points close to the
predicted cloud movement direction combined with
measured global solar radiation values are used as
the inputs for the second ANN to predict solar
radiation in 1 to 5 minutes in advance. The second
proposed methodology, 1-step method uses only one
ANN. In this methodology, sky image information
extracted from the sampling points is combined with
the measured global solar radiation data as the inputs
for the ANN to directly predict global solar radiation
in 1 to 5 minutes in advance. The predicted results
are compared with the measured global solar
radiation data using root mean square error (RMSE):
(1)
where
is the predicted global solar radiation
value in W/m
2
,
is the measured global solar
radiation value in W/m
2
and n is the number of times
to perform prediction. The subscript denotes the
ANN testing data set number.
2.1 Prediction using Artificial Neural
Networks
ANN has been proven to be suitable for solar
radiation prediction when meteorological and
geographical data are used as the inputs. In this
research, commercially available artificial neural
network software (Ward System Groups, 1996) is
used to predict global solar radiation. The general
configuration of the artificial neural network is
illustrated in Figure 1. The rectangles in hidden layer
represent groups of neurons. The input, hidden layer,
and output neurons are fully connected.
Each of the rectangles in the hidden layer has its
own activation function. From preliminary analysis,
four activation functions are chosen to form the
rectangles: Gaussian, Gaussian complement,
hyperbolic tangent (Tanh), and jump connection.
The formula of the Gaussian activation function is
described as (Ward System Groups, 1996) :
(2)
The Gaussian complement activation function is
described as (Ward System Groups, 1996):
(3)
The hyperbolic tangent activation function is
described as (Ward System Groups, 1996):
(4)
SMARTGREENS 2017 - 6th International Conference on Smart Cities and Green ICT Systems
16
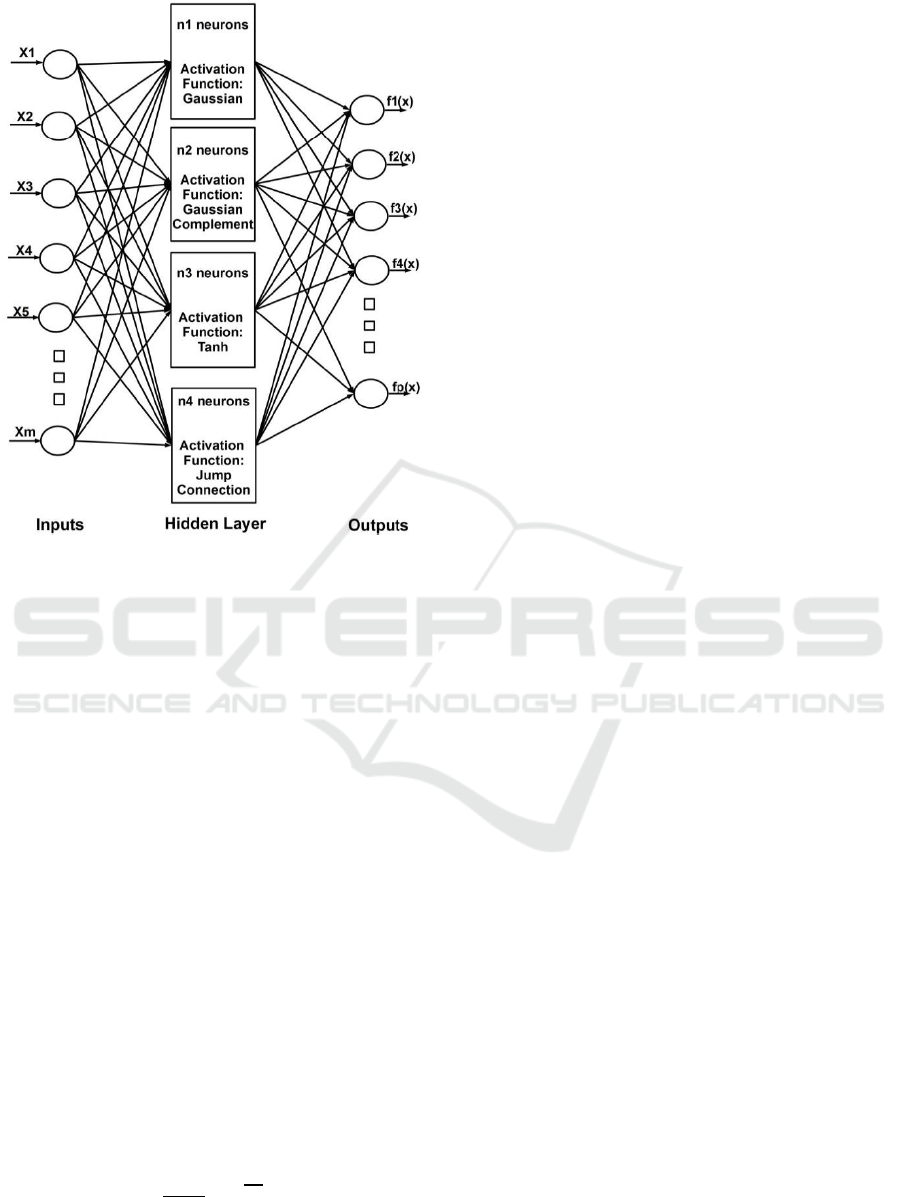
Figure 1: Artificial neural network configuration.
Jump connection activation function is described
as:
(5)
In the preliminary analysis, the best network
activation function combination, which minimizes
the RMSE, is selected from all of the possible 2 to 4
activation function combinations. At the same time,
parameters for artificial neural network learning
process: number of neurons in the rectangles,
learning rate, momentum, and initial weights, are
optimized so that the RMSE is minimized. The
parameters called learning rate and momentum
control how the weights are modified in the next
iteration within the network learning process. The
initial weights are randomly selected numbers within
a specified range. It is confirmed that initial weights
within the range from -0.3 to 0.3 result in the most
accurate prediction for most of the networks. As a
result, each artificial network consists of different
activation function combination with different
number of neurons in the rectangles.
The number of neurons in a rectangle,
, is
decided by the next equation (Ward System Groups,
1996):
(6)
where
is the number of ANN inputs,
is the
number of outputs, and
is the number of training
data sets. Equation 6 applies to all of the hidden
layer rectangles except for the rectangle with jump
connection whose number of neurons is the same as
number of inputs, which is described as:
(7)
where is the number of input neurons.
In the preliminary analysis, it is confirmed the
number of neurons obtained from these equations
give the most accurate prediction results.
2.2 Data Collection
The sky images are taken using a waterproof 12-
megapixel camera with a fish-eye lens mounted on a
2-axis solar tracker. In front of the camera, the sun is
covered by a circular shade so that direct sunlight
does not reach to the lens to avoid glares. The sky
images are taken with 20-second intervals.
The second data used in this research are the
global solar radiation data. Minutely global solar
radiation data are measured with a pyranometer and
taken simultaneously with the sky images. The
pyranometer is located within 100 m from the
camera to make sure that the sky images taken are
relevant to the solar radiation measurement.
2.3 Image Information Extraction
Various image information extraction techniques
such as the intensity, hue, and saturation color space
(Souza-Echer et al., 2006), hue, saturation, and value
(HSV) color space and red, green, blue (RGB) color
space (Davis et al., 1991, Sabburg and Wong, 1999),
the red blue ratio (RBR) (Chow et al., 2011), and
normalized ratio of red intensity to blue intensity
(nRBR) (Chu et al., 2015) have been proposed to
distinguish clouds from the clear sky for cloud
classification problems.
During the preliminary analysis, it is discovered
that RBR values differentiate clouds from the blue
sky effectively. The RBR is the ratio of red and blue
values taken from a pixel. A RBR value in the blue
sky shows lower values, while a higher value of
RBR is obtained in clouds no matter how dark or
bright. In this research, RBR values are extracted
from sampling points at predetermined locations.
Five successive sky images taken with 20-second
intervals are used for a set of ANN input data. The
sampling points are placed so that they are radiated
from the center of the sun. In every image, 4 axes
are drawn towards the center of the sun, as shown in
Global Solar Radiation Prediction Methodology using Artificial Neural Networks for Photovoltaic Power Generation Systems
17
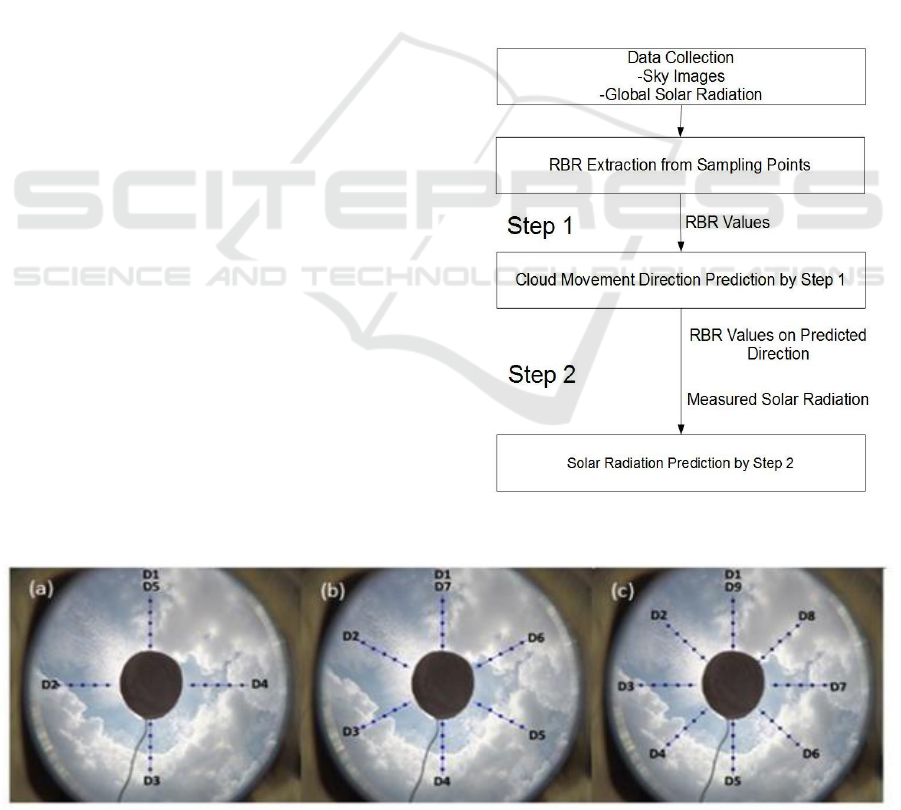
Figure 2a. On every line, 5 sampling points are
placed with the same intervals of 1.86
o
. Although a
fisheye lens is used to capture the sky images, it is
confirmed the image distortion is negligible in the
area where the sampling points are located. RBR
values from the sampling point are then extracted
and used as the ANNs inputs as described in Section
2.4 and Section 2.5. In Figure 2a, the direction of
cloud movement is expressed as a number from 1 to
5, denoted by the axes from D1 to D5. D1 is used
twice to include the area between D4 and D1.
Assuming cloud movement toward the sun is the
most critical information for predicting global solar
radiation, the RBR value sampling points are located
so that they are radiated from the center of the sun.
In an image, there are 5 points located on each axis
line, resulting in a total of 20 sampling points. In 5
images, there are 100 sampling points in total. In
order to obtain the relation between the number of
the sampling points and prediction accuracy, 6 and
8-axis cases are also used for the prediction. In the
cases of 6 and 8-axes, there are total sampling points
of 150 and 200 as shown in Figure 2b and Figure 2c,
respectively. In this section, the prediction
methodology using 4-axes is discussed as an
example. For 6 and 8-axes cases, the number of
ANN inputs is increased as the number of sampling
points increases.
A total of 1,580 sets equivalent to about 44 hours
of measured solar radiation data and sky images are
used for training the artificial neural networks.
Among the 1,580 data sets, 80% is used for training
the network, while the remaining 20% is for testing.
In order to avoid overtraining, RMSE are calculated
by using the measured data different from the ones
used for network training during the testing process.
2.4 2-Step Method for Global Solar
Radiation Prediction
2-step method consists of two ANNs: ANN 1 for
step 1 and ANN 2 for step 2, as shown in Figure 3.
In the first step, a total of 100 RBR values extracted
from the sampling points are used as the inputs of
ANN 1 to predict cloud movement direction. In
total, this ANN Step 1 uses 100 inputs to produce 1
output. The 6 and 8-axis cases have different number
of inputs, still the number of output is always one:
the cloud movement direction. The cloud movement
direction used for training ANN 1 is obtained
manually by comparing the consecutive sky images.
RBR values extracted from 5 points that fall in
the line closest to the cloud movement direction
predicted by ANN 1 are taken from every image. In
the 5 images, a total of 25 points, added to 2 global
solar radiation values measured at the corresponding
time of the images taking process, are the inputs for
ANN 2 to predict global solar radiation in 1 to 5
minutes in the future. In total, this ANN 2 will use
27 inputs to produce 5 outputs. Table 1 shows the
ANN design for ANN step 1 and ANN step 2 for 4,
6, and 8 axes.
Figure 3: 2-step method for global solar radiation
prediction.
Figure 2: Image sampling points. (a) 4 Axes. (b) 6 Axes. (c) 8 Axes.
SMARTGREENS 2017 - 6th International Conference on Smart Cities and Green ICT Systems
18

Table 1: 2-steps ANN design for 4, 6, and 8 axes.
Parameter
ANN Step 1
ANN Step 2
4 Axis
6 Axis
8 Axis
4 Axis
6 Axis
8 Axis
Number of
hidden layer
3
3
3
2
3
3
Number of
neurons in 1
hidden layer
27
35
44
24
16
24
Activation
Function
Gaussian,
Gaussian
complement,
Tanh
Gaussian,
Gaussian
complement,
Tanh
Gaussian,
Gaussian
complement,
Tanh
Gaussian,
Gaussian
complement
Gaussian,
Gaussian
complement,
Tanh
Gaussian,
Gaussian
complement,
Jump
connection
Number of
inputs
100
150
200
27
27
27
Number of
outputs
1
1
1
5
5
5
2.5 1-Step Method for Global Solar
Radiation Prediction
In 1-step method, the global solar radiation is
directly predicted without predicting the cloud
movement direction, as shown in Figure 4. The total
of 100 RBR values extracted from the sampling
points are combined with 2 global solar radiation
values measured at the same time as the sky image
taking process and used as the inputs for the ANN.
In total, the 1-step method ANN has 102 inputs and
gives 5 outputs, which are global solar radiation in 1
to 5 minutes in advance. The ANN design used for
this methodology is listed in Table 2.
3 GLOBAL SOLAR RADIATION
PREDICTION RESULTS AND
DISCUSSIONS
In this section, solar radiation prediction results
using 2-step and 1-step methods with three different
numbers of axes are presented. The comparison of
RMSE values of global solar radiation prediction in
1 to 5 minutes in advance with different prediction
methods and different number of axes is shown in
Figure 5. In order to avoid ANN overtraining, the
prediction errors (RMSE) used in this work are
calculated by using another measured data different
from the ones used for network training. A total of
535 data sets, which are equivalent to about 15
hours, are used for RMSE calculations.
A smaller RMSE value indicates the predicted
results are more accurate. The 6 and 8-axis cases of
Table 2: 1-steps ANN design for 4, 6, and 8 axes.
Parameter
1-Step ANN
4 Axis
6 Axis
8 Axis
Number of hidden layer
3
3
2
Number of neurons in 1
hidden layer
28
35
67
Activation Function
Gaussian, Gaussian
Complement, Tanh
Gaussian, Gaussian
Complement, Tanh
Gaussian, Gaussian Complement,
Tanh
Number of inputs
102
152
202
Number of outputs
5
5
5
Global Solar Radiation Prediction Methodology using Artificial Neural Networks for Photovoltaic Power Generation Systems
19
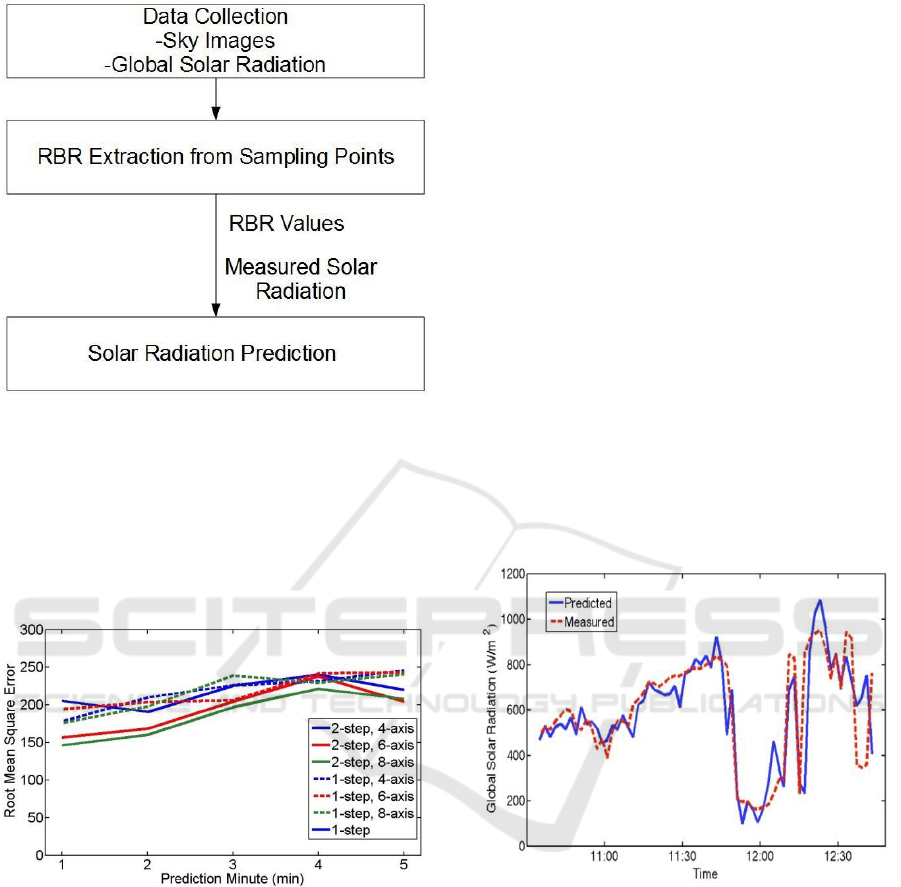
Figure 4: 1-step method for global solar radiation
prediction.
2-step method gives more accurate results than 1-
step method or 4-axis cases, although the differences
are small. As the prediction minute increases, the
accuracy tends to degrade. As originally expected,
the accuracy is improved when the number of axes is
increased but the difference is not large.
Figure 5: Comparison of RMSE values of 2-steps and 1-
step methods.
At the same time, 4-axis cases give much better
results than expected for both 2 and 1-step methods.
Considering 4-axis cases use only 20 pixels per
image, the accuracy of these results is rather
surprising. The less axes cases require less sampling
points and less data sets for ANN training.
Therefore, at the training process requires less
computational efforts at the cost of slightly less
accuracy.
In Kuala Lumpur, there are many clouds in the
sky quite often due to the high humidity. Because of
these clouds, the solar radiation frequently increases
or decreases to a large extent. A typical day with
fluctuating solar radiation value is chosen to
demonstrate the capability of the proposed method.
Figure 6 shows solar radiation prediction results of 1
minute in advance for 2-steps method, 6-axis case.
Despite the small ups and downs, the proposed
methodology captures the trend of solar radiation
well. The proposed methodologies are especially
good at predicting sudden large increases and
decreases.
The cloud movement direction data is required
for 2-step method for training ANN 1, while 1-step
method does not need such data. Since the cloud
movement direction is detected manually from the
sky images, 1-step method has an advantage over 2-
step for omitting this manual process. Also, 1-step
method has simpler prediction process than 2-step.
Image information from hundreds of thousands
of pixels is used for the existing cloud detection
based solar radiation prediction methods, while only
hundreds of pixels are used for the proposed
methodologies. Because of this significant input data
size reduction, much less computational efforts are
needed for the proposed methods.
Figure 6: Global solar radiation prediction results
compared to measured data, 1 minute in advance, 2-step,
and 6-Axis. The data is measured on 28
th
July 2016.
In this example, the proposed methodology takes
5.4 seconds for the prediction on a personal
computer with a 2.2 GHz quad-core processor and 8
GB memory. The prediction is performed for every
2 minutes during the daytime of July 28, 2016
equivalent to consecutive 2 hours and 8 minutes,
which leads to 65 times of prediction as a total.
For most of the cloud detection methodologies in
the previous work, sky imagers that are specially
designed for taking sky images are required, while
the proposed methodologies use a general-use
waterproof camera, which is much less expensive
SMARTGREENS 2017 - 6th International Conference on Smart Cities and Green ICT Systems
20

than the sky imagers. At the same time, the
prediction can be performed by using commercially
available ANN software. Software specifically
developed for solar radiation prediction is not
needed. A general use personal computer can be
used for the prediction since the required
computational efforts are limited. Because the
proposed methodologies do not require special
equipment, nor software, global solar radiation
prediction is possible for much less cost compared to
the existing methodologies.
The authors are currently improving the accuracy
of prediction by optimizing the network
configurations and their parameters. When an ANN
has relatively large number of inputs, its prediction
accuracy tends to be degraded. Having hundreds of
inputs, the prediction accuracy may not be improved
even if the number of axes is increased further.
4 CONCLUSIONS
Two different methodologies to predict global solar
radiation in 1 to 5 minutes in advance using sky
images are proposed. Image information extracted
from a total of maximum 40 points placed in one
image, combined with global solar radiation values
measured simultaneously with the sky images photo
taking, are used as the inputs for ANNs to predict
global solar radiation values. The global solar
radiation predicted by the proposed methodologies
captures the trends of the measured data well even
when there are sudden changes. When the number of
sampling points is increased the prediction accuracy
tends to be improved but the difference is rather
small. The proposed 2-step method (6 and 8-axis)
gives more accurate results than 1-step method but
the difference is not large. Cloud movement
direction data, which requires manual measurement,
is needed for 2-step method, while 1-step method
does not need it.
This methodology is focused on global solar
radiation prediction in 1 to 5 minutes in advance
because it is assumed that 1 to 5 minutes is enough
for an electrical grid to prepare for output changes
from a solar electricity generation system. The
number of sampling points in the sky images, the
sampling point interval, and the time interval to take
the sky images are optimized for the 1 to 5 minutes
prediction. It is expected that this methodology is
applicable for predictions longer than 5 minutes
when the data sampling parameters are optimized.
These proposed methodologies have an
advantage of requiring much less computational
resources and efforts compared to the existing sky
image-based prediction methodologies. These
methodologies do not need complete meteorological
data and suited to locations with no weather
measurement systems.
ACKNOWLEDGEMENTS
The authors would like to express their appreciation
to Takasago Thermal Engineering Co., Ltd. and
Universiti Teknologi Malaysia for supporting this
research through Takasago Research Grant Vot No.
4B211. The authors also wish to thank Wind
Engineering for (Urban, Artificial, Man-made)
Environment Lab (Dr. Sheikh Ahmad Zaki) in
Malaysia-Japan International Institute of
Technology for providing the global solar radiation
data.
REFERENCES
Alonso-Montesinos, J., Batlles, F.J., Portillo, C., 2015.
Solar irradiance forecasting at one-minute intervals for
different sky conditions using sky camera images.
Energy Convers. Manag. 105, 1166–1177.
Chow, C.W., Urquhart, B., Lave, M., Dominguez, A.,
Kleissl, J., Shields, J., Washom, B., 2011. Intra-hour
forecasting with a total sky imager at the UC San
Diego solar energy testbed. Sol. Energy 85, 2881–
2893.
Chu, Y., Li, M., Pedro, H.T.C., Coimbra, C.F.M., 2015.
Real-time prediction intervals for intra-hour DNI
forecasts. Renew. Energy 83, 234–244.
Davis, G.B., Griggs, D.J., Sullivan, G.D., 1991. Automatic
Estimation of Cloud Amount Using Computer Vision.
J. Atmos. Ocean. Technol.
Hasni, A., Sehli, A., Draoui, B., Bassou, A., Amieur, B.,
2012. Estimating global solar radiation using artificial
neural network and climate data in the south-western
region of Algeria. Energy Procedia 18, 531–537.
Marquez, R., Coimbra, C.F.M., 2013. Intra-hour DNI
forecasting based on cloud tracking image analysis.
Sol. Energy 91, 327–336.
Mellit, A., Eleuch, H., Benghanem, M., Elaoun, C., Pavan,
A.M., 2010. An adaptive model for predicting of
global, direct and diffuse hourly solar irradiance.
Energy Convers. Manag. 51, 771–782.
Pedro, H.T.C., Coimbra, C.F.M., 2015. Nearest-neighbor
methodology for prediction of intra-hour global
horizontal and direct normal irradiances. Renew.
Energy 80, 770–782.
Sabburg, J., Wong, J., 1999. Evaluation of a ground-based
sky camera system for use in surface irradiance
measurement. J. Atmos. Ocean. Technol. 16, 752–759.
Global Solar Radiation Prediction Methodology using Artificial Neural Networks for Photovoltaic Power Generation Systems
21

Şenkal, O., 2010. Modeling of solar radiation using remote
sensing and artificial neural network in Turkey.
Energy 35, 4795–4801.
Souza-Echer, M.P., Pereira, E.B., Bins, L.S., Andrade,
M.A.R., 2006. A simple method for the assessment of
the cloud cover state in high-latitude regions by a
ground-based digital camera. J. Atmos. Ocean.
Technol. 23, 437–447.
Ward System Groups, 1996. NeuroSHELL 2 User Manual
[WWW Document]. URL
http://www.wardsystems.com/ manuals/neuroshell2/
(accessed 11.1.16).
SMARTGREENS 2017 - 6th International Conference on Smart Cities and Green ICT Systems
22
