
Prediction of Protein X-ray Crystallisation Trial Image
Time-courses
B. M. Thamali Lekamge
1
, Arcot Sowmya
1
and Janet Newman
2
1
School of Computer Science and Engineering, University of New South Wales, Sydney, NSW 2052, Australia
2
CSIRO Biomedical Program, 343 Royal Parade, Parkville, Victoria 3052, Australia
{thamalil, sowmya}@cse.unsw.edu.au, janet.newman@csiro.au
Keywords: Random Forests, Protein Crystallisation, Outcome Prediction.
Abstract: This paper presents an algorithm to predict the outcome of a protein x-ray crystallisation trial. Results obtained
from classification of individual images in a time-course are used, along with random forests, to make a
prediction of the time-course outcome. Experiments on multiple datasets show that the first 8 frames of each
time-course are quite sufficient to predict the final outcome.
1 INTRODUCTION
X-ray crystallography is widely used to determine the
three-dimensional atomic structure of biological
macromolecules, and provides the ability to gain
unique understanding about the function of a protein
(Newman et al., 2007). Without hyperbole, X-ray
crystal structures have transformed biology, being the
most successful way of determining the fundamental
structure of macromolecules; well over 80% of
entries in the Protein Data Bank (rcsb-PDB) have
been determined using X-ray crystallography.
Understanding the structure / function relationship, as
revealed by crystallographic analyses, is also one of
the most important tools for rational drug design
(Dessau and Modis, 2011).
The technique of X-ray crystallography uses
diffraction patterns generated by irradiating a
crystalline sample of the molecule of interest with X-
rays, thus the production of diffraction quality
crystals is mandatory for this process. To date, the
production of crystals requires triaging through an
enormous chemical space to find conditions that
preserve the delicate tertiary structure of the protein
molecules whilst enabling the molecules to form a
crystal lattice. The limiting factor is most often
production of the pure protein sample required for the
crystallization trials. Thousands of crystallisation
experiments may be carried out in a single structural
biology laboratory every day. As crystal growth is
time dependent, each experiment is observed over
time, with the normal timespan being weeks to
months. Only since the turn of the century have
robotic imagers become available, and these
instruments automatically collect photographic
images of a crystallisation trial over the course of the
experiment. As each trial is imaged over time,
multiple images are collected of the same trial at
different time points; a set of images that belong to a
single trial is called a time-course.
Currently, analysis and classification of the
crystallisation image data are performed manually.
As most crystallisation trials do not produce crystals,
the process of manual observation and annotation is
tedious, with numbers from the CSIRO C3
crystallisation laboratory suggesting that less than 2%
of the 10-20K images collected each day are
annotated, and there is simply no way of estimating
how many of the images have actually been
examined.
Automating the classification process may
aid the goal of labelling all the images collected as
individual frames, but also may well allow the
assignment of a common label for a whole time-
course using sequence classification. This would
both save significant time and effort for
crystallographers, as well as providing coverage for
all the images produced. The final goal would be to
be able to predict from the early images in a time-
course what the eventual outcome might be.
As significant numbers of crystallisation time-
courses may be produced in a single laboratory (in its
ten years of operation, the C3 has produced over 3
million time-courses), a large number of interesting
time-courses may get ignored due to lack of resources
to analyse each one manually. Moreover, large
Lekamge, B., Sowmya, A. and Newman, J.
Prediction of Protein X-ray Crystallisation Trial Image Time-courses.
DOI: 10.5220/0006246506630668
In Proceedings of the 6th International Conference on Pattern Recognition Applications and Methods (ICPRAM 2017), pages 663-668
ISBN: 978-989-758-222-6
Copyright
c
2017 by SCITEPRESS – Science and Technology Publications, Lda. All rights reserved
663

amounts of memory are also occupied by the huge
datasets collected over time. Even more compelling,
crystallographers are interested in finding and
interrogating crystals as soon as possible in order to
minimise the time until a protein structure is
available. Thus, it is important to identify interesting
conditions that produce crystals as early as possible.
This paper focuses on the prediction of protein
crystallisation trial image time-courses by developing
sequence classification techniques. The next section
provides a brief overview of related techniques. Our
approach for the prediction of crystallisation sample
time-courses is presented next, followed by the
results obtained. The final section discusses our
conclusions and potential future work.
2 RELATED WORK
Image processing on protein crystallisation trial
images is a relatively unexplored research area. So far
the experiments carried out on this data have focussed
on classification of single frames without
consideration of the time-course context of each
image (Buchala and Wilson, 2008, Cumbaa and
Jurisica, 2005, Kotseruba Y et al., 2012, Lekamge et
al., 2013, Walker et al., 2007, Watts et al., 2008,
Wilson and Wilson, 2006, Yang et al., 2006).
Prediction of the final outcome of a protein
crystallisation trial time-course is a new and
orthogonal approach to the problem of classifying
images of crystallisation trials.
Random Forests has been used to predict the
amino acids in a protein sequence that may be
involved in mediating protein - protein interactions.
Šikić et al (2009) used a combination of sliding
windows and Random Forests to predict the protein -
protein interaction sites in sequences. First the system
classifies the data using the sliding windows method
and then Random Forests is applied on a weighted
class system for prediction of protein - protein
interaction sites.
Some techniques that have been used for sequence
classification and prediction in machine learning
include sliding windows (Babcock et al., 2002, Gama
et al., 2013, Li et al., 2005) and Hidden Markov
Models (Dietterich, 2002). Although these techniques
provide good results for regular sequence learning
problems, they can be challenging to apply to our data
set as the time gap between frames in a single time-
course varies considerably.
2.1 Contributions
To our knowledge, predicting the outcome of protein
x-ray crystallisation trial time-courses has not yet
been studied. This paper provides a new tool to the
field of crystallography by proposing and testing a
method for the prediction of the eventual outcome of
a crystallisation trial. It utilizes pre-processing and
single frame classification techniques already
developed in our group (Lekamge et al., 2013,
Lekamge et al., 2016, Mele et al., 2013), and extends
them to time-course classification.
3 APPROACH
Processing of the protein crystallisation trial time-
course is different from normal video processing. In
a normal video, there are usually a large number of
frames, whereas in the crystallisation dataset the
number of frames is very small, varying between 9
and 15 frames. Moreover, in a normal video, the
frame rate is stable whereas in the crystallography
data the time gap between the frames is variable and
very large. An example of a protein crystallisation
trial image time-course is presented in Table 1.
The proposed method to predict time-course
labels consists of several steps. First each image is
pre-processed to find the area around the droplet and
align each image according to the time-course. Next
the difference images are obtained by obtaining the
difference between the first image in a time-course
and the rest. Then single frame classification is
carried out using both original and difference images,
and the results obtained from single frame
classification are used for time-course label
prediction. An overview of the approach is presented
in Figure 1. This paper mainly concentrates on the last
step, namely time-course prediction.
3.1 Data
The data for this work was acquired from C3
(Collaborative Crystallisation Centre), CSIRO,
Melbourne, Australia. Each image data set is the
result of observing crystallisation experiments over a
period of time, from one hour to 10 weeks after the
start of the experiment. The set of images belonging
to one experiment is called a time-course (Table 1).
The images are gray scale and each provides a
snapshot of changes inside the experimental droplet
at that point in time.
ICPRAM 2017 - 6th International Conference on Pattern Recognition Applications and Methods
664
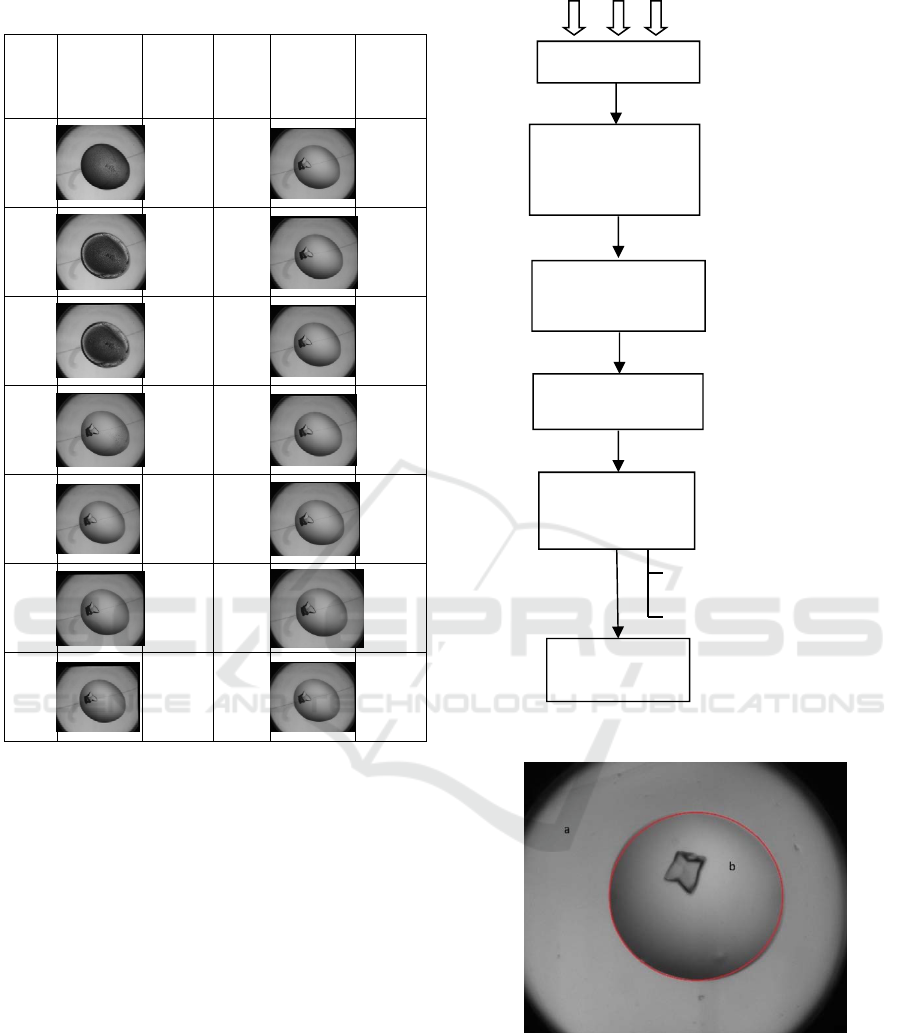
Table 1: A crystal producing time-course with time stamps.
Frame
numbe
r
Frame
Time
stamp
Frame
number
Frame
Time
stamp
1
1 hour
8
2
weeks
2
5
hours
9
3
weeks
3
10
hours
10
4
weeks
4 1day 11
5
weeks
5
2 days
12
6
weeks
6
5 days
13
7
weeks
7
1
week
14
8
weeks
3.2 Pre-processing and Frame
Classification
Images belonging to a time-course are first arranged
according to acquisition time (step 2, Figure 1), and
the area of the droplet (Figure 2) is identified using
the droplIt algorithm (Vallotton et al., 2010). Then the
difference images are computed (step 3, Figure 1).
This has been explained in more detail elsewhere
(Mele et al., 2013). Next feature extraction (step 4,
Figure 1) is carried out (Lekamge et al., 2013).
After pre-processing, classification of single
frames is carried out using multi-view learning, with
random forests as the classifier for each view
(Lekamge et al., 2016) (step 5, Figure 1) The MVL-
based algorithm for single frame classification will be
termed as Crys_MVL_RF hereafter.
Figure 1: System overview.
Figure 2: Droplet in a well (a)Well area (b) Droplet area.
3.3 Prediction of Time-course Labels
To predict the final outcome of a protein
crystallisation experiment, named time-course
prediction hereinafter, the single frame classification
results obtained using Crys_MVL_RF are used as the
starting point. During single frame classification,
1. Input Images
2. Arrange images
according to the
time-course
3. Difference
image calculation
Image Segmentation
Image Classification
5. Single frame
classification
6. Time-course
prediction
4. Feature
extraction
Prediction of Protein X-ray Crystallisation Trial Image Time-courses
665
each image is labelled as belonging to one of the
following classes:
i. Crystal
ii. Precipitation
iii. Skin
iv. Clear and
v. Other
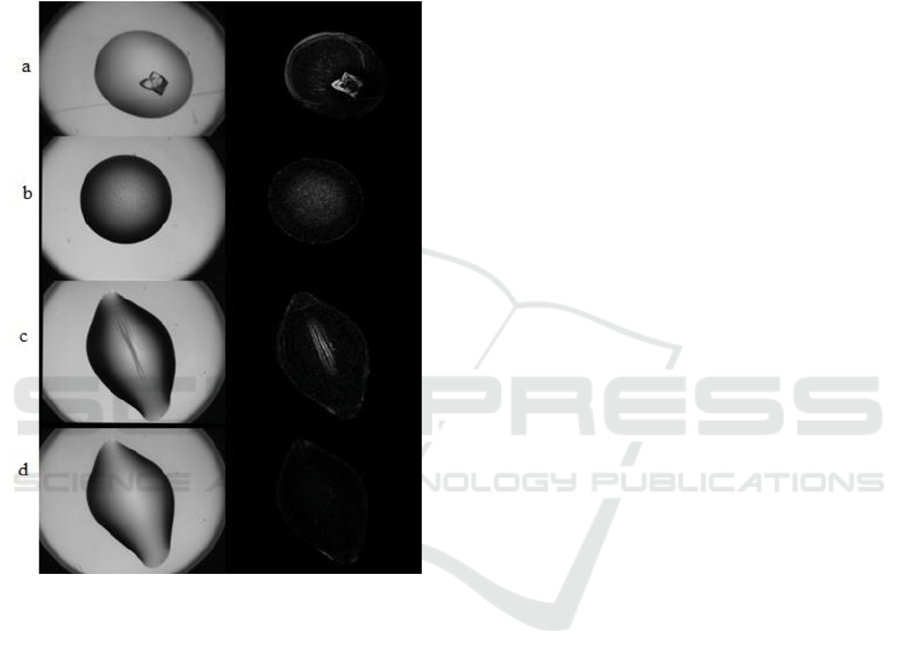
Some examples of these classes are presented in
Figure 3.
Figure 3: Classification examples. The original and
respective difference images (a) crystal (b) precipitation (c)
skin and (d) clear (Lekamge et al., 2016).
For the time-course prediction experiments, only
four classes were used; the skin class was again re-
classified into one of the following classes.
i. Crystal
ii. Precipitation
iii. Clear
iv. Other
Random Forests was used, along with the frame
classification results, to predict the whole time-course
label. The number of frames used in prediction was
varied systematically and the corresponding
prediction accuracies were computed. The least
number of frames required to make an accurate
prediction of the final outcome of a protein crystal
experiment was then picked out.
The purpose of predicting the final outcome of a
crystallography time-course is to identify at the
earliest the experiments that are most likely to
produce interesting results. In turn this would allow
discontinuation of those experiments that are unlikely
to have interesting outcomes. The images produced
by the experiments were grouped together into a
dataset based on the protein sample, as the number of
frames in a crystallography experiment depends on
the settings chosen for imaging purposes, and these
remain constant for a specific protein. These datasets
were obtained during separate experiment rounds.
For each dataset, Random Forests was used as the
prediction algorithm and the single frame results
obtained using Crys_MVL_RF were reused as the
input. The experiments were repeated for different
numbers of training frames in each round per time-
course, and the prediction outcomes were computed
in each round. The number of frames was increased
by one in every iteration of these experiments.
4 RESULTS
The results are presented below on a per-protein
basis, as that is the basis for grouping into a dataset.
MA003389 Dataset: This dataset has 15 frames in
each time-course, and at every round of training an
extra frame was added to the training set until 14
frames were used for training. The prediction of the
final frame was recorded at each round. This dataset
has 96 time-courses. For classification, Random
Forests was used with 10 times 10-fold cross
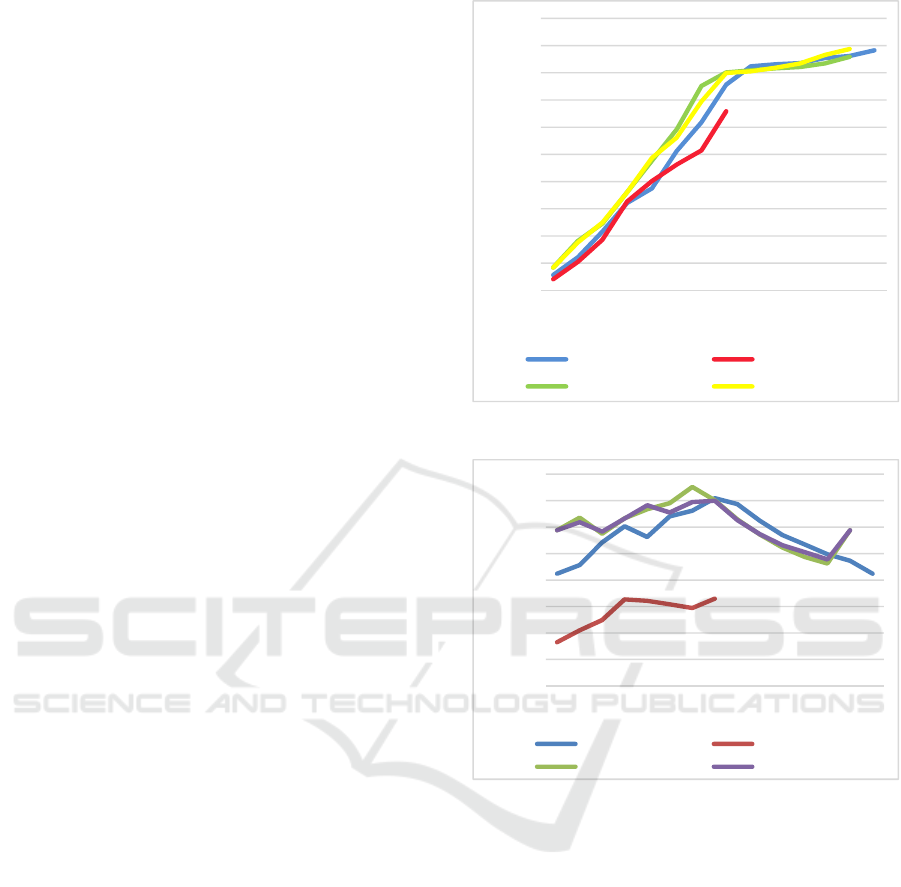
validation. The results obtained are illustrated in Fig.
4 (blue line).
From the results, it is clear that the prediction
accuracy increases rapidly up to the eighth frame,
thereafter the accuracy increases much more slowly
and tails off after about 10 frames. Therefore, the
crystallographer could choose to terminate the
experiments after 8-10 timeframes, depending on the
urgency and need to conserve resources.
MA100420 Dataset:
This dataset has only 9
frames in each time-course and at every round an
extra frame was added to the training set until upto 8
frames. The prediction of the final outcome was
recorded for each round as before. This dataset also
has 96 time-courses. Random Forests was used for
prediction and the results obtained are illustrated in
Fig. 4 (red line)
On analysing the results, it can be seen that even
though the prediction accuracy keeps increasing as
expected, the highest prediction accuracy achieved is
lower compared to the MA003389 dataset. It appears
ICPRAM 2017 - 6th International Conference on Pattern Recognition Applications and Methods
666
that a total of 9 frames is insufficient and extending
the crystallography experiments for a longer period of
time might help. More experimental data is needed to
verify the trend and evaluate the utility of extending
the time period.
MC006299 Dataset: This dataset has 14 frames in
each time-course and in every round an extra frame
was added to the training set until upto 13 frames, and
the prediction of the final frame label was recorded
for each round. This dataset has 192 time-courses.
Random Forests was used again for these
experiments. The results obtained for this dataset are
illustrated in Fig. 4 (green line).
On analysing the results for the MC006299
dataset, it is clear that the prediction accuracy follows
a similar pattern to MA003389, with the prediction
accuracy increasing steadily until the eighth frame,
then tailing off. In this case, the recommendation to
terminate the crystallography experiments after 8
frames is very clear and easy to make.
MC007204 Dataset: This dataset again has 14
frames in each time-course and in every round an
extra frame was added to the training set until up to
13 frames, and the prediction of the final frame label
was recorded for each iteration. This dataset has 192
time-courses as well. Random Forests was used again
in these experiments. The results obtained for this
dataset are illustrated in Fig. 4 (yellow line).
On analysing these results, it can be seen that the
results obtained by this dataset are similar to both
MA003389 and MC006299 datasets. The results also
show a steady increase in prediction accuracy until
the eighth round, then more modest increase. The
choice to terminate after 8 frames is available, if
desired.
By analysing the results for all the datasets, it can
be seen that the highest prediction accuracy obtained
is 88.75%. However, this accuracy is attained only
when all the frames before the final frame are used
for training, and therefore is quite expensive.
To estimate the minimum number of frames
necessary for prediction of a time-course label, the
best accuracy ratio per number of frames used is
computed. The formula is presented below:
=
{(/
)} ∗
-- (1)
The prediction accuracy ratio was computed for
all the datasets and is presented in Fig 5.
On analysing the values and trends for the
prediction accuracy ratio, it can be seen that except
for the dataset MC006299 all the datasets attain the
Figure 4: Prediction results for all datasets.
Figure 5: Prediction accuracy ratio for all datasets.
peak value of the prediction accuracy ratio on frame
8, with the MC006299 dataset attaining its peak at
frame 7. For dataset MA100420 (represented by the
red line graph), the peak value is impossible to
declare as it has only 8 frames per time-course.
5 CONCLUSIONS
By analysing the values of the prediction accuracy
ratios, it is possible to declare that the best possible
number of frames for prediction is 8 frames as the
increase in prediction accuracy is relatively low after
that, and in fact the crystallography experiments may
be terminated after 8 frames. These results also co-
incide with the observations reported by Ng et al who
observed the experiments carried out at the Oxford
0
10
20
30
40
50
60
70
80
90
100
1234567891011121314
Prediction accuracy
Number of frames used for training
MA003389 MA100420
MC006299 MC007204
0
20
40
60
80
100
120
140
160
123456789101112131415
Prediction accuracy
Number of frames used for training
MA003389 MA100420
MC006299 MC007204
Prediction of Protein X-ray Crystallisation Trial Image Time-courses
667

site of the Structural Genomics Consortium (Ng et al.,
2016). More experiments can be carried out using
different protein solutions to confirm the number of
frames required to accurately predict the final
outcome of a time-course in the future. Moreover,
details about the protein solutions also can be used
along with the frame labels in order to confirm the
prediction accuracy.
REFERENCES
Babcock, B., Datar, M. & Motwani, R. 2002. Sampling
from a moving window over streaming data.
Proceedings of the thirteenth annual ACM-SIAM
symposium on Discrete algorithms. San Francisco,
California: Society for Industrial and Applied
Mathematics.
Buchala, S. & Wilson, J. C. 2008. Improved classification
of crystallization images using data fusion and multiple
classifiers. Acta Crystallographica Section D, 64, 823-
833.
Cumbaa, C. & Jurisica, I. 2005. Automatic classification
and pattern discovery in high-throughput protein
crystallization trials. J Struct Funct Genomics, 6, 195-
202.
Dessau, M. A. & modis, Y. 2011. Protein crystallization for
X-ray crystallography. JoVE (Journal of Visualized
Experiments), e2285-e2285.
Dietterich, T. G. 2002. Machine learning for sequential
data: A review. Structural, syntactic, and statistical
pattern recognition. Springer.
Gama, J., Sebastião, R. & RODRIGUES, P. P. 2013. On
evaluating stream learning algorithms. Machine
Learning, 90, 317-346.
Kotseruba Y, Cumbaa, C. A. & Jurisica, I. 2012. High-
throughput protein crystallization on the World
Community Grid and the GPU. Journal of Physics:
Conference Series, 341, 012027.
Lekamge, B. M. T., Sowmya, A., Mele, K., Fazio, V. J. &
Newman, J. 2013. Classification of protein
crystallisation images using texture-based statistical
features. AIP Conference Proceedings, 1559, 270-276.
Lekamge, B. M. T., Sowmya, A. & Newman, J. 2016.
Multi-view Learning for Classification of X-Ray
Crystallography Images. Machine Learning and Data
Mining in Pattern Recognition. Springer.
Li, J., Maier, D., Tufte, K., Papadimos, V. & Tucker, P. A.
2005. No pane, no gain: efficient evaluation of sliding-
window aggregates over data streams. SIGMOD Rec.,
34, 39-44.
Mele, K., Lekamge, B. T., Fazio, V. J. & Newman, J. 2013.
Using Time Courses To Enrich the Information
Obtained from Images of Crystallization Trials. Crystal
Growth & Design, 14, 261-269.
Newman, J., Xu, J. & Willis, M. C. 2007. Initial evaluations
of the reproducibility of vapor-diffusion crystallization.
Acta Crystallographica Section D, 63, 826-832.
Ng, J. T., Dekker, C., Reardon, P. & Von Delft, F. 2016.
Lessons from ten years of crystallization experiments at
the SGC.
Acta Crystallographica Section D: Structural
Biology, 72, 224-235.
Vallotton, P., Sun, C., Lovell, D., Fazio, V. J. & Newman,
J. 2010. DroplIT, an improved image analysis method
for droplet identification in high-throughput
crystallization trials. Journal of Applied
Crystallography, 43, 1548-1552.
Walker, C. G., Foadi, J. & Wilson, J. 2007. Classification
of protein crystallization images using Fourier
descriptors. Journal of Applied Crystallography, 40,
418-426.
Watts, D., Cowtan, K. & Wilson, J. 2008. Automated
classification of crystallization experiments using
wavelets and statistical texture characterization
techniques. Journal of Applied Crystallography, 41, 8-
17.
Wilson, J. C. & Wilson, J. C. 2006. Automated
Classification of Images from Crystallisation
Experiments. In: Perner, P. & Perner, P. (eds.)
Advances in Data Mining: Applications in Medicine,
Web Mining, Marketing, Image and Signal Mining.
Springer Berlin / Heidelberg.
Yang, X., Chen, W., Zheng, Y. & Jiang, T. 2006. Image-
Based Classification for Automating Protein Crystal
Identification. In: Huang, D.-S., LI, K. & Irwin, G.
(eds.) Intelligent Computing in Signal Processing and
Pattern Recognition. Springer Berlin Heidelberg.
ICPRAM 2017 - 6th International Conference on Pattern Recognition Applications and Methods
668
