
Demand-Response: Let the Devices Take our Decisions
Guillaume Guerard, Bastien Pichon and Zeinab Nehai
L
´
eonard de Vinci P
ˆ
ole Universitaire, Research Center, 92916 Paris La D
´
efense, France
Keywords:
Demand-Side Management, Demand-response, Smart Grid, Automaton, Game Theory.
Abstract:
The hierarchical, centrally controlled energy grid is ill-suited to the third digital revolution. The electric power
industry is undergoing rapid change. The energy transition move from the current energy system using non-
renewable resources to a smart grid, including distributed resources and home automation. Now, the demand is
flexible and can be managed, it is called Demand-Side-Management (DSM). It encompasses different domains
of reducing consumption, it can be both a physical standpoint than digital. In this paper, after a quick state of
an art on DSM, we will focus on the digital way. The main idea is to create consumption’s schemes, thanks to
home automation in order to find the best way to consume.
1 INTRODUCTION
The creation of the Smart Grid has been posed as one
of the greatest challenges of this century, as countries
face dwindling non-renewable energy sources and the
adverse effects of climate change due to carbon emis-
sions
1
.
The vision of a Smart Grid includes technologies
that enable the efficient integration of new sources
of energy. It will smooth demand by allowing con-
sumers to better manage how electricity is used,
stored, and delivered. However, the balance between
demand and production is not an easy task. Both sup-
ply and demand levels can change rapidly due to out-
ages, sudden load change or volatile renewable en-
ergy sources.
The term Demand-Side Management, introduced
in 80s by the Electric Power Research Institute, refers
to all strategies that can reduce the consumption and
peak demand (e.g., in (Ruiz et al., 2009; Centolella,
2010)). The trend started in the 70s, and became
rapidly a government project.
The DSM encompasses all means possible in re-
ducing energy in a house or a building: a top wall in-
sulation prevents heat dissipation, so a thermal energy
loss; light sensors avoid waste lighting; smart devices
reduce power consumption; photo-voltaic panels on
the roof produce electricity for a home.
One of recent industrial developments concern the
concept of the smart meter which aims to manage the
1
US DOE, Grid 2030: A national vision for electricity’s
second 100 years, 2003
devices in the home to minimise inefficiencies in us-
age and maximise the user’s savings. Smart meters
also aim to interact with the grid in order to help re-
duce peaks in demand and keep up with variable en-
ergy generators or batteries
2
. This approach has been
shown to be effective for small pool sizes of indus-
trial and commercial consumers (Hammerstrom et al.,
2007).
While such DSM techniques have been shown to
bring about significant improvements on a small num-
ber of houses, it is unclear how such technologies will
scale when smart meters with millions of homes or
buildings nationwide. In particular, the centralized
management of even thousands of smart meters is
likely to be a complex task that may require intrud-
ing upon user’s privacy to cater for all homes.
The fact that increasingly more and more features
of the home are likely to be electrified in the future
(Galvin and Power, 2009), means that more signifi-
cant peaks may be created due to the reactive behavior
of the smart devices. Nonetheless, without some form
of coordination, the population of smart grid entities
may end up with overly-homogeneous optimized con-
sumption patterns that may generate significant peaks
in demand in the grid.
In a collaborative system such as the smart grid,
fairness and stability is important when taking a deci-
sion. If, for example, a number of devices can shed
their load, and already one of them shedding is suf-
ficient, it might always be the quickest that wins the
2
DECC Smarter Grids report, The Opportu-
nity,December 2009
Guérard, G., Pichon, B. and Nehai, Z.
Demand-Response: Let the Devices Take our Decisions.
DOI: 10.5220/0006196601190126
In Proceedings of the 6th International Conference on Smart Cities and Green ICT Systems (SMARTGREENS 2017), pages 119-126
ISBN: 978-989-758-241-7
Copyright © 2017 by SCITEPRESS – Science and Technology Publications, Lda. All rights reserved
119

monetary incentive. With communication, it can be
arranged that all of them have their turn. Without
communication, all of them react to grid problems in
the same manner (Palensky and Dietrich, 2011). It is
the perfect recipe for instabilities.
There is a need to deploy innovative models and
algorithms that capture the following characteris-
tics of the emerging smart grid: communication in
a heterogeneous system, distributed operation, low-
complexity distributed algorithms (Saad et al., 2012).
This paper provides a classification of DSM pro-
grams and a categorization of devices for home au-
tomation management. It also exposes a descrip-
tion of a model that would optimize the Demand-
Response, a DSM programs which focuses on a digi-
tal aspect. This model is generic and is applicable to
any network.
First of all, in section 2, we introduce the notion of
Demand-Side Management, a classification about the
intrinsic concepts. Then we expose a solution in sec-
tion 3 about the management of smart devices through
Demand-Response strategies. The section 4 describes
how to build consumption’s schemes, thanks to home
automation and generic modeling. The section 5
shows a game theoretic approach to avoid peak de-
mand and optimize each consumer’s comfort.
2 DEMAND SIDE MANAGEMENT
DSM is a fuzzy concept which has various definitions.
DSM programs usually refer to one or both of the fol-
lowing design objectives: reducing consumption and
shifting consumption. DSM can be as well an energy
reduction by using insulating materials for the home,
or using devices controlled numerically.
2.1 Introduction to DSM
In (Saad et al., 2012), a survey about DSM pro-
grams, the authors define DSM as programs that at-
tempt to make the users more energy-efficient on a
longer time-scale. They also define the term Demand-
Response as programs that utility companies use to
encourage the grid users to dynamically change their
electricity load so as to have a short-term reduction in
energy consumption.
In other words, the goal of the DSM is to en-
courage the consumer to use less energy during peak
hours, or to move the time of energy use to off-peak
times such as nighttime. Peak demand management
does not necessarily decrease total energy consump-
tion, but could be expected to reduce the need for in-
vestments in networks and/or power plants for meet-
ing peak demands.
First DSM programs are based on energy effi-
ciency measures. They include all permanent changes
on equipment or improvements in the physical prop-
erties of the system (Boshell and Veloza, 2008).
Numeric DSM programs are based on two
schemes: direct load control and smart pricing. They
focused on the interactions between producers and
each individual end-user. Direct control enables to
control the appliances inside a building, smart pricing
provides monetary incentives for the users.
The definition varies, but in all cases, the benefits
of DSM programs are for all actors. An overall elec-
tricity price reduction is expected because of a more
efficient using of the infrastructure. The smart grid fa-
vors using local renewable energies or batteries than
to activate coal plants. Moreover, DSM programs can
increase short-term capacity using market-based pro-
grams, which in turn, results in an avoided or deferred
capacity costs.
The generation cost increases exponentially near
maximum generation capacity. A small reduction in
demand will result in a big reduction in generation
cost and, in turn, a reduction in electricity price, that
affect all market participants. All of the avoided or de-
ferred costs will be reflected in the price of electricity
for all electricity consumers.
By having a well-designed DSM program, users
also have the opportunity to help in reducing the risk
of outages. Simultaneously and as a consequence,
they reduce their own risk of being exposed to forced
outages and electricity interruption. On the other
hand, the operator will have more options and re-
sources to maintain system reliability, thus reducing
forced outages and their consequences (Goel et al.,
2006).
Rather, a bad DSM program creates a rebound ef-
fect (or payback), is typically not saved and maybe
even a new peak is generated. In this figure, EE means
Energy Efficiency and DR means Demand-Response.
We will define those two terms in the following sub-
section.
2.2 Classification
This section is dedicated to classifying some pro-
grams by a set containing similar programs. The Fig-
ure 1 shows the classification.
We usually use devices or appliances at work and
at home. Thus, social behaviors have a big impact
on consumption. The Change Management (CM) is a
set of incentive programs and social programs in or-
der to create responsible behaviors, like sorting the
SMARTGREENS 2017 - 6th International Conference on Smart Cities and Green ICT Systems
120
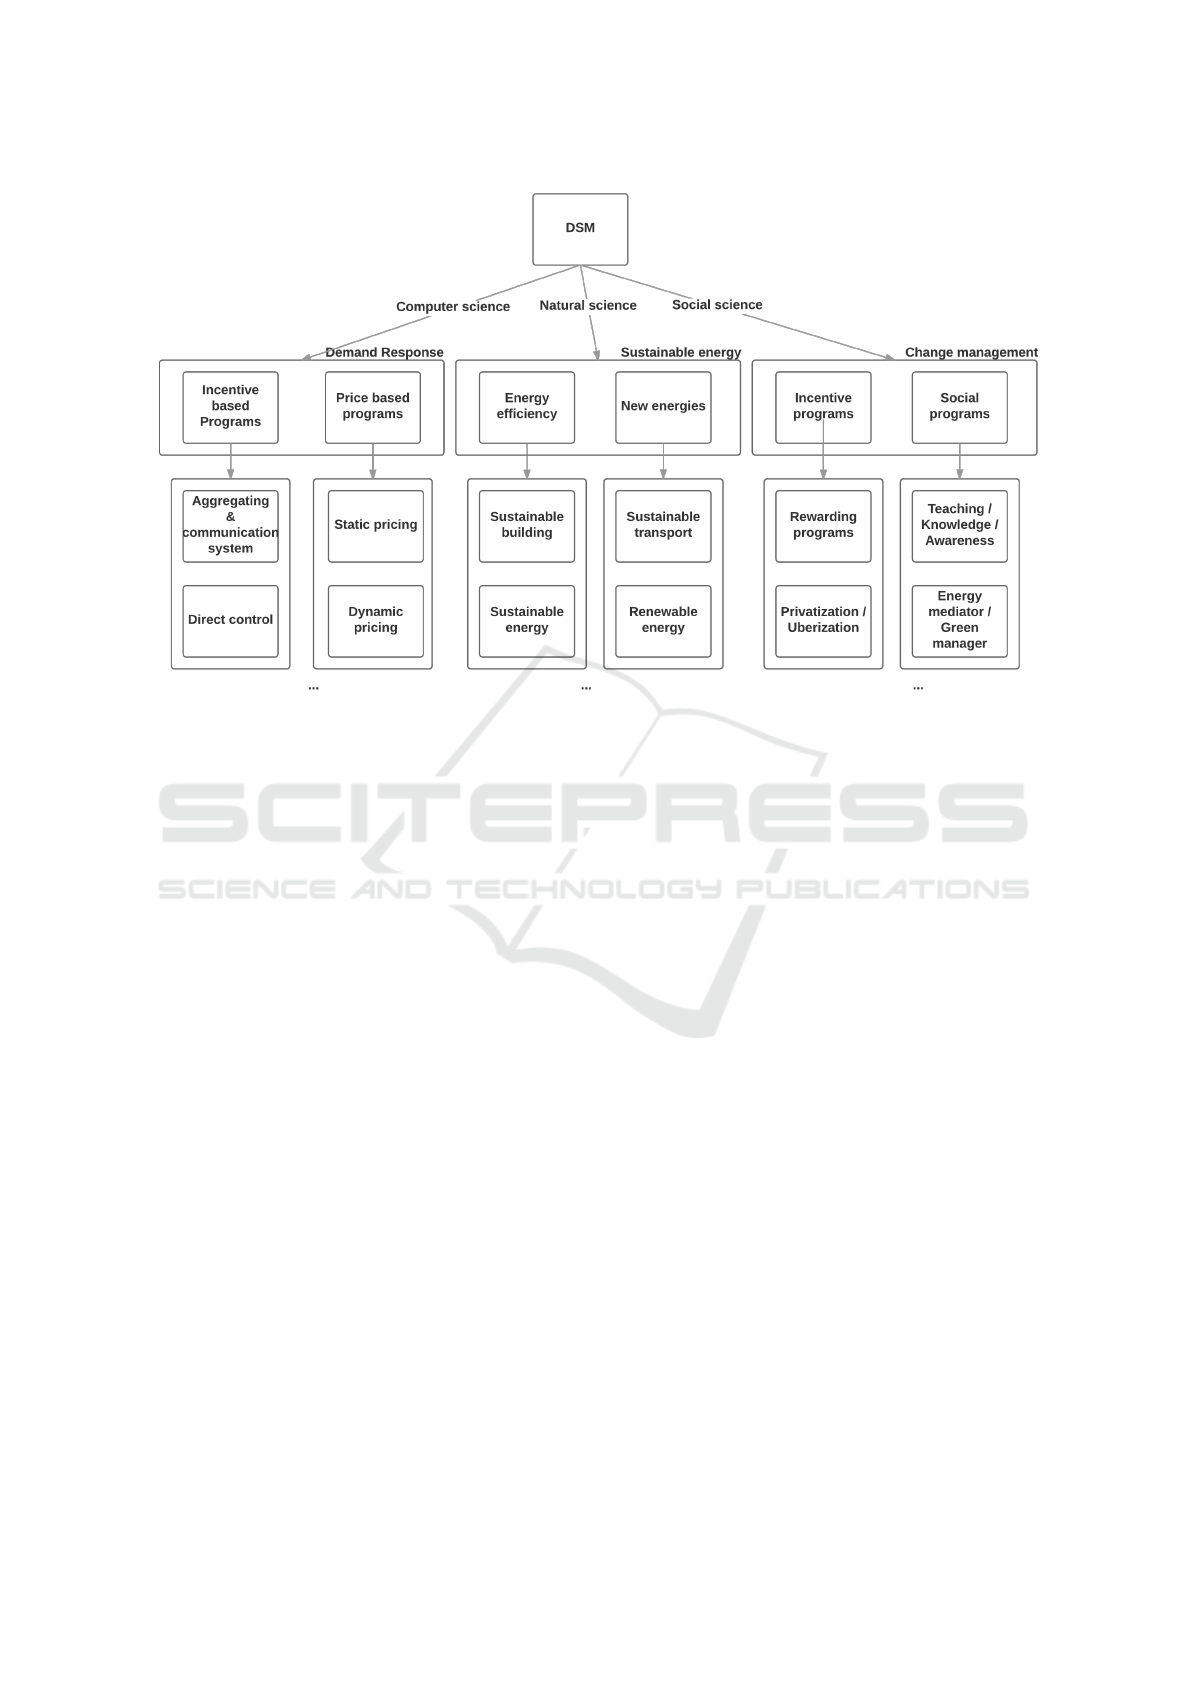
Figure 1: Classification of DSM types.
wastes in the late 90s. People need some information,
knowledge and teaching about home automation, sus-
tainable energy, energy management’s dashboard or
any other current of future technologies which will
interact in the smart grid. By the way, CM has to give
awareness about the two other edges of DSM: Sus-
tainable Energy (SE) and Demand-Response (DR).
The SE includes all permanent changes in equip-
ment or improvements in the physical properties of
the system (Boshell and Veloza, 2008). By defini-
tion, Energy Efficiency (EE) is the goal to reduce the
amount of energy required to provide products and
services. Using less power to perform the same tasks.
In simple words, SE involves a permanent reduc-
tion of demand by using more efficient load-intensive
appliances such as water heaters, refrigerators, or
washing machines. For example, insulating a home
allows a building to use less heating and cooling en-
ergy to achieve and maintain a comfortable tempera-
ture. Installing fluorescent lights, LED lights or nat-
ural skylights reduces the amount of energy required
to attain the same level of illumination compared with
using traditional incandescent light bulbs.
Improvements in the SE are generally achieved
by adopting a more efficient technology or produc-
tion process or by application of commonly accepted
methods to reduce energy losses.
The last but not least edge of DSM is the DR, it
allows to know how electricity consumers can be re-
sponsive. DR programs follows, including classical
incentive programs, new market-based and dynamic
pricing scenarios, besides potential cost savings and
benefits related to different market components, it
performs digital control of consumption.
2.3 About Demand-Response
According to the Federal Energy Regulatory Com-
mission, DR is defined as:
The changes in electricity usage by end-use
customers from their normal consumption pat-
terns in response to changes in the price of
electricity over time, or to incentive payments
designed to induce lower electricity use at
times of high wholesale market prices or when
system reliability is jeopardized.
To resume, DR includes all intentional modifica-
tions to consumption patterns of electricity to induce
customers that are intended to alter the timing, level
of instantaneous demand, or the total electricity con-
sumption (Albadi and El-Saadany, 2007).
We notice two categories of devices that you can
apply DSM: those that includes DR programs and
those that don’t. Examples of the latter include light-
ing, entertainment devices, phone charging and com-
puter usage. Those devices interact with the grid
through automatic process thanks to sensors or inte-
grated circuit. This kind of process cannot be quali-
fied as ”smart”, i.e. not flexible and not adaptive.
Demand-Response: Let the Devices Take our Decisions
121

DR programs can be classified into two main
categories: Incentive-Based Programs (IBP) and
Price-Based Programs (PBP) (Albadi and El-Saadany,
2008; Cappers et al., 2010).
In IBP, participating customers receive participa-
tion payments, usually as a bill credit or discount rate.
Those following programs are part of IBP: direct load
control, curtaible rates, emergency demand response,
capacity market program, demand bidding program
(Ramchurn et al., 2011).
PBP programs are based on dynamic pricing rates
in which electricity tariffs are not flat; the rates fluc-
tuate following the real time cost of electricity. These
rates include the Time of Use (TOU) rate, Critical
Peak Pricing (CPP), Extreme Day Pricing and Real
Time Pricing (RTP) (Rahman et al., 1993; Ramchurn
et al., 2011). Many studies on PBP programs offer an
overview of the rebound effect.
The TOU pricing simply biases the real price of
electricity in order to incentive users who typically
aim to maximize their savings, to shift their loads
to off-peak periods (i.e., when aggregate demand is
lower). However, where the price of electricity at
night is cheaper than during the day, the TOU pric-
ing has been observed to create significant additional
peaks in demand as soon as the off-peak period is
reached (Ramchurn et al., 2011; Strbac, 2008).
There exists a lot of alternatives, hybrid programs
such as Smart Pricing, where users are encouraged to
individually and voluntarily manage their loads, e.g.,
by reducing their consumption at peak hours (Cen-
tolella, 2010; Herter, 2007). Some scheduling pro-
grams using CPP, TOU pricing, and RTP are among
the popular options.
DR includes automatic process and decision mak-
ing process. In this paper, we present a decision mak-
ing model to manage home automation in response
to an RTP based on produced energy price, not on a
supply/demand energy market price.
3 PROCESS OF OUR MODEL
A smart grid must allow customers to make informed
decisions about their energy consumption, adjusting
both the timing and quantity of their electricity use.
The process of our model is as follows:
Step 1, Data Update: at the beginning of a new iter-
ation, sensors and automata update data.
Step 2, Consumption’s schemes (Figure 2):
through a knapsack problem and thanks to
automaton, consumption’s schemes are built
(Section 4). They represent all the consumption
possibilities in a smart house.
Step 3, Game for Demand-Response (Figure 3):
a game between each consumer and producer
is created. Strategies depend on consumption’s
schemes and producers’ response. The best
economic choice in the game is chosen (Section
5).
Step 4, Decision: following to the previous decision,
the smart grid computes how energy is routed
across the grid. In function of the result, the final
decision is taken or a feedback adjusts the game.
The process of the whole model is presented in
(Ahat et al., 2013). This paper improves the local and
microgrid management.
4 CONSUMPTION’S
STRATEGIES
Technologies are available, and more are under devel-
opment, to automate the process of DR. Such tech-
nologies detect the need for load shedding, commu-
nicate the demand to participating users, schedule
load shedding, and verify compliance with demand-
response programs. GridWise and EnergyWeb are
two major federal initiatives in the United States to
develop these technologies. Universities and private
industry are also doing research and development in
this field.
In this section, we provide our approach through
automation and a set of consumption’s schemes. Each
prosumer build its set on each possibility of consump-
tion of the local devices. Then, the set is sent to the
microgrid. In function of how the grid will react, the
best strategy is chosen for each prosumer through a
game. Figures 2 and 3 show an overview of the pro-
cess, see references in section 3 for more information
about the process.
4.1 DR Programs
Let us remind you the definition of DR programs.
They include all intentional electricity consumption
pattern modifications by end-use customers that are
intended to alter the timing, level of instantaneous de-
mand, or total electricity consumption (Albadi and El-
Saadany, 2008).
There are four general actions by which a cus-
tomer response can be achieved (QDR, 2006; Sezgen
et al., 2007; Valero et al., 2007):
Reducing Power: customers can reduce their elec-
tricity usage during critical peak periods when
prices are high without changing their consump-
tion pattern during other periods.
SMARTGREENS 2017 - 6th International Conference on Smart Cities and Green ICT Systems
122
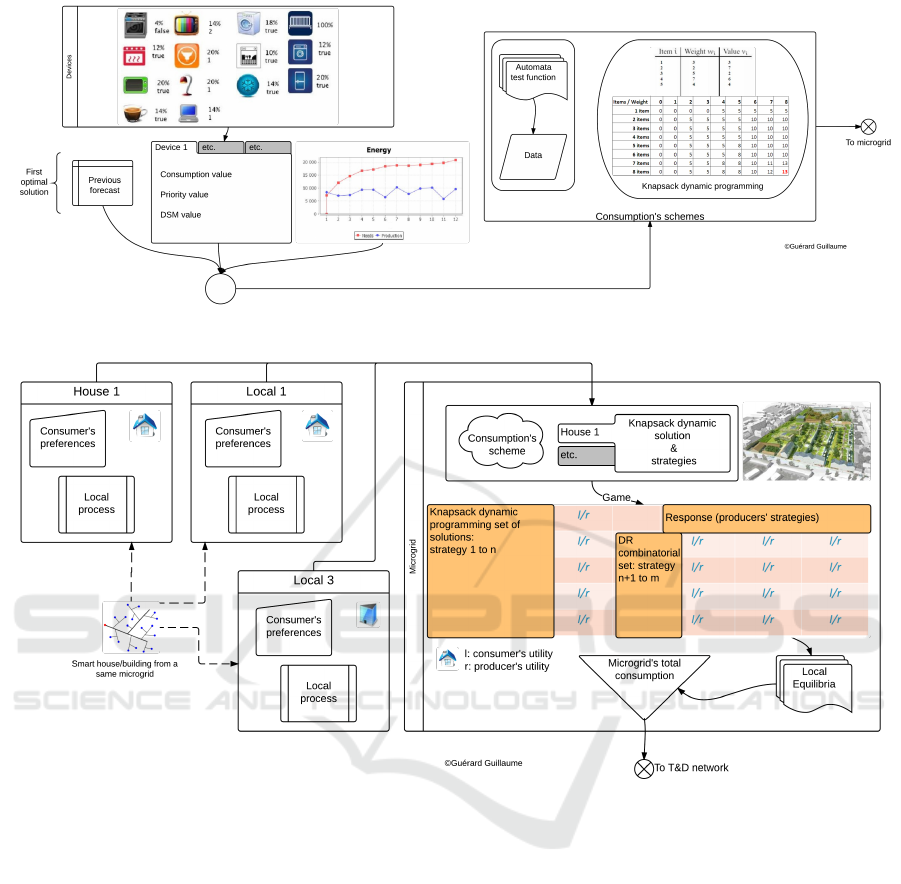
Figure 2: From devices to consumption’s schemes.
Figure 3: From consumption’s schemes to a microgrid game.
Shifting: customers respond to high electricity prices
by shifting some of their peak demand operations
to off-peak periods.
Spinning Reserves: customers use local batteries
and distributed generation combined with loads’
management.
Emergency Cut: when the peak demand is still ac-
tive even after the first three actions, an emergency
cut is operated.
Reducing power involves turning down or off spe-
cific appliances. For example, heating may be turned
down or air conditioning or refrigeration may be
turned up, delaying slightly the draw until a peak in
usage has passed (Sinitsyn et al., 2013). The success
of such programs depends on a suitable pricing sys-
tem for electricity.
In shifting load, the load is shed at the critical time
and the process has to catch up later. For this, load
models are needed. They predict how long devices
can be turned off, how much it takes to fill the storage,
and what it costs (Kupzog and Palensky, 2007). The
strategies to manage loads are complex and need to
communicate with the grid to establish a schedule.
Spinning reserve is done with batteries. It tries to
support the traditional providers of ancillary services
by imitating their behavior. Two implementations of
this scheme are the Integral Resource Optimization
Network (IRON) (Stadler et al., 2005) and the grid-
friendly controller (Cantin et al., 1995). Both mea-
sures the frequency and react to it. The difference is
that IRON has an additional communication interface
that allows cooperative algorithms, i.e. a consensus
among devices.
Energy storage is expected to be a key component
in smart homes, and, thus, it has a strong impact when
Demand-Response: Let the Devices Take our Decisions
123

used with home automation and local renewable ener-
gies. For example, a user may decide to store energy
during off-peak hours and use this stored energy to
schedule its appliances, instead of obtaining this en-
ergy directly from the substation during peak hours.
4.2 Devices Classification
There are many ways to classify devices. Some clas-
sify devices according to their usefulness or inner
workings (wet, cold, water heating, etc.) (Hamidi
et al., 2009). We follow some simple rules in our
classification (see Figure 4): can the device follow
DR programs? which data are useful for a device?
The classification is made in order to categorize all
existing devices and the ones which will be created.
The No DR programs gather devices which can-
not be controlled by a decision making process, but
still can be managed by sensors. The devices may be
Cyclic or Acyclic, and with Sensors.
Cyclic means the devices which have an operating
cycle (i.e. boilers, coffee maker), they have a start, an
operating time defined, and an end. These kind of de-
vices cannot be controlled because their uses are un-
predictable and immediate. So do the acyclic devices
which encompass the most household machines (i.e.
vacuum cleaner, blender, TV, radio, microwave, iron,
modem, telephone, DVD player, printer, oven).
The third one includes devices controlled by sen-
sors, it concerns more generally lighting. The light-
ing control is based on a brightness sensor assembly,
which estimates the amount of light for a room ac-
cording to the natural light received from the outside.
In this model, devices are controlled by automa-
ton in order to optimize their own consumption. A
device is defined by a set of four categories, it picks
one element of each category:
1. the device is cyclic (i.e. washing machine) or
acyclic (i.e freezer)
2. the device has or doesn’t have batteries
3. which data are used: external (i.e. heater in the
room) or internal (i.e internal temperature of the
refrigerator)
4. the device consume, or produce, or both.
Then, a device gets a set of parameters. They are
input values that determine how and when a device
will consume or adjust its consumption following a
DR program. The set includes:
Internal data: they correspond to internal data of the
machine, collected by internal sensors (i.e. tem-
perature inside the fridge).
External data: they correspond to external data of
the machine, in its environment collected by sen-
sors (i.e. the temperature data of a room).
Consumer’s preference: these parameters are the
most important. Because the user should not be
hampered in his daily life, its preferences are the
bounds that devices have to reach (i.e. which tem-
perature the consumer prefers in its bedroom).
Price: consumers, as described in (Kirschen et al.,
2000), consider both current prices and the prices
of one step into the future. To perform shifting,
devices have to know how to schedule their con-
sumption. In our model, we use current prices,
prices of one step into the future and price trend.
The last two are calculated from derivative func-
tion, norms and a pricer.
5 GAME THEORY AND BEST
CONSUMPTION’S
STRATEGIES
The authors in (Mohsenian-Rad et al., 2010) show
that it is better to develop a DR approach that opti-
mizes the properties of the aggregate load of the users.
This is enabled by the deployment of communication
technologies that allow the users to coordinate their
energy usage, when this is beneficial.
The essence of DR revolves around the interac-
tions between various entities with specific objectives
which are reminiscent of the players’ interactions in
game theory. As Saad et al. said (Saad et al., 2012):
Game theory provides a plethora of tools that
can be applied for pricing and incentive mech-
anisms, scheduling of appliances, and efficient
interconnection of heterogeneous nodes.
In our model, each smart meter sends all the con-
sumption’s schemes, defined by their automaton, of
their devices. A strategy for a consumer is a combi-
nation of a possible scheme of consumption of each
device. Thus, the number of strategies is a combina-
torial set. For example, if the smart building has four
devices with respectively 2, 3, 3, 4 schemes, the num-
ber of strategies is equal to 72.
The price signal to incentivise the agents may de-
fer their demand. Even if an accurate price signal is
provided, the adaptive and autonomous behaviour of
the agents in the system is a key component that can
enable significant performance benefits in the smart
grid. It’s important to determine how comfort is more
important to the user relative to price. This is done
SMARTGREENS 2017 - 6th International Conference on Smart Cities and Green ICT Systems
124
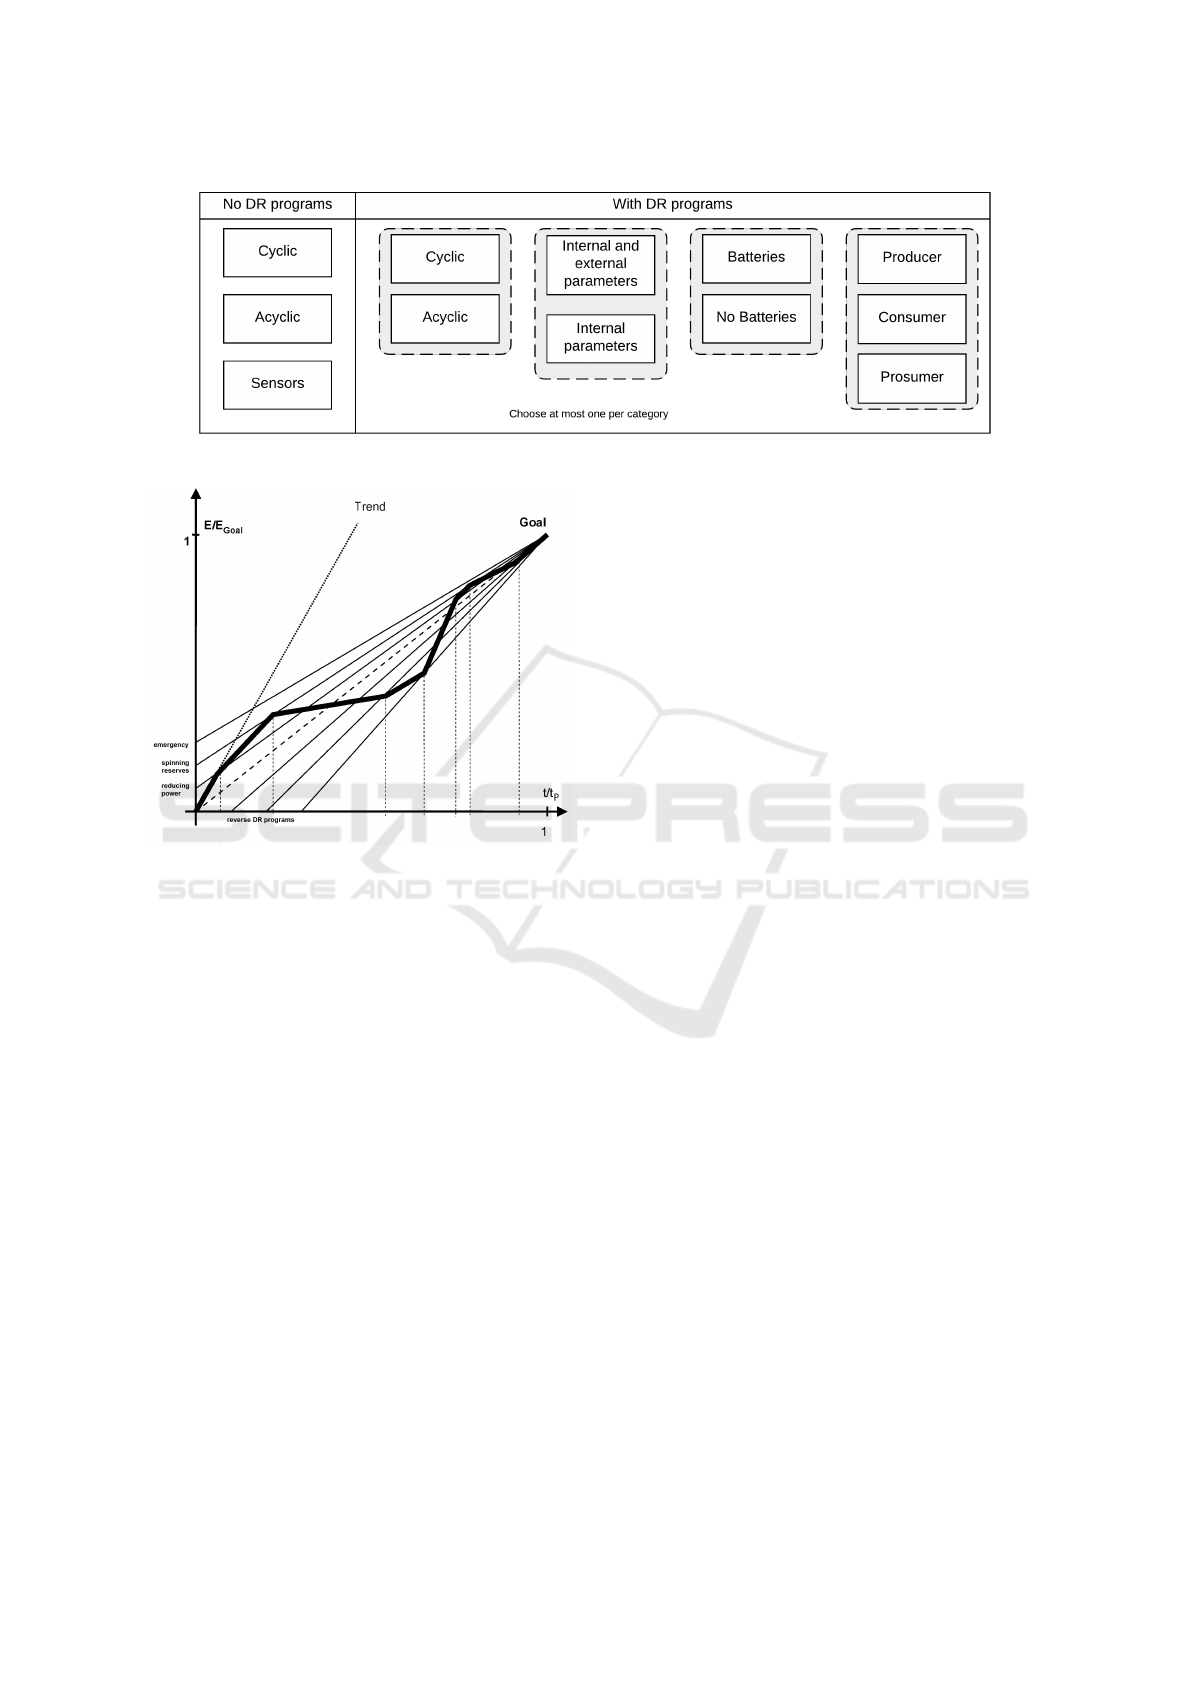
Figure 4: Characterization of a device.
Figure 5: Lipschitz function that manages DR programs.
following the Palenksy et al.’s works (Palensky and
Dietrich, 2011).
Both parameters depend on how much the current
consumption’s curve is far from an ideal consump-
tion’s curve as shown in Figure 5. DR programs like
emergency programs or reducing programs depends
on the value of the k-Lipschitz function.
If the computed load is larger than the previous
one, a DR program is launched. In opposite case,
if the curve is smaller than the previous one, more
devices consume or return to a basic mode of con-
sumption. Different emergency programs trigger de-
pending to how much k in the Lipschitz function is
large. In this way, the global consumption curve flat-
tens over time.
With communication, the shed can be arranged by
the game, i.e. in the same microgrid. Such coordina-
tion also contributes to stability. Imagine a commu-
nity of autonomous, distributed controllers without
communication. All of them reacting to grid prob-
lems increase instabilities. They will do it one after
another to avoid a too strong reaction (Palensky and
Dietrich, 2011).
We don’t argue about the second player is this
paper. This one represents producers, user’s con-
tract and some other properties that depend on gov-
ernment policies about DR. We don’t present an util-
ity function. It depends on the price’s values, user’s
preference, and the feedback function (Gu
´
erard et al.,
2015). Those works will be shown in a future paper
with the feedback process.
Once a strategy is valid, i.e. can be routed from
the producers to the microgrid, the last one send a sig-
nal to the smart building. This consensus is reached
in the whole grid at the same time. Thus, every con-
sumer and prosumer know how to adapt their behav-
ior for the next step. All the generated data is useful
to compute forecasts, future production scheme and to
be used in data mining and machine learning (Gu
´
erard
et al., 2015).
6 CONCLUSION
There is a need to deploy new models and algorithms
that can capture the following characteristics of the
emerging smart grid. It is a current and active field
that will give birth to many innovations and technolo-
gies. The needs to build an efficient and flexible smart
grid are known, and it becomes an urgent matter while
population and technologies increase drastically.
The presented model provides some simple and
useful tools for a generic model of smart grid. This
decision making tool can be used to test existing or
future technologies in a smart grid design. As any
multi-agent system, this model can be set as wanted.
Examples will be made on different sets of microgrid
and a small smart grid.
REFERENCES
Ahat, M., Amor, S. B., Bui, M., Bui, A., Gu
´
erard, G., and
Petermann, C. (2013). Smart grid and optimization.
Demand-Response: Let the Devices Take our Decisions
125

American Journal of Operations Research, 3:196–
206.
Albadi, M. H. and El-Saadany, E. (2007). Demand response
in electricity markets: An overview. In 2007 IEEE
power engineering society general meeting.
Albadi, M. H. and El-Saadany, E. (2008). A summary of de-
mand response in electricity markets. Electric power
systems research, 78(11):1989–1996.
Boshell, F. and Veloza, O. (2008). Review of developed de-
mand side management programs including different
concepts and their results. In Transmission and Dis-
tribution Conference and Exposition: Latin America,
2008 IEEE/PES, pages 1–7. IEEE.
Cantin, L., Deschenes, M., and D’amours, M. (1995). Con-
troller for controlling operation of at least one elec-
trical load operating on an ac supply, and a method
thereof. US Patent 5,442,335.
Cappers, P., Goldman, C., and Kathan, D. (2010). De-
mand response in us electricity markets: Empirical
evidence. Energy, 35(4):1526–1535.
Centolella, P. (2010). The integration of price responsive
demand into regional transmission organization (rto)
wholesale power markets and system operations. En-
ergy, 35(4):1568–1574.
Galvin, R. Y. and Power, K. P. (2009). How the micro-
grid revolution will unleash cleaner, greener, and more
abundant energy. Nova Iorque: McGraw-Hill.
Goel, L., Wu, Q., and Wang, P. (2006). Reliability enhance-
ment of a deregulated power system considering de-
mand response. In 2006 IEEE Power Engineering So-
ciety General Meeting, pages 6–pp. IEEE.
Gu
´
erard, G., Amor, S. B., and Bui, A. (2015). A context-
free smart grid model using pretopologic structure.
In Smart Cities and Green ICT Systems (SMART-
GREENS), 2015 International Conference on, pages
1–7. IEEE.
Hamidi, V., Li, F., and Robinson, F. (2009). Demand re-
sponse in the uk’s domestic sector. Electric Power
Systems Research, 79(12):1722–1726.
Hammerstrom, D. J., Brous, J., Chassin, D. P., Horst, G. R.,
Kajfasz, R., Michie, P., Oliver, T. V., Carlon, T. A.,
Eustis, C., Jarvegren, O. M., et al. (2007). Pacific
northwest gridwise testbed demonstration projects;
part ii. grid friendly appliance project. Technical re-
port, Pacific Northwest National Laboratory (PNNL),
Richland, WA (US).
Herter, K. (2007). Residential implementation of critical-
peak pricing of electricity. Energy Policy, 35(4):2121–
2130.
Kirschen, D. S., Strbac, G., Cumperayot, P., and
de Paiva Mendes, D. (2000). Factoring the elastic-
ity of demand in electricity prices. IEEE Transactions
on Power Systems, 15(2):612–617.
Kupzog, F. and Palensky, P. (2007). Wide-area control
system for balance-energy provision by energy con-
sumers. IFAC Proceedings Volumes, 40(22):337–345.
Mohsenian-Rad, A.-H., Wong, V. W., Jatskevich, J.,
Schober, R., and Leon-Garcia, A. (2010). Au-
tonomous demand-side management based on game-
theoretic energy consumption scheduling for the fu-
ture smart grid. IEEE transactions on Smart Grid,
1(3):320–331.
Palensky, P. and Dietrich, D. (2011). Demand side manage-
ment: Demand response, intelligent energy systems,
and smart loads. IEEE transactions on industrial in-
formatics, 7(3):381–388.
QDR, Q. (2006). Benefits of demand response in electricity
markets and recommendations for achieving them. US
Dept. Energy, Washington, DC, USA, Tech. Rep.
Rahman, S. et al. (1993). An efficient load model for
analyzing demand side management impacts. IEEE
Transactions on Power Systems, 8(3):1219–1226.
Ramchurn, S. D., Vytelingum, P., Rogers, A., and Jennings,
N. (2011). Agent-based control for decentralised de-
mand side management in the smart grid. In The 10th
International Conference on Autonomous Agents and
Multiagent Systems-Volume 1, pages 5–12. Interna-
tional Foundation for Autonomous Agents and Mul-
tiagent Systems.
Ruiz, N., Cobelo, I., and Oyarzabal, J. (2009). A direct load
control model for virtual power plant management.
IEEE Transactions on Power Systems, 24(2):959–966.
Saad, W., Han, Z., Poor, H. V., and Basar, T. (2012). Game-
theoretic methods for the smart grid: An overview
of microgrid systems, demand-side management, and
smart grid communications. IEEE Signal Processing
Magazine, 29(5):86–105.
Sezgen, O., Goldman, C., and Krishnarao, P. (2007). Op-
tion value of electricity demand response. Energy,
32(2):108–119.
Sinitsyn, N. A., Kundu, S., and Backhaus, S. (2013).
Safe protocols for generating power pulses with het-
erogeneous populations of thermostatically controlled
loads. Energy Conversion and Management, 67:297–
308.
Stadler, M., Palensky, P., Lorenz, B., Weihs, M., and Roe-
sener, C. (2005). Integral resource optimization net-
works and their techno-economic constraints. na.
Strbac, G. (2008). Demand side management: Benefits and
challenges. Energy policy, 36(12):4419–4426.
Valero, S., Ortiz, M., Senabre, C., Alvarez, C., Franco, F.,
Gabald, A., et al. (2007). Methods for customer and
demand response policies selection in new electricity
markets. IET generation, transmission & distribution,
1(1):104–110.
SMARTGREENS 2017 - 6th International Conference on Smart Cities and Green ICT Systems
126
