
InLiDa: A 3D Lidar Dataset for People Detection and Tracking in Indoor
Environments
Cristina Romero-Gonz
´
alez,
´
Alvaro Villena, Daniel Gonz
´
alez-Medina, Jesus Mart
´
ınez-G
´
omez,
Luis Rodr
´
ıguez-Ruiz and Ismael Garc
´
ıa-Varea
Computer Systems Department, University of Castilla-La Mancha, Campus Universitario s/n, 02071, Albacete, Spain
{cristina.rgonzalez, alvaro.villena, daniel.gonzalez, jesus.martinez, luis.rruiz, ismael.garcia}@uclm.es
Keywords:
Indoor Lidar Dataset, People Detection, People Tracking, Benchmark.
Abstract:
The objective evaluation of people detectors and trackers is essential to develop high performance and general
purpose solutions to these problems. This evaluation can be easily done thanks to the use of annotated datasets,
but there are some combinations of sensors and scopes that have not been extensively explored. Namely, the
application of large range 3D sensors in indoor environments for people detection purposes has been sparsely
studied. To fill this gap, we propose InLiDa, a dataset that consists of six different sequences acquired in two
different large indoor environments. The dataset is released with a set of tools valid for its use as benchmark
for people detection and tracking proposals. Also baseline results obtained with state-of-the-art techniques for
people detection and tracking are presented.
1 INTRODUCTION
People detection and tracking are traditional problems
in the scope of both computer vision and robotics.
The position of the persons within any environment
is crucial to determine the proper robot actions in
human-robot interaction problems. Moreover, track-
ing such positions between consecutive frames may
be extremely useful to recognize human patterns, and
more especially with the emergence of data mining
applications.
Recently, people detection and tracking systems
have been increasingly used in a wide range of ap-
plications thanks to two main reasons. First, the de-
velopment of robust and efficient techniques that al-
low these systems to work in real-time, that is, to be
able to work with images with higher quality, and at a
higher frame rates. Second, the release of depth sen-
sors that has also improved the heterogeneity of peo-
ple detectors and trackers.
Depth sensors allow the development of people
detectors under extreme lighting conditions. How-
ever, there are some considerations to be taken into
account, based on the nature of the sensor itself. Gen-
erally speaking, we can identify two types of depth
sensor: short range sensors and large range sensors.
Most short range sensors are only capable of work-
ing at distances under 10 meters, but they usually in-
clude a visual camera, like the Microsoft Kinect or
the Asus Xtion devices. Consequently, these sensors
can properly combine visual and depth information
to perform people detection and tracking in a small
portion of the environment, due to their small field
of view. On the other hand, large range sensors cor-
respond to three-dimensional lidars. These sensors
can scan broad areas, and they are specially recom-
mended for outdoor environments or spacious indoor
buildings with large corridors and halls. However, the
performance of people detectors and trackers may be
degraded when working at larger distances, due pri-
marily to people being sparsely perceived (Navarro-
Serment et al., 2010).
Many efforts have been done in the generation of
datasets with data acquired from Kinect like sensors
in indoor environments, or lidar in outdoor environ-
ments. In contrast, we present InLiDa in this paper, an
Indoor Lidar Dataset for people detection and track-
ing integrating data captured with a Velodyne VLP-
16 Lidar in an indoor location. This dataset contains
several sequences of 3D point clouds annotated with
people location at point-level. Moreover, this dataset
is oriented to human-robot interaction, thus it includes
perceptions of a mobile robot, namely a PeopleBot,
whose location is also annotated in the dataset. The
presence of a moving agent with human-like charac-
teristics (shape and velocity) and behavior (human-
robot interaction oriented) notoriously increases the
challenge presented in this dataset.
484
Romero-Gonzà ˛alez C., Villena à ˛A., Gonzà ˛alez-Medina D., Martà nez-Gøsmez J., Rodrà guez-Ruiz L. and Garcà a-Varea I.
InLiDa: A 3D Lidar Dataset for People Detection and Tracking in Indoor Environments.
DOI: 10.5220/0006148704840491
In Proceedings of the 12th International Joint Conference on Computer Vision, Imaging and Computer Graphics Theory and Applications (VISIGRAPP 2017), pages 484-491
ISBN: 978-989-758-227-1
Copyright
c
2017 by SCITEPRESS – Science and Technology Publications, Lda. All rights reserved
In addition to the annotated sequences, the dataset
also includes a set of useful tools valid for computing
performance metrics over the decisions obtained with
any applied technique of people detection and track-
ing. The baseline results presented in the paper that
have been obtained using state-of-the-art solutions,
also help for a better understanding of the stages in-
volved in human detectors and trackers.
2 RELATED WORK
People detection is one of the main research topics in
computer vision and robotics. This problem is related
to scene segmentation and classification in indoor en-
vironments, and multiple proposals have been made
to solve it using RGB and/or depth images (Mu
˜
noz-
Salinas et al., 2007; Spinello and Arras, 2011). At the
same time, pedestrian detection, a specific applica-
tion of people detection, is crucial for outdoor mobile
robots, and it is usually approached using either RGB
cameras or lidar sensors (Benenson et al., 2015). The
interest in these tasks has resulted in several datasets
to assess the performance of different algorithms.
So far, people detection has proven to be a chal-
lenging problem due to several factors like occlu-
sion, pose or real-time detection (Nguyen et al.,
2016). General purpose detectors can be evaluated
using datasets like PASCAL VOC (Everingham et al.,
2010), RGB-D People (Spinello and Arras, 2011) or
MOT2015 (Leal-Taix
´
e et al., 2015). However, most
of these evaluation benchmarks only provide 2D im-
ages or dense point clouds captured with a short range
sensor.
In conjunction with people detection, datasets
may also be proposed for benchmarking tracking so-
lutions. While people detection and tracking are
highly correlated problems (Andriluka et al., 2008),
tracking incorporates its own singularities and chal-
lenges, like the development of multi-hypothesis
frameworks.
In outdoor environments, the problem of pedes-
trians detection is specially relevant nowadays to,
for instance, avoid accidents involving self-driving
cars (Geronimo et al., 2010). Consequently, there has
been extensive research in this field using both, vi-
sual cameras and 3D lidars. Probably the more repre-
sentative dataset in this case is KITTI (Geiger et al.,
2013), which was recorded driving around a middle-
size city. It contains grayscale and color stereo se-
quences, as well as 3D Velodyne point clouds, be-
sides camera calibration and localization information.
Similarly, there are many other datasets generated in
outdoor environments with a moving vehicle (Smith
et al., 2009; Blanco et al., 2014; Pandey et al., 2011).
The evolution of pedestrian detectors and their inter-
nal details can be understood by reading the review
presented in (Dollar et al., 2012).
Nevertheless, there are some applications that re-
quire the identification of people in wide indoor envi-
ronments. In this case, typical RGB-D sensors have a
small range of action to perceive all people, so the use
of large range 3D sensor must be encouraged. Our
dataset is oriented to these human-robot interaction
scenarios, where the robot is usually indoor placed,
and it needs to identify people to interact with in large
open spaces, where the range of view of dense depth
cameras is not enough. Additionally, the human-robot
interaction goal results in a robot with a height and
velocity similar to a person, which may increase the
challenging of the dataset due the singularities that are
introduced.
3 DATASET DESCRIPTION
The InLiDa dataset contains 3D lidar scans of in-
door environments for people detection and tracking
in human-robot interaction scenarios. We opt for a
point cloud encoding of the 3D images, that is, each
cloud has been stored using the Point Cloud Data for-
mat (PCD V7). This fact increases the usability of the
dataset, as PCD is the preferred format in some of the
most common and useful libraries for 3D processing,
the Point Cloud Library (Rusu and Cousins, 2011),
and it has been previously used for the generation of
different datasets (Mart
´
ınez-G
´
omez et al., 2015).
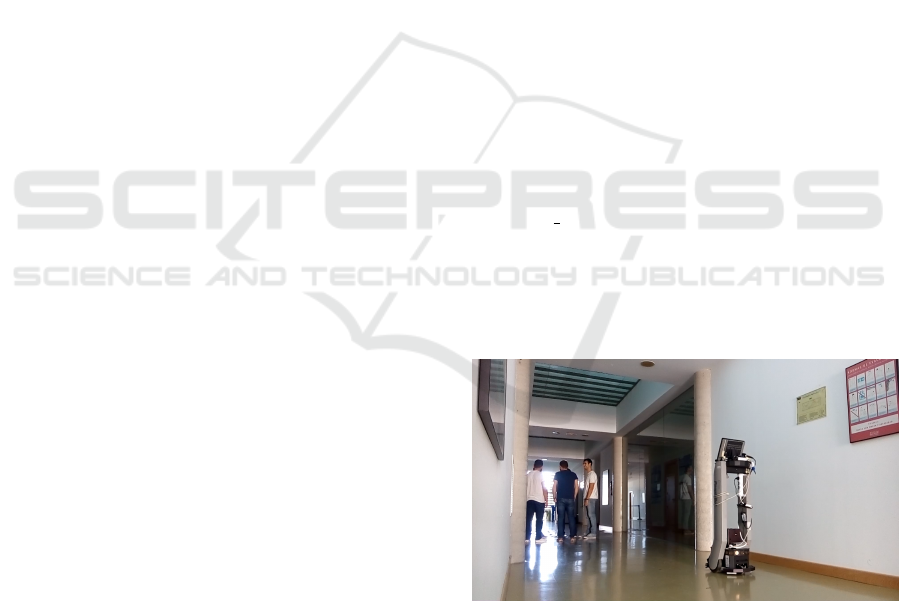
Figure 1: Capture process for sequence 4.
In order to provide researchers with a challeng-
ing benchmark, the dataset consists of six different
sequences acquired in the main corridor of an aca-
demic building, similar to most worldwide research
institutes (see Fig. 1), and in the hall of a Univer-
sity school building. During the acquisition process,
we placed a Velodyne VLP-16 Lidar in a static po-
sition in the environment and recorded people while
InLiDa: A 3D Lidar Dataset for People Detection and Tracking in Indoor Environments
485
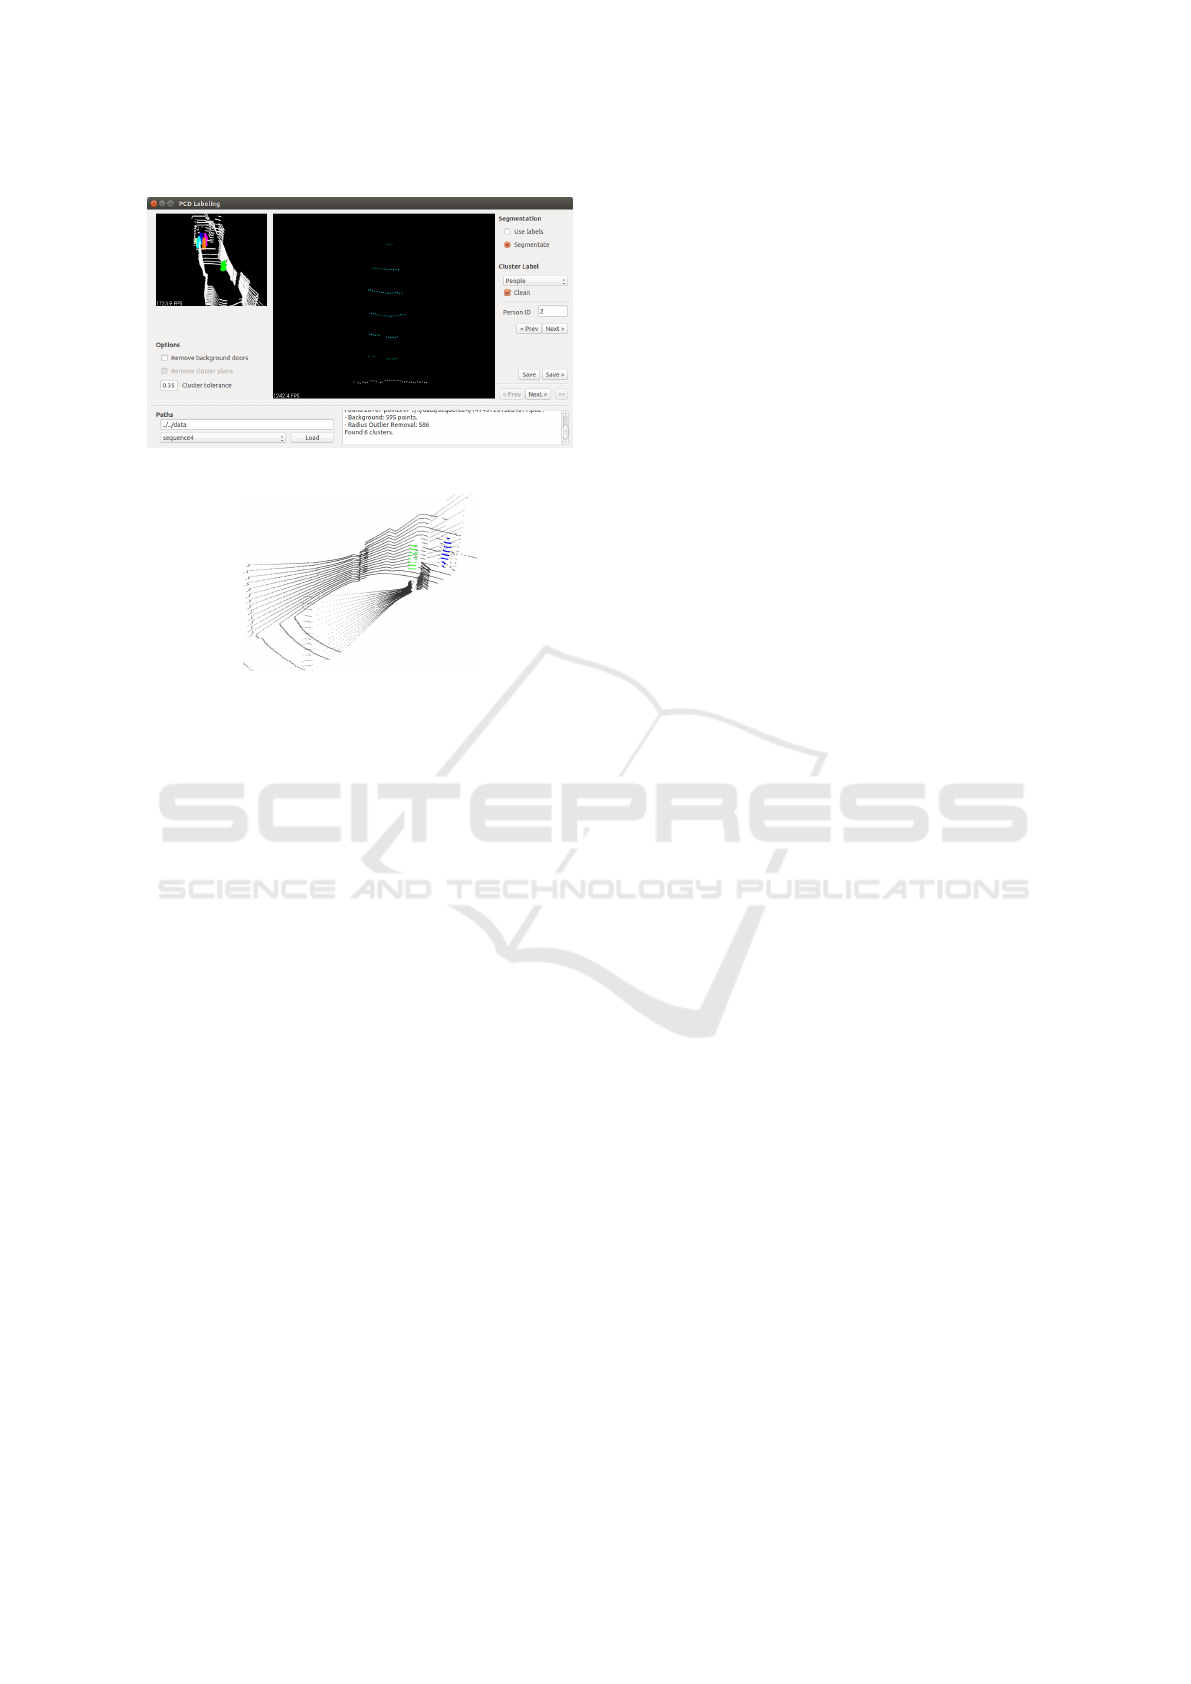
Figure 2: Annotation tool.
Figure 3: Exemplar point cloud with annotated information:
people (blue) and robot (green).
they moved along the corridor/hall, or they interacted
with a robot that was also located in the same environ-
ment. The presence of the robot generates an increas-
ing presence of occlusions, as it is a very common
issue in human-robot interaction processes. The six
sequences of the dataset were recorded in ascending
order of difficulty:
1. Corridor: People walking in simple paths.
2. Corridor: People walking in simple paths, with
the robot present.
3. Corridor: People walking in complex paths, with
the robot present.
4. Corridor: Groups of people walking at different
speeds, standing, and interacting with the robot.
5. Hall: People walking in simple paths, going up
and down stairs, and sitting.
6. Hall: Groups of people walking at different
speeds, standing, and interacting with the robot.
Every point cloud in the dataset is annotated with
the position of any agent (people or robot) perceived
with the 3D lidar. We developed a specific tool to
manually annotate the dataset at point level. In Fig. 2
a screenshot of this tool is presented, and Fig. 3 rep-
resents the ground truth annotations for an specific
frame of the dataset. Each visible person in the se-
quence is also labeled using a unique identifier, which
allows to track the same individual between different
frames. As there is only one robot in the environment,
we use a special identifier to denote the robot (the ID
0). The centroid and bounding cube for each set of
points belonging to a human or the robot are also pro-
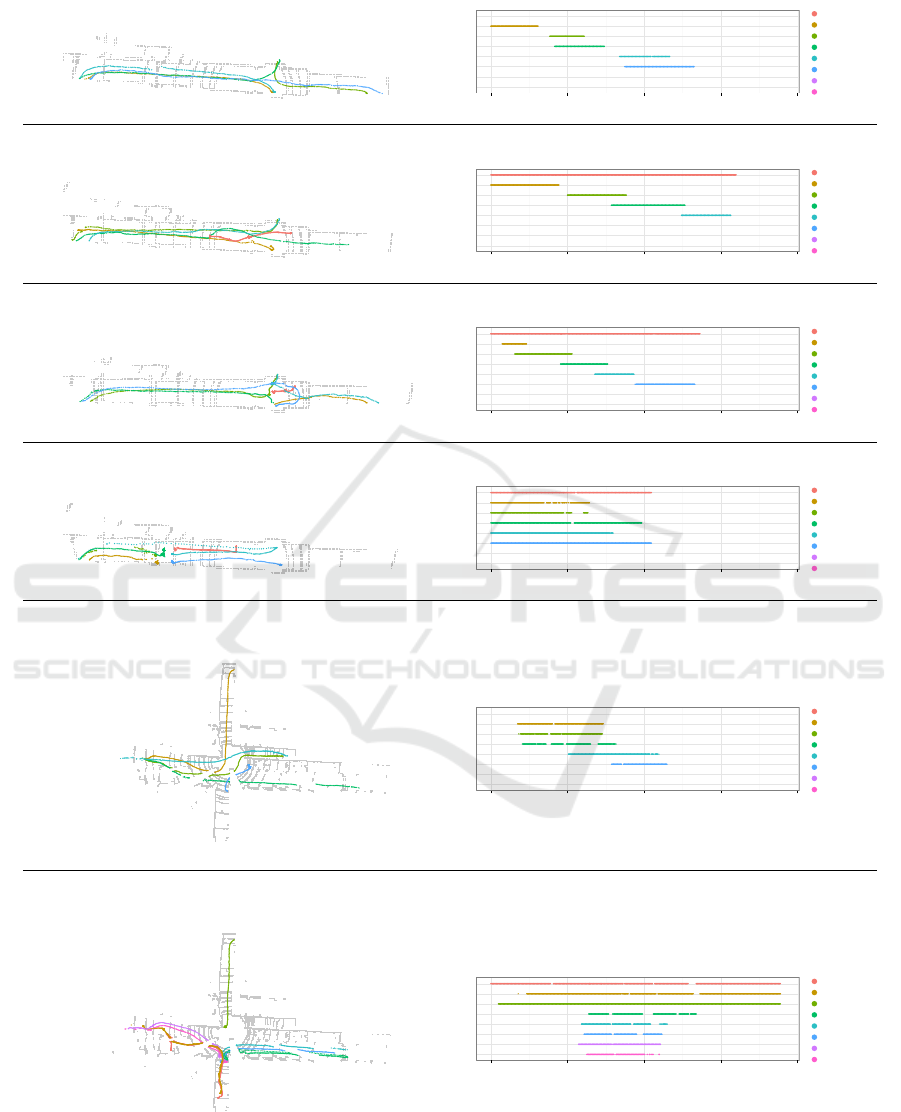
vided. The paths followed by the people and the robot
during the acquisition process are illustrated in Fig. 4.
In addition to the whole set of annotated clouds,
each sequence is also released with a 20 seconds
sub-sequence of clouds without the presence of any
moving agent, and therefore suitable to identify static
structural elements. Finally, the raw data of the se-
quences is also available in rosbag format.
The InLiDa dataset, along with several
tools for its use and the evaluation of dif-
ferent tracking algorithms, is available at
http://simdresearch.com/datasets/inlida.
3.1 Sequences Analysis
We show in Table 1 some basic statistics for the
dataset. We can observe that the fourth, fifth and
sixth sequences include an average number of peo-
ple per frame notoriously higher than for the rest of
sequences. This is due to the fact that groups of peo-
ple are presented in the environment most of the time,
which is also expected to increase the complexity of
these sequences.
In order to examine the internal details of the se-
quences, we graphically present in Fig. 4 the presence
(or lack) for each moving agent during the acquisition
of the sequence. In this figure, we can observe the
concurrence of people for each sequence.
In addition to the temporal evolution of the people
and robot presence, we also visualize the distribution
of frames according to the number of people anno-
tated in the ground truth in Fig. 5. We can observe
again in this figure the strong differences between se-
quences 4, 5 and 6, and 1, 2 and 3.
4 EXPECTED USAGE AND
RESULTS
The dataset contains the position for different moving
agents, which were visible during the acquisition pro-
cess, so it can be used to evaluate tasks of different
nature. Here, we present some results in the two main
applications of this type of datasets: people detection
and tracking.
4.1 People Detection
In general, the process of detecting people can be per-
formed similarly to object detection (Nguyen et al.,
2016):
VISAPP 2017 - International Conference on Computer Vision Theory and Applications
486
Sequence 1
0 30 60 90 120
Time (s)
Robot
Person 1
Person 2
Person 3
Person 4
Person 5
Person 6
Person 7
Sequence 2
0 30 60 90 120
Time (s)
Robot
Person 1
Person 2
Person 3
Person 4
Person 5
Person 6
Person 7
Sequence 3
0 30 60 90 120
Time (s)
Robot
Person 1
Person 2
Person 3
Person 4
Person 5
Person 6
Person 7
Sequence 4
0 30 60 90 120
Time (s)
Robot
Person 1
Person 2
Person 3
Person 4
Person 5
Person 6
Person 7
Sequence 5
0 30 60 90 120
Time (s)
Robot
Person 1
Person 2
Person 3
Person 4
Person 5
Person 6
Person 7
Sequence 6
0 30 60 90 120
Time (s)
Robot
Person 1
Person 2
Person 3
Person 4
Person 5
Person 6
Person 7
Figure 4: People and robot paths in the sequences (left). Temporal flow of people and robot (right).
InLiDa: A 3D Lidar Dataset for People Detection and Tracking in Indoor Environments
487
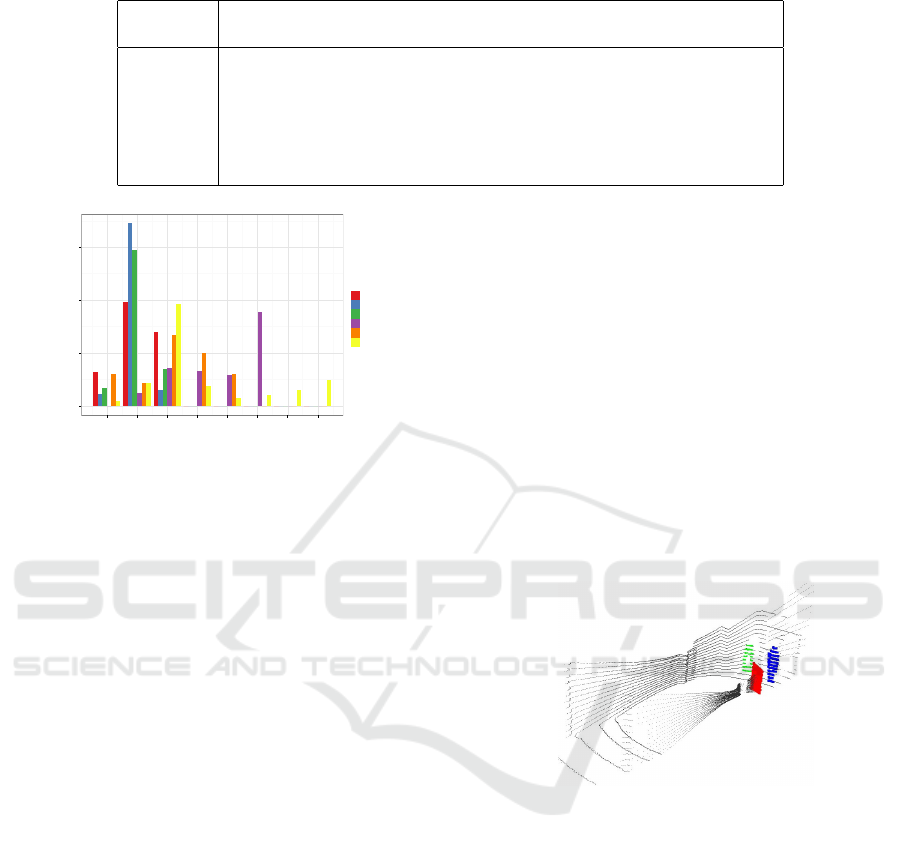
Table 1: Overall dataset statistics.
Sequence # Images # People Robot
Elapsed Avg. people
Location
time (s) per frame
1 787 5 No 82.41 1.19 Corridor
2 916 4 Yes 95.93 1.02 Corridor
3 781 5 Yes 85.97 1.09 Corridor
4 600 5 Yes 62.80 3.73 Corridor
5 658 5 No 68.88 2.15 Hall
6 1081 7 Yes 113.23 3.09 Hall
0.00
0.25
0.50
0.75
0 1 2 3 4 5 6 7
# Persons
Frequency
Seq.
1
2
3
4
5
6
Figure 5: Frames distribution based on the number of visi-
ble persons.
1. Segment the image to extract regions of interest.
2. Describe these regions using local or global de-
scriptors.
3. Classify them as person or non-person.
Finally, a post-processing step can be performed
to merge different regions or adjust the bounding box
size. Here, we propose a basic segmentation and clas-
sification process to assess the possible challenges
present in the proposed dataset.
4.1.1 Segmentation
The proposal for the segmentation process is based on
four fundamental steps. The four steps are applied to
every point cloud included in any sequence to extract
the regions of interest, and they are detailed in the
following:
1. Background extraction: we use a filtering process
to remove the background from the point cloud of
a single frame. After extracting the background,
the remaining points define the cloud from which
we will obtain the regions of interest.
2. Outlier removal: starting from the resulting cloud
in previous step, we detect outlier points that may
be errors or even noise of the scanning process.
These irregularities are removed in a cleaning pro-
cess to increase the performance of the next steps.
3. Ground projection: we project the cloud obtained
in the previous step on the ground. This process
helps separate the cloud in smaller parts, which
are the regions of interest used as input for the
next step.
4. Euclidean clustering: finally we apply a method
to segment the cloud into the regions we want to
detect. The method is based on a data clustering
approach (Rusu, 2009), which uses a predefined
euclidean distance to identify the points belonging
to each cluster.
The final result after performing all these steps is a
set of different clusters, which are used in further clas-
sification stages. In Fig. 6 we can observe the result of
applying the segmentation process over a frame from
the dataset. In this figure we can clearly distinguish
three different clusters (green, blue and red).
Figure 6: Three clusters result of the segmentation process:
people (blue), robot (green) and not people (red).
4.1.2 Classification
To perform the classification we take advantage of
the clusters obtained in the segmentation process (sec-
tion 4.1.1) and the ground truth annotations described
in section 3.
To train and test the classifiers we use two global
descriptors, namely ESF (Wohlkinger and Vincze,
2011) and VFH (Rusu et al., 2010), which have been
extracted from each cluster resulting of the segmen-
tation process. The training set is generated by as-
signing a category to each cluster and their associated
features. The category is binary and represents these
two values: ”Person” or ”Not person”.
The category value of each cluster is established
by computing the distance to every people annotated
VISAPP 2017 - International Conference on Computer Vision Theory and Applications
488

0.00
0.25
0.50
0.75
1.00
1 2 3 4 5 6
Sequence
Relative Frequency
Not person
Person
Figure 7: Category distribution by sequence in the dataset.
in the ground truth in that frame. This is done us-
ing the euclidean distance between centroids, and if
such distance is below a predefined maximum dis-
tance (0.5m), we annotate the cluster using the ”Per-
son” category. Otherwise, the category value of the
cluster is set as ”Not person”. The category distribu-
tion is shown in Fig. 7, where we can also identify the
strong difference between Sequence 4, and the rest
of sequences. This difference is related to the num-
ber of ”Not person” clusters, which have their origin
in noisy sensor reads, especially for wider spaces, or
the displacement of structural elements by human ac-
tions. The displacement of these elements, mainly
doors, make them being sensed in a set of locations,
which do not correspond to those identified during
the background generation. This fact avoids their re-
moval during the segmentation stage, and encourages
the generation of ”Not person” clusters. The low fre-
quency of ”Not person” clusters in Sequence 4 may
then be explained due to the small number of doors
openings, since all the people perceived during the
sequence was initially located in the main corridor
of the environment. For the classification process we
have used three widely used methods:
• Random Forest.
• Support Vector Machines (SVM), with linear and
exponential χ
2
kernel functions.
• k-Nearest Neighbors (with k = 7).
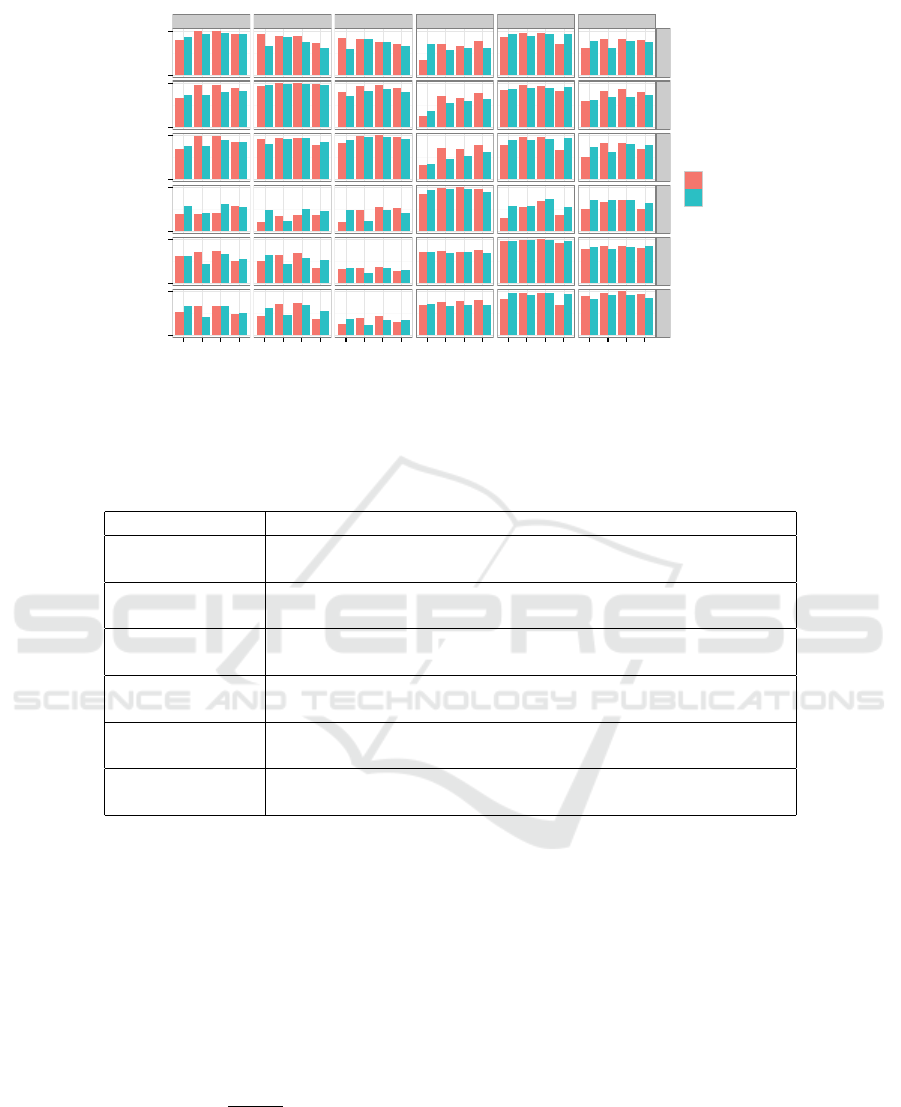
Fig. 8 shows the accuracy of the different classifi-
cation methods when combined with the two descrip-
tors (ESF and VFH). The results are presented for
every combination of sequences as training and test
sets. Based on these data, we point out the challeng-
ing of Sequence 4, as poor results were obtained when
trained with sequences from the same environment.
This may come from its different category distribu-
tion, as shown in Fig. 7. With respect to the remaining
sequences, 1-3 seem to perform similarly against each
other, and this behavior is paralleled with sequences
5-6. Additionally, it could be considered that train-
ing with simpler sequences (1-3) in smaller environ-
ments helps to generalize better when classifying the
more complex ones (5-6). Regarding the classifica-
tion models, Random Forest outperformed the rest of
alternatives. Moreover, the results obtained with ESF
were slightly better than those obtained with VFH.
4.2 Tracking
Tracking people consists in building a model of a per-
son’s movement with robustness to occlusions, and
changes in direction and/or velocity. Here, we evalu-
ate InLiDa considering a simple tracking algorithm
based on the velocity and trajectory of the person
in the previous frames. For each frame, the algo-
rithm matches every object classified as ”Person” to
the closest hypothesis in the set of tracked persons.
This match is then validated if the distance to the hy-
pothesis is below than a predefined threshold set to
0.5m. If this match is valid, the velocity buffer of the
tracked person is updated adding the displacement of
the person since the last frame, and removing the old-
est value if the buffer overflows its capacity (N
max
),
fixed to N
max
= 30 in our experiments. The velocity
(V ) is updated using the following equation:
V =
N
∑
i=1
v
i
· w
i
, w
i
=
i
N
∑
j=1
j
(1)
where N is the size of the buffer (with N ≤ N
max
), v
i
is the i-th value of the velocity buffer and w
i
is its
weight, which results in a weighted mean of the ve-
locity buffer. In our algorithm, v
1
is the oldest value
stored in the buffer, while v
N
is the most recent value,
then the more recent velocity, the higher associated
weight. The predicted position is calculated using the
previous position and the new predicted velocity.
If the match is not valid, a new hypothesis is ini-
tialized in the tracked object, with zero velocity and
the position of the detected person. Finally, the posi-
tion of every tracked person without a correspondence
in this frame is updated using the previous velocity.
We evaluated this tracking algorithm based on
MOTA and MOTP metrics (Bernardin and Stiefelha-
gen, 2008), used to measure and compare multiple ob-
ject tracking systems. These metrics are based on the
precision to estimate object locations and the accu-
racy to recognize objects. To obtain these metrics, we
store for each frame a set of tracking statistics to com-
pare ground truth and tracking output. The value for
the MOTA metric, which shows the accuracy of the
algorithm, is calculated using the following equation:
MOTA = 1 −
∑
t
(m
t
+ f p
t
+ mme
t
)
∑
t
g
t
(2)
InLiDa: A 3D Lidar Dataset for People Detection and Tracking in Indoor Environments
489
Test 1
Test 2
Test 3
Test 4
Test 5
Test 6
0
1
0
1
0
1
0
1
0
1
0
1
Train 1
Train 2
Train 3
Train 4
Train 5
Train 6
SVM (linear)
SVM (expchi2)
RF
kNN
SVM (linear)
SVM (expchi2)
RF
kNN
SVM (linear)
SVM (expchi2)
RF
kNN
SVM (linear)
SVM (expchi2)
RF
kNN
SVM (linear)
SVM (expchi2)
RF
kNN
SVM (linear)
SVM (expchi2)
RF
kNN
Classifier
Accuracy
Descriptor
ESF
VFH
Figure 8: Classification accuracy.
Table 2: Multiple object tracking results using Random Forest and ESF descriptors.
Test 1 Test 2 Test 3 Test 4 Test 5 Test 6
Train 1
MOTA 96.6% -65.1% -18.0% 48.9% 69.4% 47.8%
MOTP 162mm 137mm 158mm 111mm 158mm 109mm
Train 2
MOTA 87.3% 92.0% 76.1% 49.6% 52.7% 56.7%
MOTP 156mm 135mm 146mm 120mm 135mm 94mm
Train 3
MOTA 90.4% 17.0% 97.1% 52.1% 67.7% 44.8%
MOTP 154mm 142mm 179mm 111mm 158mm 111mm
Train 4
MOTA -79.9% -810.7% -117.5% 92.6% -112.9% 22.9%
MOTP 158mm 136mm 165mm 112mm 160mm 124mm
Train 5
MOTA 16.4% -349.9% -208.1% 55.7% 93.8% 56.8%
MOTP 157mm 127mm 154mm 109mm 171mm 117mm
Train 6
MOTA -3.3% -283.3% -172.3% 65.5% 74.0% 89.6%
MOTP 145mm 143mm 157mm 115mm 169mm 119mm
where m
t
is the number of not detected persons, f p
t
is
the number of elements we mistakenly detect as per-
son, mme
t
is the number of mismatches, and g
t
is the
number of objects present for frame t. This metric is
closer to 1 if the rate of misses, false positives and
mismatches of the tracking algorithm is small, tend-
ing to negative values when the tracking is inaccurate.
The MOTP metric is used to calculate the preci-
sion of the tracker to estimate the position of the per-
sons in the environment, using the following equa-
tion:
MOT P =
∑
i,t
d
i,t
∑
t
c
t
(3)
where d
i,t
is the distance between the person i and its
corresponding hypothesis at time t, and c
t
is the total
number of matches at time t.
Table 2 shows the results for multiple object track-
ing metrics using our segmentation and tracking al-
gorithms. The tracking algorithm relies on the output
of a people detector that uses a combination of Ran-
dom Forest and ESF descriptors, which was exposed
as the most promising combination in previous exper-
iments. We can observe the correlation between the
MOTA results and those shown in Fig. 8, obtaining
worse values when the model is trained with com-
plex sequences and tested with simple ones. The best
results are obtained using simple sequences with the
robot present in the scene to train our model. The
MOTP metric oscillates between 94mm and 179mm,
which may be assumed as quite precise level as the
people position is estimated in a large scene with an
error lower than 0.2m.
VISAPP 2017 - International Conference on Computer Vision Theory and Applications
490

CONCLUSIONS
In this paper we have presented a new 3D lidar dataset
oriented to people detection in indoor environments.
We consider that the differences between scenes cover
a wide range of situations and problems that can oc-
cur in this kind of locations. In addition, we have
tested simple algorithms to demonstrate that these dif-
ferences are reflected in the classification and tracking
accuracy of each sequence.
The current dataset is complex and challenging
enough to test different people detection and tracking
algorithms. However, we plan to extend it in the near
future with new sequences in different large indoor
places (hallways and halls in different buildings).
ACKNOWLEDGEMENTS
This work has been partially funded by FEDER funds
and the Spanish Government (MICINN) through
projects TIN2013-46638-C3-3-P, TIN2015-65686-
C5-3-R, and DPI2013-40534-R and by Consejer
´
ıa
de Educaci
´
on, Cultura y Deportes of the JCCM re-
gional government through project PPII-2014-015-P.
Cristina Romero-Gonz
´
alez is funded by the MECD
grant FPU12/04387.
REFERENCES
Andriluka, M., Roth, S., and Schiele, B. (2008).
People-tracking-by-detection and people-detection-
by-tracking. In Computer Vision and Pattern Recog-
nition, 2008. CVPR 2008. IEEE Conference on, pages
1–8. IEEE.
Benenson, R., Omran, M., Hosang, J., and Schiele, B.
(2015). Ten Years of Pedestrian Detection, What Have
We Learned?, pages 613–627. Springer International
Publishing, Cham.
Bernardin, K. and Stiefelhagen, R. (2008). Evaluating mul-
tiple object tracking performance: The clear mot met-
rics. EURASIP Journal on Image and Video Process-
ing, 2008(1):1–10.
Blanco, J.-L., Moreno, F.-A., and Gonz
´
alez-Jim
´
enez, J.
(2014). The m
´
alaga urban dataset: High-rate stereo
and lidars in a realistic urban scenario. International
Journal of Robotics Research, 33(2):207–214.
Dollar, P., Wojek, C., Schiele, B., and Perona, P. (2012).
Pedestrian detection: An evaluation of the state of the
art. IEEE transactions on pattern analysis and ma-
chine intelligence, 34(4):743–761.
Everingham, M., Van Gool, L., Williams, C. K. I., Winn,
J., and Zisserman, A. (2010). The pascal visual ob-
ject classes (voc) challenge. International Journal of
Computer Vision, 88(2):303–338.
Geiger, A., Lenz, P., Stiller, C., and Urtasun, R. (2013).
Vision meets robotics: The kitti dataset. International
Journal of Robotics Research (IJRR).
Geronimo, D., Lopez, A. M., Sappa, A. D., and Graf, T.
(2010). Survey of pedestrian detection for advanced
driver assistance systems. IEEE Transactions on Pat-
tern Analysis and Machine Intelligence, 32(7):1239–
1258.
Leal-Taix
´
e, L., Milan, A., Reid, I., Roth, S., and Schindler,
K. (2015). MOTChallenge 2015: Towards a bench-
mark for multi-target tracking. arXiv:1504.01942
[cs]. arXiv: 1504.01942.
Mart
´
ınez-G
´
omez, J., Garc
´
ıa-Varea, I., Cazorla, M., and
Morell, V. (2015). Vidrilo: The visual and depth
robot indoor localization with objects information
dataset. The International Journal of Robotics Re-
search, 34(14):1681–1687.
Mu
˜
noz-Salinas, R., Aguirre, E., and Garc
´
ıa-Silvente, M.
(2007). People detection and tracking using stereo
vision and color. Image and Vision Computing,
25(6):995–1007.
Navarro-Serment, L. E., Mertz, C., and Hebert, M.
(2010). Pedestrian detection and tracking using three-
dimensional ladar data. The International Journal of
Robotics Research, 29(12):1516–1528.
Nguyen, D. T., Li, W., and Ogunbona, P. O. (2016). Human
detection from images and videos: A survey. Pattern
Recognition, 51:148–175.
Pandey, G., McBride, J. R., and Eustice, R. M. (2011). Ford
campus vision and lidar data set. The International
Journal of Robotics Research, 30(13):1543–1552.
Rusu, R. B. (2009). Semantic 3D Object Maps for Ev-
eryday Manipulation in Human Living Environments.
PhD thesis, Computer Science department, Technis-
che Universitaet Muenchen, Germany.
Rusu, R. B., Bradski, G., Thibaux, R., and Hsu, J. (2010).
Fast 3D recognition and pose using the viewpoint fea-
ture histogram. In Intelligent Robots and Systems
(IROS), 2010 IEEE/RSJ International Conference on,
pages 2155–2162. IEEE.
Rusu, R. B. and Cousins, S. (2011). 3D is here: Point Cloud
Library (PCL). In Robotics and Automation (ICRA),
2011 IEEE International Conference on, pages 1–4.
Smith, M., Baldwin, I., Churchill, W., Paul, R., and New-
man, P. (2009). The new college vision and laser data
set. The International Journal of Robotics Research,
28(5):595–599.
Spinello, L. and Arras, K. O. (2011). People detection in
rgb-d data. In 2011 IEEE/RSJ International Confer-
ence on Intelligent Robots and Systems, pages 3838–
3843. IEEE.
Wohlkinger, W. and Vincze, M. (2011). Ensemble of shape
functions for 3d object classification. In Robotics and
Biomimetics (ROBIO), 2011 IEEE International Con-
ference on, pages 2987–2992. IEEE.
InLiDa: A 3D Lidar Dataset for People Detection and Tracking in Indoor Environments
491
