
Analysis on Dynamic Relationship between Equity Financing and
Agricultural Integration
Based on VAR Model and Impulse Response
Kun Song, Xiaoqian Liu
School of Economics, Sichuan Agricultural University, Chengdu 611130, China
Keywords: Agricultural Integration; Equity Financing; Vector Auto-Regression Model; Impulse Response.
Abstract: Equity financing of agricultural firm is one of financing methods encouraged by the government. Research
on the relationships is the key problem of how equity financing supports agricultural integration. Based on
VAR model, cointegration analysis and Granger causality test is done to study the equilibrium relationship
and the dynamic impact is analyzed by using impulse response. Results show that size and efficiency of
equity financing have a positive relationship with agricultural integration. But size is more useful than
efficiency, and structure of equity financing and agricultural integration move in the opposite direction.
Thus, only equity financing with large size, efficiency, reasonable structure and right investment will
actually have an active impact on agricultural integration. Meanwhile, the development of agricultural
integration has not played a leading role on equity financing, and they have been in a low collaborative
degree.
1 INTRODUCTION
As agricultural integration is the "short slab" of
China's socialist modernization,Chinese government
attaches great importance to the structural
contradiction. From 2014 to 2016, "agricultural
modernization" has been written in the title of No.1
Central Document for consecutive three years.
Reform and Innovation are required by accelerating
the agricultural modernization, one of the key is to
develop the agricultural integration, which is the
developing direction of modern agriculture. But
reform needs capital support greatly. At present, the
fund investment of agriculture integration in China
can
’
t meet the demand of the development of the
agricultural integration: (Cuifang Wu, 2009) roughly
estimates that rural capital supply and demand gap
in 2012 is 18.8489 trillion Yuan, not to mention the
lack and serious insufficient of services in securities,
insurance and trust organizations; (Peng Jia, etc,
2011) etc find even areas where the development of
agricultural integration are better, financing
difficulty is still prominent; (Cheng Zhao and
Zhihong Huang, 2011) point out that the financial
repression exists in the process of agricultural
integration in our country, so (Zheng Hong, 2011)
puts forward obtaining financial support by the rural
financial innovation, has become an important
support for the development of agricultural
integration.
Thus, research on the correlation is the key
problem of how equity financing supports
agricultural integration. The following three
problems must be answered: Firstly, what is the
actual impact about the expanse of the absolute scale
of equity financing to the promotion of agricultural
integration? Secondly, the absolute scale of
agricultural integration or efficiency, which is more
important? Thirdly, the increase of the proportion of
equity financing to bank credit whether can play a
positive role in promoting the agriculture integration?
Currently no scholars study the above problems.
2 VARIBLE AND DATA SOURCES
2.1 The development of agricultural
integration
Use AL to indicate agricultural integration. To
quantitatively depict the development of agricultural
integration per year in our country, using Weng
Yao
’
s discriminant analysis method as reference,
construct discriminant index system: per capita GDP
277
Liu X. and Song K.
Analysis on Dynamic Relationship between Equity Financing and Agricultural Integration - Based on VAR Model and Impulse Response.
DOI: 10.5220/0006449002770282
In ISME 2016 - Information Science and Management Engineering IV (ISME 2016), pages 277-282
ISBN: 978-989-758-208-0
Copyright
c
2016 by SCITEPRESS – Science and Technology Publications, Lda. All rights reserved
277

(X
1
), GDP proportion in the first industry (X
2
), the
second industry labor proportion (X
3
), per capita
grain output (X
4
) and the Engel’s coefficient (X
5
),
and get the started stage of agricultural integration
(F
1
), growth stage(F
2
) and mature stage’s (F
3
)
discriminant value. These data are from "China
Agricultural Yearbook", "China Rural Statistical
Yearbook", "China Statistical Yearbook" and
"China
’
s State Administration of Foreign Exchange".
2.2 Setting the equity financing
variables
To reveal the relationship between the equity
financing development and agricultural integration,
this paper builds three sets of indicators to
comprehensively measure the development of equity
financing: equity financing scale index (SIZE=raised
total funds by agricultural firm through issuing
stocks within the territory/nominal agricultural
GDP), equity financing efficiency index
(EFF=raised total funds by agricultural firm through
issuing stocks within the territory /rural fixed asset
investment) , equity structure index (STR= raised
total funds by agricultural firm through issuing
stocks within the territory /agricultural loans).
2.3 The data source
(1) Agriculture GDP. Select the first industry as
nominal agriculture GDP, data from "China
Statistical Yearbook". (2) Agricultural loans. Data is
from "Almanac of China's Finance and Banking",
"China Compendium of Statistics" and "China's
Rural Financial Report". (3) Rural fixed asset
investment. The data is from "Rural China
Statistical Yearbook". (4) This paper chooses the
ecological-economic enterprises and agricultural
product processing industry. Raising funds by
issuing stocks in the main board, the small and
medium-sized board, the "New Three Board", as
well as in the national regional equity trading center
is equal to that by agricultural firm. In 1992, the
earliest agricultural firm went public in Shanghai
and Shenzhen stock exchange, so this paper sample
time spans from 1992 to 2015, 24 years in total. This
part of the data is from Wind information.
3 EMPIRICAL ANALYSES
3.1 Measurement of agricultural
integration level
According to the set variables and collected data,
from 1992 to 2015, the paper calculates the
discriminant value of agricultural integration in the
start, grow and mature stage and the level of
agricultural integration (as shown in table 1).
Table 1:1992-2015 year value of Agricultural integration.
year AL year AL
1992 0.9803 2004 0.9207
1993 0.9840 2005 0.9173
1994 0.9810 2006 0.9162
1995 0.9800 2007 0.9252
1996 0.9840 2008 0.9372
1997 0.9914 2009 0.9423
1998 0.9988 2010 0.9510
1999 0.9216 2011 0.9638
2000 0.9197 2012 0.9703
2001 0.9191 2013 0.9799
2002 0.9187 2014 0.9879
2003 0.9164 2015 0.9927
3.2 Equilibrium relationship of Equity
financing and agricultural
integration
3.2.1 The stationary test of variables
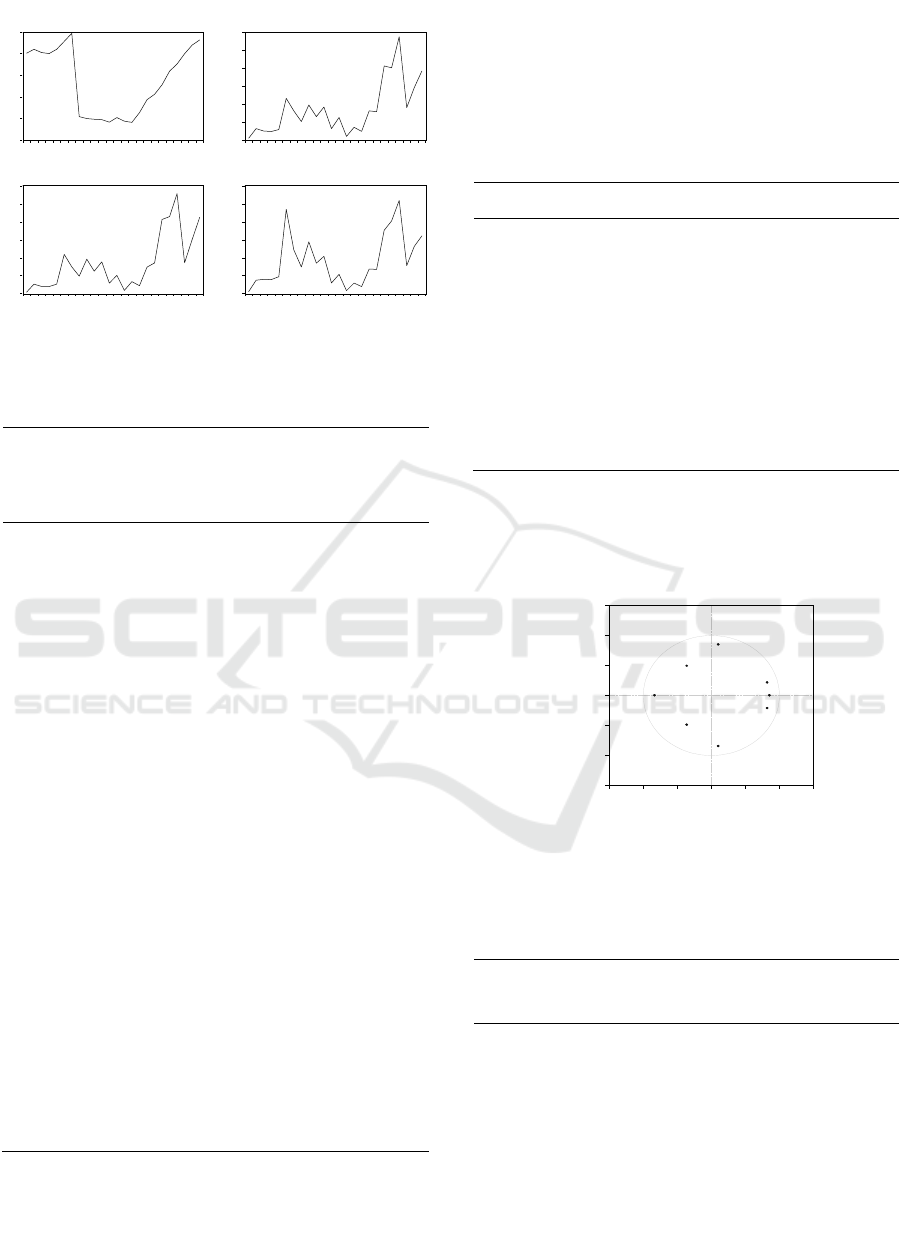
Figure 1 shows that ADF unit root test should
contain intercept and trend items. Table 2 shows the
original sequences of the variables are unstable; the
first order difference sequences are stable under 1%
significance level.
ISME 2016 - Information Science and Management Engineering IV
278
ISME 2016 - International Conference on Information System and Management Engineering
278
0.90
0.92
0.94
0.96
0.98
1.00
92 94 96 98 00 02 04 06 08 10 12 14
A
L
.000
.005
.010
.015
.020
.025
.030
92 94 96 98 00 02 04 06 08 10 12 14
EFF
.000
.001
.002
.003
.004
.005
.006
92 94 96 98 00 02 04 06 08 10 12 14
SIZE
.000
.002
.004
.006
.008
.010
.012
92 94 96 98 00 02 04 06 08 10 12 14
STR
Fig1: The tendency of the variables.
Table 2: ADF results of Variable.
variab
le
Inspecti
on type
(c t p)
AD
F
1%
critical
value
5%
critical
value
10%
critical
value
result
AL
(c t 0)
-0.9
1
-4.41 -3.62 -3.24
nonstat
ionary
*
SIZE
(c t 0)
-2.8
5
-4.41 -3.62 -3.24
nonstat
ionary
*
EFF
(c t 0)
-3.1
3
-4.41 -3.62 -3.24
nonstat
ionary
*
STR
(c t 0)
-3.0
4
-4.41 -3.62 -3.24
nonstat
ionary
*
D(AL)
(c t 5)
-6.8
5
-4.61 -3.71 -3.29
station
ary***
D(SIZ
E)
(c t 0)
-6.2
4
-4.44 -3.63 -3.25
station
ary***
D(EF
F)
(c t 0)
-7.0
4
-4.44 -3.63 -3.25
station
ary***
D(ST
R)
(c t 0)
-6.3
4
-4.44 -3.63 -3.25
station
ary***
3.2.2 The optimum lag of VAR model
Table 3 shows that except the Log L, the rest clearly
show that the optimum lag is 2 period, so VAR(2)
model is established in this paper.
Table 3: Judgment of VAR lag phase.
Log L LR FPE AIC SC HQ
0
388.84
26
NA 1.42e-21 -36.65 -36.45 -36.60
1
424.49
57
54.32 2.27e-22 -38.52 -37.52 -38.30
2
464.24
26
45.425
*
2.89e-23
*
-40.78* -38.99*
-40.39
*
3
478.70
61
11.019 6.08e-23 -40.63 -38.05 -40.07
3.2.3 The stationary test of VAR model
Figure 2 indicates that the VAR model satisfy the
stability condition.
-1.5
-1.0
-0.5
0.0
0.5
1.0
1.5
-1.5 -1.0 -0.5 0.0 0.5 1.0 1.5
In
v
e
r
se Roots of AR Cha
r
acte
r
istic Pol
y
nomial
Fig 2: Test figure of AR root of VAR (2).
3.2.4 The Cointegration Test
Table 4: Johansen’s co-integration test of VAR(2).
hypothetical
data
characteristi
cs value
Trac
e test
5%critical
value
probability
(**)
none 0.72 57.71 47.85 0.00
at most one 0.56 30.83 29.79 0.03
at most two 0.45 13.36 15.49 0.10
at most three 0.02 0.561 3.841 0.45
Analysis on Dynamic Relationship between Equity Financing and Agricultural Integration - Based on VAR Model and
Impulse Response
279
Analysis on Dynamic Relationship between Equity Financing and Agricultural Integration - Based on VAR Model and Impulse Response
279

Statistics in table 4 illustrates there is long-term
equilibrium relationships between the EFF, STR,
SIZE and AL.
)67.11()93.70()62.342(
52.013.33133.1616
μ
+
−−= STREFFSIZE
A
L
(1)
The analysis of formula (1) is as follows: (1)
Equity financing scale (SIZE) expending has played
a positive role in promoting agricultural integration.
(2)Improvement of the equity financing efficiency
(EFF) also has played a positive role in promoting
the development of agriculture integration. But
coefficient shows that the positive promoting effect
of the efficiency is weaker than the scale, which is
due to relatively limited attractive of the agricultural
investment environment, At present, agricultural
firm is in small scale(Cuifang Wu, 2009), and the
endogenous financing is extremely limited(
Peng Jia,
etc, 2011
), which lead to general low efficiency of
equity financing. (3) The structure of equity
financing and agricultural integration moves in the
opposite direction, indicating that the more
proportion in credit funds equity financing takes, the
worse the ascension of agriculture integration is.
3.2.5 Causality test
Table 5 shows that the probability values of statistics
AL to SIZE, EFF and STR are 0.0435, 0.0536,
0.0000, illustrating SIZE, EFF and STR variable are
the causes of Granger of AL, three variables need to
be included in the corresponding equation of AL
endogenous variable. From joint survey analysis of
AL to SIZE, EFF and STR, probability value of
statistics are 0.0000, showing that lags of SIZE, EFF
and STR to AL are significant. In addition, SIZE,
EFF and STR to AL individual factors are not
significant, namely, SIZE, EFF and STR to AL are
not significant: that is to say, the Granger cause of
SIZE, EFF, and STR is not AL, and state that the
development of agriculture integration does no good
to equity financing.
Table 5:Grangertest of VAR(2).
explained variable: AL
explanatory
variable
Chi-sq df P value
SIZE 6.2694 2 0.0435
EFF 5.7437 2 0.0536
STR 65.7177 2 0.0000
total 81.4202 6 0.0000
explained variable: SIZE
explanatory
variable
Chi-sq df P value
AL 1.4185 2 0.4920
EFF 26.528 2 0.0000
STR 1.5211 2 0.4674
total 33.329 6 0.0000
explained variable: EFF
explanatory
variable
Chi-sq df P value
AL 1.3162 2 0.5178
SIZE 30.710 2 0.0000
STR 0.7756 2 0.6785
total 38.064 6 0.0000
explained variable: STR
explanatory
variable
Chi-sq df P value
AL 3.0809 2 0.2143
SIZE 11.948 2 0.0025
EFF 11.804 2 0.0027
total 17.225 6 0.0085
3.3 Dynamic effect analysis based
impulse response function
3.3.1 Response of multi-factor to the
development of agricultural
integration
Figure 3(1) shows the following three aspects: (1)
Disturbed by SIZE standard deviation, the initial
response of AL is zero, in the second period, there is
a slightly negative response, and then quickly into
third period, reach a maximum 0.009. Namely, the
equity financing scale changes in the third period
has the strongest impaction on the agriculture
integration. Although over time the impact gradually
weakened, but the trend reached the maximum value
0.009, which illustrates that the increasing scale of
equity financing can bring a positive influence to the
agriculture integration. (2)Response of AL to one
S.D. EFF innovation presents zero in the first period,
in the second period,it begins to decline to a
negative response, until the third period. Then it
reaches the minimum negative response value. Soon,
ISME 2016 - Information Science and Management Engineering IV
280
ISME 2016 - International Conference on Information System and Management Engineering
280
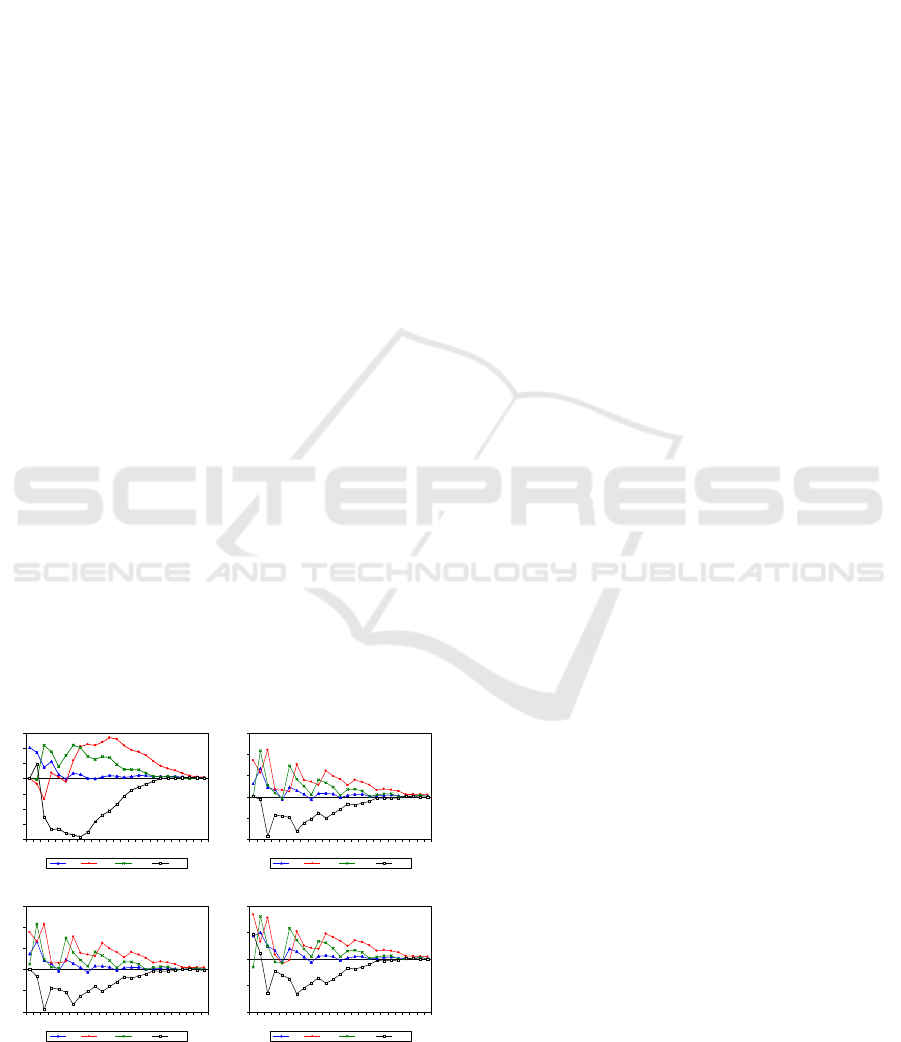
in the seventh period it begins to appear positive
response and fiercely rise, until 12th period. This
suggests that the promotion of the efficiency of
equity financing brings negative impact on
agriculture integration, but it is relatively short, in
the long run. Probably it takes times to translate
equity financing funds into agricultural fixed assets
(eg, agricultural infrastructure construction). After
the completion of the investment, it will continue to
accelerate the process of agriculture integration
naturally. (3)Response of AL to STR in the initial
period is still zero, in the second period turns to a
positive response, then in the third period rapidly
dropped to zero, and kept negative response all the
time. This shows that equity financing structure
changes can bring positive influence to the
agriculture integration in the short time, but be
negative in the long run. This negative impact is
undoubtedly caused by changing investment of
agricultural funds.
3.3.2 Response of development of
agricultural integration to the
multi-factor
Figure 3(2), (3) and (4) show that response of SIZE,
EFF and STR to S.D.AL innovation are very similar.
At first, there is biggest positive response. Then the
response continues to decline, and be positive or
negative continuously. But the trend is positive, and
tends to zero at the 21st period. The above reality
illustrates that agriculture integration may produce
positive influence on rural equity financing scale,
efficiency and structure, but the effect is weak and it
is difficult to distinguish, which is caused by small
shares of agricultural firms in the capital market.
-.016
-.012
-.008
-.004
.000
.004
.008
.012
2 4 6 8 10 12 14 16 18 20 22 24
AL EFF SIZE STR
Response of AL to Cholesky
One S.D. Innovations
-.004
-.002
.000
.002
.004
.006
2 4 6 8 10 12 14 16 18 20 22 24
AL EFF SIZE STR
Respons e of EFF to Cholesky
One S.D. Innovations
-
.0008
-
.0004
.0000
.0004
.0008
.0012
2 4 6 8 10 12 14 16 18 20 22 24
AL EFF SIZE STR
Response of SIZE to Cholesky
One S.D. Innovations
-.002
-.001
.000
.001
.002
2 4 6 8 10 12 14 16 18 20 22 24
AL EFF SIZE STR
Response of STR to Cholesky
One S.D. Innovations
(1)
Fig3: Response to Generalized One S.D.
Innovations
±
2 S.E.
4 CONCLUSIONS AND
RECOMMENDATION
4.1 Main conclusions
4.1.1 Long-term equilibrium relationship
Equity financing in China and agriculture integration
have a long-term equilibrium relationship, scale and
efficiency of equity financing have a positive impact
on agriculture integration. But expanding the scale
of equity financing should be a dominant factor, and
the efficiency has a limited role in promoting the
agriculture integration. So vigorously developing
equity financing can contribute to the promotion of
agriculture integration, which is based on two
conditions: firstly, increase the financing scale of
agricultural firms; secondly, restrict agricultural
firms changing direction of investment. Otherwise,
the equity financing will not conducive to the
development of agriculture integration.
4.1.2 Short term equilibrium relationship
Only equity financing with large size, efficiency,
reasonable structure and right investment will
actually have an active impact on agricultural
integration. However, Agriculture integration is not
the Granger reason of all variables, which is related
to that equity financing takes too small shares in
overall financing in our country, so they have been
in a low collaborative degree.
4.1.3 Dynamic Relationship
Equity financing efficiency will begin to have a
negative impact on agriculture integration, but it
begins and always keeps a positive response in the
seventh period, and this is related to the cycle of
fixed assets projects of agriculture integration,
presenting positive for a long time. As long term
equity financing structure impacted, it restrains the
development of the agriculture integration, still
related to the listed firms changing funds investing
direction. Only equity financing with large size,
efficiency, reasonable structure and right investment
will actually have an active impact on agricultural
integration, but these influences show certain
hysteresis. After agriculture integration hit, the
impact on other variables is not sure. The reason is
that shares of agricultural firms in the capital market
are too small.
Analysis on Dynamic Relationship between Equity Financing and Agricultural Integration - Based on VAR Model and
Impulse Response
281
Analysis on Dynamic Relationship between Equity Financing and Agricultural Integration - Based on VAR Model and Impulse Response
281

4.2 Policy recommendations
4.2.1 About enlarging the scale of equity
Speed up the listing process is a necessary method.
The recognized standard of the government to
leading enterprises of national agriculture integration
is very strict, and it needs to reach both standard of
business scale and indicators so that the company
can have the qualification. For this kind of
enterprises, as long as the relevant indicators meet
the requirements of the listed company, regulators
should ease stock reform time.
4.2.2 About changes investment of raised
funds
Apart from strengthening the regulation of securities
regulators, the government should play the
government's coordination services, and give
industry guidance to the listed agricultural firms on
how to raise and use funds. In addition, government
should optimize rural agricultural
industry
environment and soft financing environment, such as
invest to rural public infrastructure, and innovate the
operation mechanism of government, in order to
attract more capital investment.
REFERENCES:
Cuifang Wu., 2009. Study on the Outflow of Rural Capital
in China, China Social Sciences Publishing House.
Beijing, 1
st
edition.
Cheng Zhao, Zhihong Huang., 2014. Study of Financial
Repression and Counter Measures of Development of
Agricultural Industrialization Based on the Analysis of
Operating Risk of Corporation Perspective. HUNAN
SOCIAL SCIENCES.
Chibo Chen, Peng Jia, Panfeng Zhang., 2011. Research on
the Relationship between Agricultural
Industrialization and Financial Supply in Rural
Areas
:
Taking Henan Province as Example.
JOURNAL OF NORTHEAST NORMAL
UNIVERSITY(Philosophy and Social Sciences) .
Zheng Hong., 2011. Is the Reform of New Rural Financial
Institutions Feasible? Analysis from the Perspective of
Monitoring Efficiency. ECONOMIC RESEARCH
JOURNAL.
ISME 2016 - Information Science and Management Engineering IV
282
ISME 2016 - International Conference on Information System and Management Engineering
282
