
Visualization of Changes in ArchiMate
Within the Application and Technology Layers
Robert Bakelaar
1
and Ella Roubtsova
2
1
Royal Vopak, Global IT, Westerlaan 10, 3016CK, Rotterdam, The Netherlands
2
Open Universiteit of The Netherlands, Valkenburgerweg 177, 6419 AT Heerlen, The Netherlands
robert.bakelaar@vopak.com, ella.roubtsova@ieee.org
Keywords:
Changes of Enterprise Architecture, ArchiMate, Visualisation of Changes, Best of Breed.
Abstract:
Enterprise architecture is periodically changed. The visualization of changes is demanded for communica-
tion of the teams implementing changes. In this paper, we use the modern cases of transformation of ERP
(Enterprise Resource Planning) systems to the Best of Breed solutions and the popular modeling language
ArchiMate with its extensions to propose a method for visualization of changes. The method covers changes
within the application and technology layers and their link to the business layer. It includes artifacts, principles
and means for visualization. The method is tested with real cases of changes of ERP using the Best of Breed
strategy.
1 INTRODUCTION
Visualization of changes in enterprise architecture
languages is not a simple task as such languages re-
flect the static structure of an enterprise. However, en-
terprise architecture is periodically changed. Changes
are usually implemented by several teams. For com-
munication of teams, the changes need to be visu-
alised.
In this paper, we use the modern cases of changes
of ERP (Enterprise Resource Planning) systems us-
ing the Best of Breed strategy and the popular mod-
eling language ArchiMate (The Open Group, 2013)
to show the needs for change visualization and to ex-
plore the difficulties during the visualization process
and abstractions needed for it. As a result of our ex-
ploration, we propose a visualization method and vi-
sualization means.
We have chosen the cases of changes from ERP to
Best of Breed because these cases are representative
enough to cover different modifications within the ap-
plication and technology layers.
Our choice of the ArchiMate modeling language
is explained by several reasons.
• Firstly, ArchiMate is related to the TOGAF (the
abbreviation of “The Open Group Architecture
Framework”). It is a standard for enterprise ar-
chitecture (The Open Group, 2016).
• Secondly, ArchiMate is based on a metamodel
that contains a layered structure in which the busi-
ness, application and technology architectures are
covered and the modeling of relations between
the different layers is supported. Having means
to model different domains of the same business,
ArchiMate fills the gap between the different do-
main architectures and the missing relationships
between these architectures, as they are most of
the time created by separate architects in different
modeling languages (Lankhorst et al., 2009).
• Thirdly, the ArchiMate language is used in indus-
try, and it is supported with some open source
tools, for example, Archi 2.4. (Institute of Edu-
cational Cybernetics, 2012)
We investigate the ArchiMate and its extensions. As a
result, we propose a visualization methodology based
on the ArchiMate and its extensions and motivate our
suggestions with the cases of transformation of ERP
using the Best of Breed strategy.
The structure of the paper is the following:
Section 2 describes some characteristics of Archi-
Mate relevant to the visualization of changes.
Section 3 provides information about our experi-
mental approach for development of the visualization
methodology in ArchiMate.
Section 4 presents our method for visualization of
changes in ArchiMate and its known extensions.
Section 5 discusses the principles, means and ab-
stractions used for visualization and the scalability is-
114
Bakelaar R. and Roubtsova E.
Visualization of Changes in ArchiMate - Within the Application and Technology Layers.
DOI: 10.5220/0006222801140123
In Proceedings of the Sixth International Symposium on Business Modeling and Software Design (BMSD 2016), pages 114-123
ISBN: 978-989-758-190-8
Copyright
c
2016 by SCITEPRESS – Science and Technology Publications, Lda. All rights reserved
sues.
Section 6 concludes the paper.
2 ARCHIMATE
ArchiMate is one of the popular tools for visualiza-
tion of enterprise architecture (Fritscher and Pigneur,
2011), (Lankhorst et al., 2009). Mostly it is because
it supports visualization of three related layers of the
enterprise architecture:
1. the business layer (products, services, actors, pro-
cesses);
2. the application layer (application components, ap-
plication functions and data objects) and
3. the technological layer (infrastructure services,
hardware, system software).
There are also ArchiMate extensions (The Open
Group, 2013) that cover high level concepts used in
business implementation. Among them are the moti-
vation extension and the implementation and migra-
tion extension.
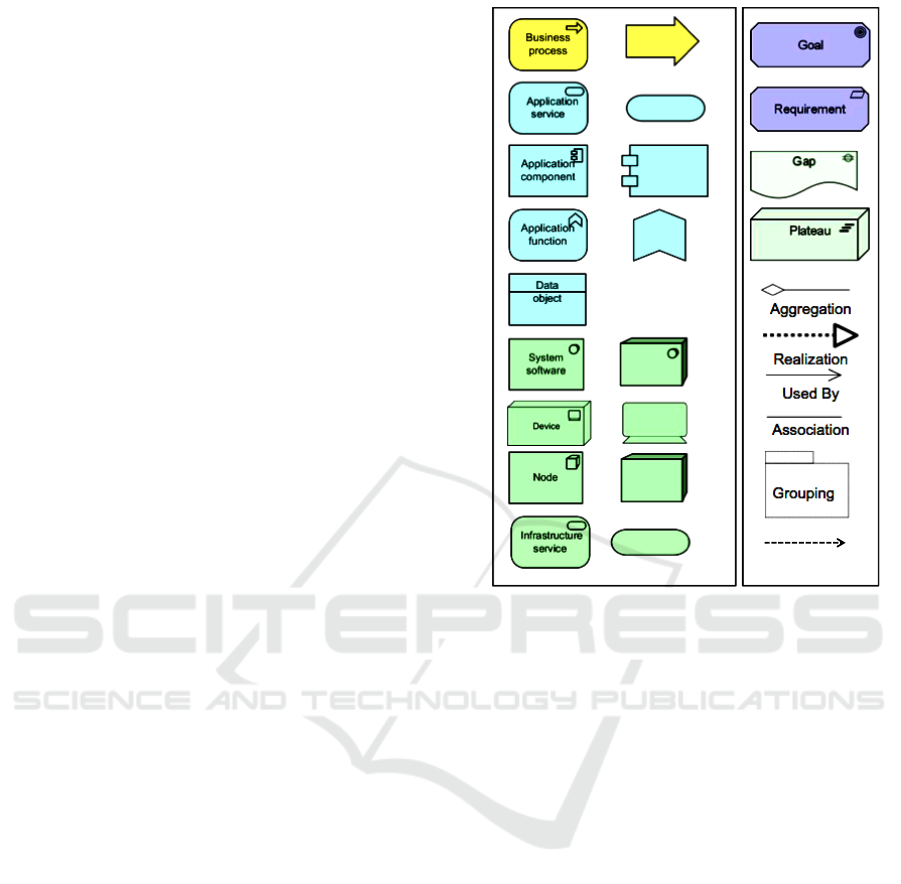
The visual elements of ArchiMate within the ap-
plication and technology layers are mostly concepts
and relations (Lankhorst et al., 2010):
• Active elements performing behavior (i.e. appli-
cation service, application component).
• Elements describing behavior (i.e. infrastructure
service, application function).
• Passive elements on which behavior is performed
(i.e. data object).
• Relations between the elements, depicted as con-
necting lines between elements or boxes.
• The visual elements can be included into other el-
ements by aggregation, composition and grouping
relations.
In the motivation, implementation and migration ex-
tensions, there are:
• Elements describing motivation: goals, require-
ments, principles;
• Elements describing migration: plateaus and
gaps.
The elements used in this paper are listed in Fig-
ure 1.
Our research questions were the following. Are
the visual elements of ArchiMate and its extensions
sufficient to visualize changes of architecture? What
is a method of application of visual elements for visu-
alization of architecture changes?
30/04/2016 Dr.Ir. E.E.Roubtsova. OU Nederland 12
Access
Figure 1: Visual elements of ArchiMate and its extensions
used in this paper
3 DEVELOPMENT OF A
VISUALIZATION METHOD
We apply the experimental approach to propose a vi-
sualization method for changes of an enterprise archi-
tecture. The experiment is set on the ERP implemen-
tation within Royal Vopak (https://www.vopak. com/)
modified using the Best of Breed strategy.
3.1 Best of Breed
Business processes often contain some parts of func-
tionality that are well supported by standard solu-
tions. The Best of Breed strategy is directed to
use the most suitable standard software and to de-
velop only the parts that are not supported by stan-
dard software (Light et al., 2001). This approach
promises flexible application implementation, low
costs of maintenance and changes (Cardoso et al.,
2004).
Many companies have ERP systems that provide
all the applications for an enterprise and integrate
them in a superior solution where every module may
not be the best of its class. If a company has an imple-
Visualization of Changes in ArchiMate - Within the Application and Technology Layers
115
A B C
D E
F G H
DATA
Data / Information integration
C E H F GD
DATA
DATA DATA DATA DATA
A
B
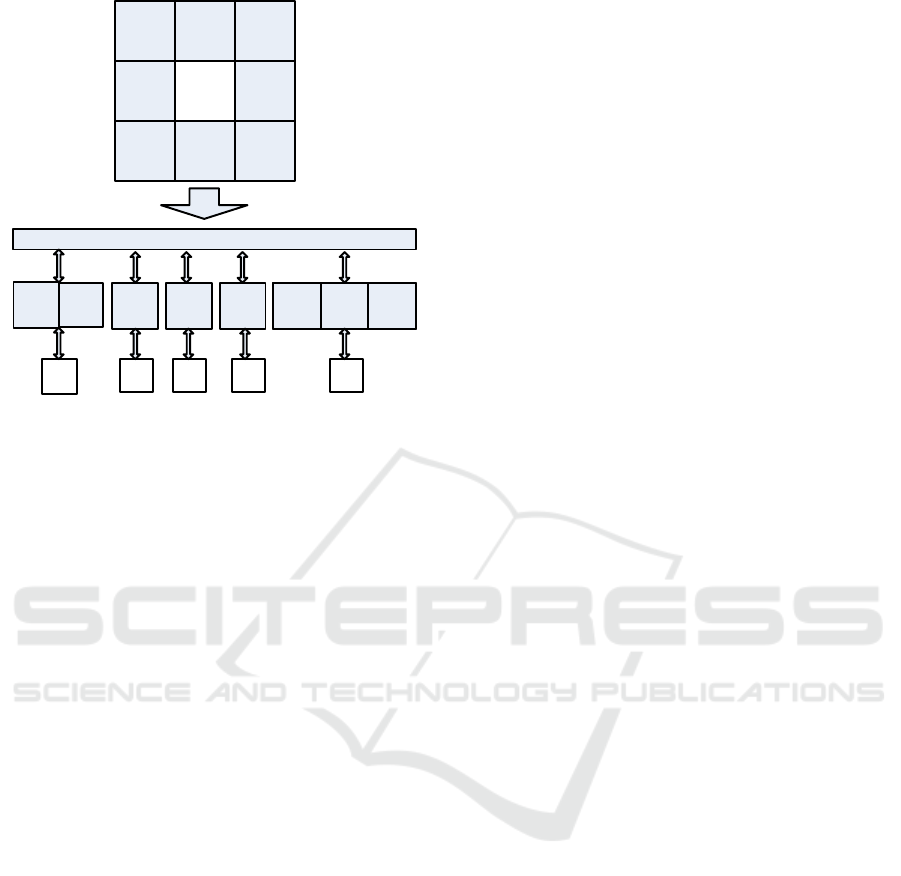
Figure 2: From ERP to Best of Breed: The ERP implemen-
tation of functions (A, B,C, D,E, F, G, H) are decomposed
into the best applications available on the market (A, B),
(D, F, G), C, E and H.
mented ERP system and wants to change it in order to
use the best standard solutions, the company needs to
visualize, examine and change its architecture.
Ideally, the transformation is the decomposition
of the application functionality and the data, as it
is shown in Figure 2. In reality, the elements are
not only decomposed, but also removed, added and
changed. Because of that, we have studied several
cases of architectural changes.
3.2 Cases of changes
We consider the following business situations that
cover the transformation from ERP to Best of Breed:
1. The business process remains unchanged, but the
changes should be made in the application and the
technological layers by adding, changing and re-
moving elements.
2. The relations between applications may change.
3. The relations between technological elements and
applications may change.
4. The relations between business functions and ap-
plications may change.
For each of the situations, we analyse what should
be visualised. Doing the experiment, we have discov-
ered the repeated steps, artifacts, principles and means
useful for visualization of changes in ArchiMate and
also some missing relations that are needed to visu-
alise changes.
4 VISUAL ARTIFACTS
The set of visual artifacts depends on the chosen strat-
egy and on the given requirements. Therefore, we
need a goal/requirements view.
Our strategy is the Best of Breed, where the de-
composition of existing application functions, new
functions and obsolete functions should be shown on
architectural views.
Then the question of the technological support of
application functions should be solved. The key dif-
ference between ERP and Best of Breed is the way
of data/information integration via a service bus (Fig-
ure 2). This means, that at least one view should ex-
amine the communication between application func-
tions.
At the end, it is good to remind that the changes
are implemented for business. Therefore, the relations
of the new and decomposed functions with the busi-
ness layer should be visualized.
In all cases of the transformation from ERP to the
Best of Breed solutions, we have found that visualiza-
tion of changes consists of visual artifacts produced in
the order presented below.
1. Strategy of changes; business strategy, IT princi-
ples and requirements - the motivation behind the
IT transformation.
2. Transition between the As-Is and To-Be architec-
ture, including the gap of changes and the goals,
requirements and principles related to the archi-
tecture states and changes.
3. As-Is and To-Be architectures at the application
layer without specific indication of changes.
4. Gap of changes, presented at the application layer.
The focus is on changed elements and on relations
between the obsolete and new elements.
5. Gap of changes, combining the application and
technology layers and the motivation.
6. Gap of changes at the application and technology
layers with the focus on communication elements.
7. Gap of changes, at the application and business
layers with the focus on relations between busi-
ness steps and the applications supporting these
business steps.
4.1 Illustration of Visual Artifacts
We illustrate the proposed visualisation method with
one of our cases “Replacement of an Order Manage-
ment Component in the Order Management and In-
voicing service”.
Sixth International Symposium on Business Modeling and Software Design
116
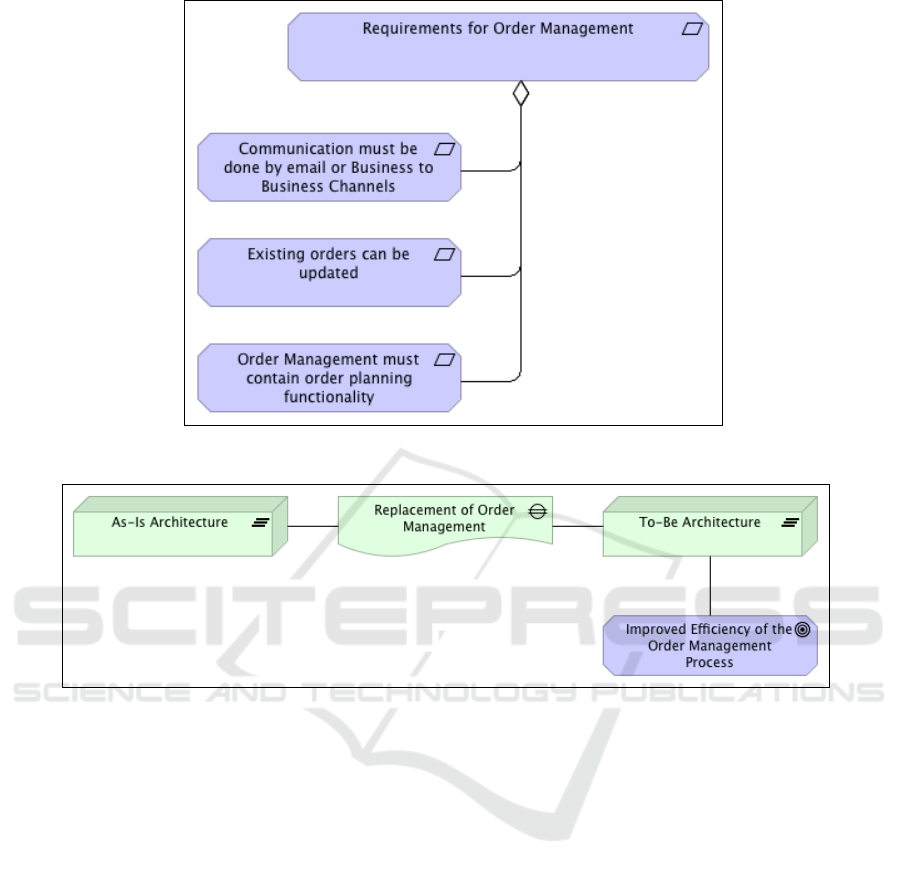
Figure 3: Example of Artifact 1: Requirements for changes.
Figure 4: Example of Artifact 2: Abstract transition between As-Is and To-Be architectures.
4.1.1 Strategy
Figure 3 shows an example of the visual artifact (1),
the requirements for changes. In the To-Be architec-
ture, the orders should be taken via e-mail and B2B
channels. The functions of validation and updating
of the taken orders should be preserved. The motiva-
tion extension of ArchiMate is used for visualization
of requirements in Figure 3.
4.1.2 Transition
The migration extension is used to draw the transi-
tion from one architecture to another (artifact (2)).
Plateaus are used to represent As-Is and To-Be ar-
chitectures and a gap visualizes the actual changes.
Figure 4 represents the transition between As-Is and
To-Be.
4.1.3 As-Is, T-Be
Figures 5 and 6 represent the visual artifacts (3), the
As-Is and To-Be architectures at the application level.
As the reader may see, the time consuming and error
prone comparison of the As-IS and To-Be architec-
tures should be done in order to find the changes. So,
to ensure the understanding of changes, the views on
the gap of changes should be provided.
4.1.4 Views on a Gap of Changes
In the case of decomposition of application functions
(Best of Breed strategy) with new functions, we need
to focus first on application layer, application func-
tions and on relations between the obsolete and and
new functions. Figure 7 is an example of the artifact
(4), being a view on the gap of changes with the focus
on application functions and on the relation between
the obsolete and new application functions. Figure 7
shows that the set of standard ArchiMate elements
should be extended with new relations <Extended-
by>, <Replaced-by> to enable visualization of re-
lations between the obsolete and new elements.
The Best of Breed strategy includes changes
Visualization of Changes in ArchiMate - Within the Application and Technology Layers
117
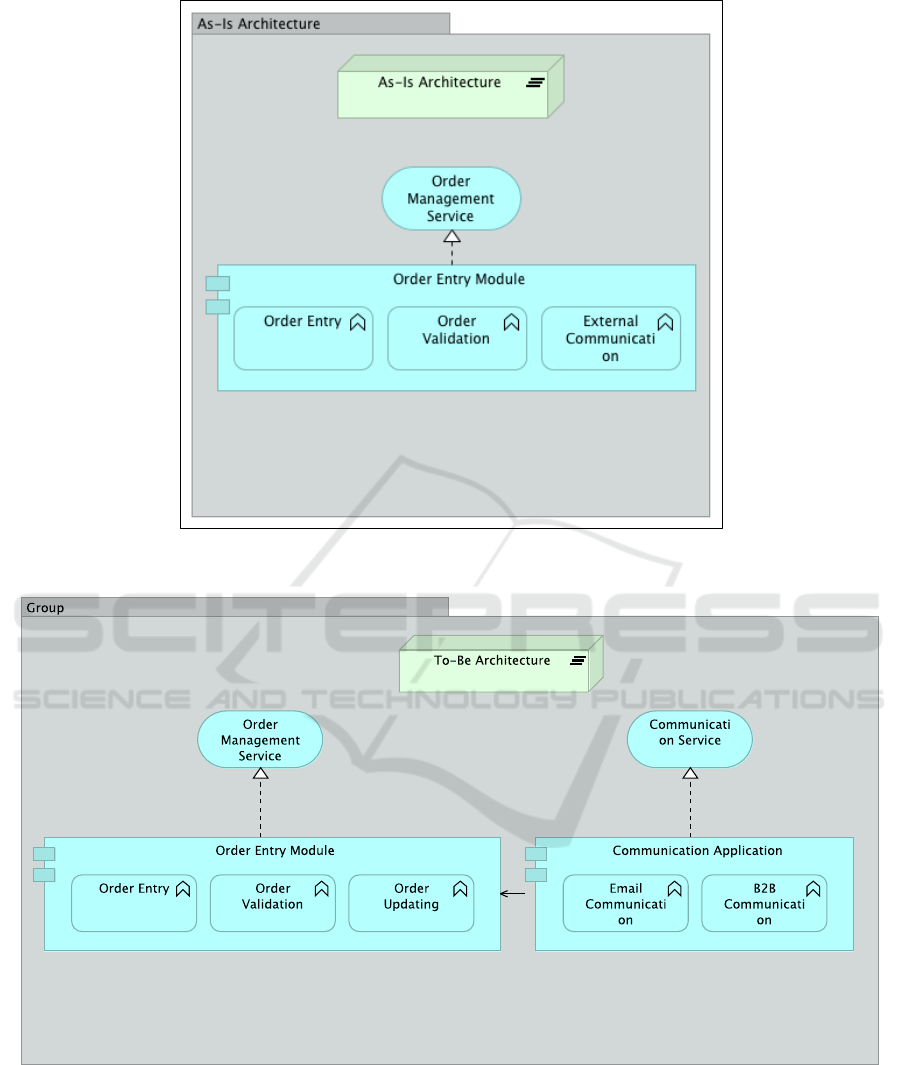
Figure 5: Example of Artifact 3: As-Is Architecture.
Figure 6: Example of Artifact 3: To-Be Architecture.
within the technological layer, because the imple-
mented applications are taken from the market.
Therefore, the artifact (5) (Figure 8) presents the ap-
plication and technology layers with motivation and
still keeps the focus on changes. It shows that the
messaging service, implemented on the SaaS plat-
form, has been chosen for the e-mail and B2B order
taking.
Because the Best of Breed application functions
are differently organized, the communication of them
Sixth International Symposium on Business Modeling and Software Design
118
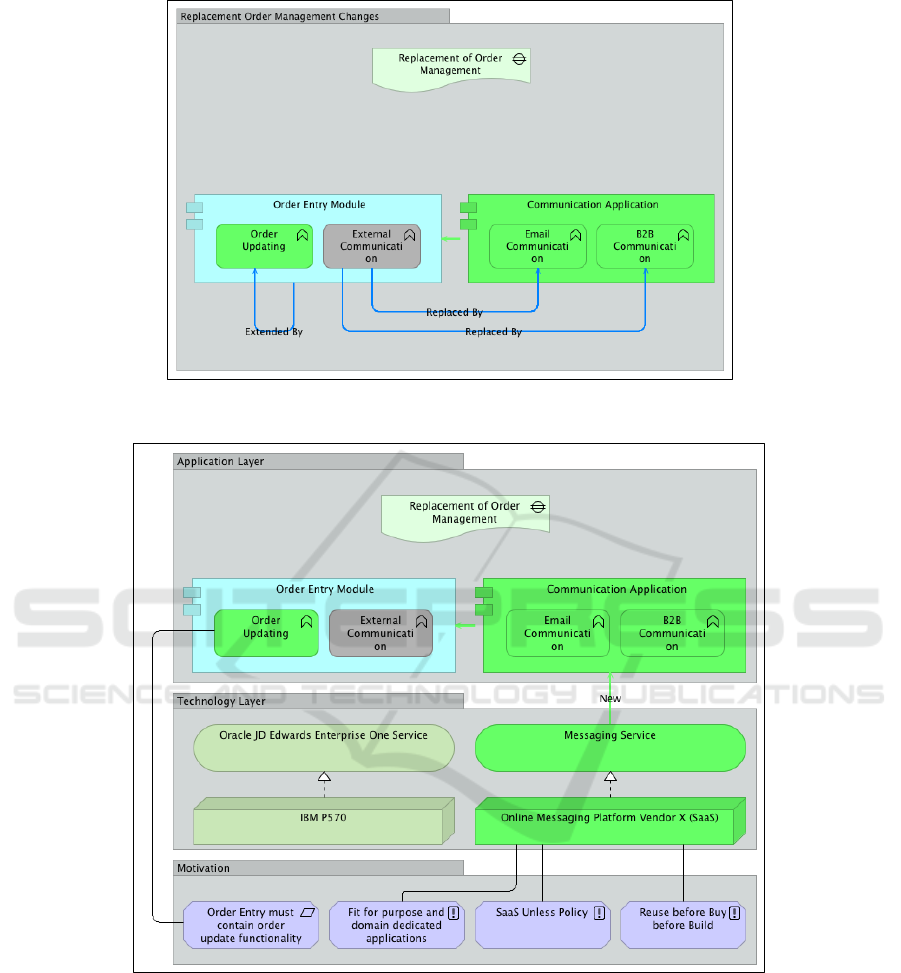
Figure 7: Example of Artifact 4: Gap of changes with focus on relations between the old and new application functions.
Figure 8: Example of Artifact 5: Gap of changes with focus on relations between the application, technology and motivation
layers.
is also changed. The next artifact (6) has the focus on
communication. Figure 9 presents the gap of changes,
but abstracted from the application functions and fo-
cused on the communication elements. Two groups
of application functions implement two services: the
Communication Service and the Order Management
Service. The Order Management Service publishes
messages to the Enterprise Service Bus. The Commu-
nication Service subscribes for these messages.
Figure 10 shows the artifact (7), i.e. the relations
of the application layer and the business layer. We
can see that the process step Contact relevant party of
the process Order Intake, planning and scheduling is
supported by the Communication Application.
Visualization of Changes in ArchiMate - Within the Application and Technology Layers
119
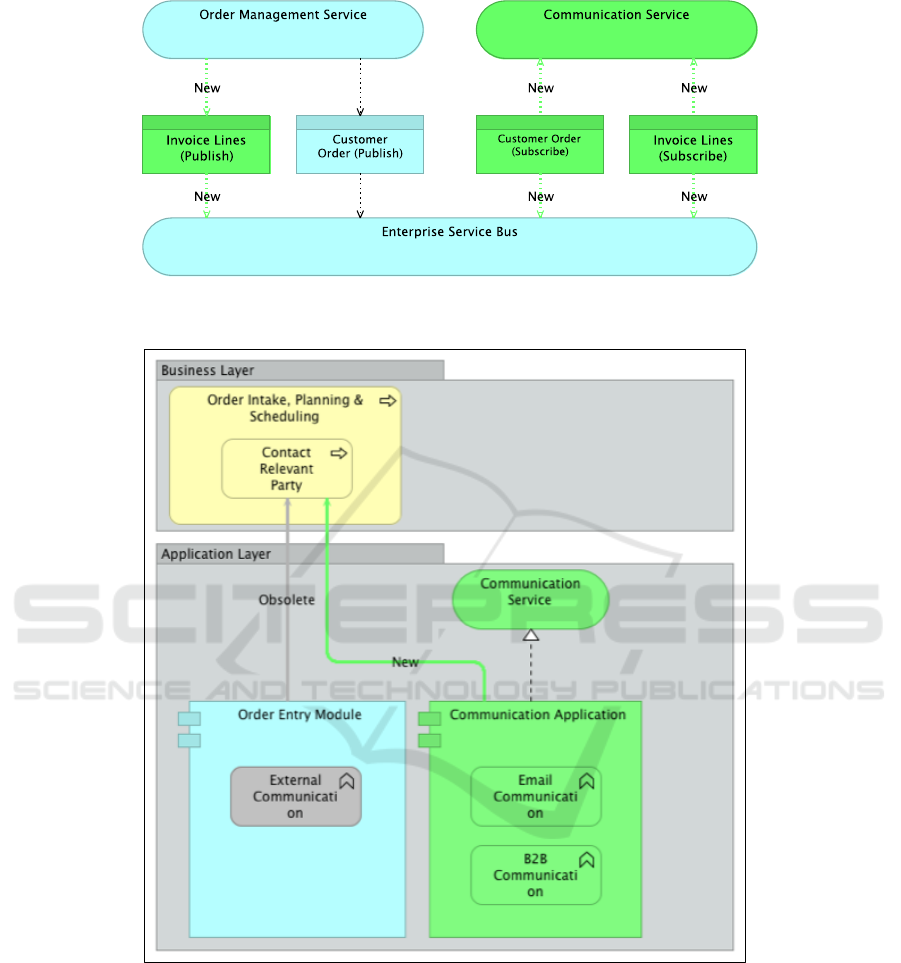
Figure 9: Example of Artifact 6: Gap of changes with focus on communication elements.
Figure 10: Example of Artifact 7: Gap of changes with focus on relations between business and application layers.
5 DISCUSSION
5.1 Visualization Principles
Our visualization principles are the minimum visual
elements and the focus on changes. In order to follow
these principles, we sought for means for separation
the changes and unchanged elements and for visual-
ization of relations between unchanged elements and
new elements at the business, application and tech-
nology layers. So, we explored available means of
visualization in ArchiMate.
Sixth International Symposium on Business Modeling and Software Design
120

5.2 Means of Visualization
5.2.1 Changed Services. Using Colors and
Labels <new>, <changed> and
<obsolete>
First, we decided to use colors and show
- new objects in green;
- changed objects in orange;
- obsolete objects in grey.
However, we have found, that when a model con-
tains a large number of objects and even objects over
multiple layers, the use of colors can be distracting
and can make the visualization unclear, due to the fact
that the layers in ArchiMate are distinct by color. So,
we suggest to include the labels <new>, <changed>
and <obsolete> in the objects name. Obsolete ob-
jects also may be crossed, but this demands new ex-
tensions of ArchiMate.
5.2.2 Large Number of Changed Objects or
Objects Related to the Changed Objects.
Using Grouping, Aggregation and
Composition
In the case of large amounts of changed elements and
thus a large amount of colors, the elements belonging
to a specific layer can be grouped together, indicating
a specific layer, using the group relation.
Let us remaind that “the grouping relationship is
used to group an arbitrary group of model objects,
which can be of the same type or of different types.
In contrast to the aggregation or composition rela-
tionships, there is no “overall” object of which the
grouped objects form a part. Unlike the other lan-
guage concepts, grouping has no formal semantics.
It is only used to show graphically that model ele-
ments have something in common. Model elements
may belong to multiple (overlapping) groups.” (The
Open Group, 2013)
Figure 8 demonstrates that the functions E-mail
Communication and B2B Communication form the
group Communication Application. At Figure 8 we
also see the group Order Entry that includes the func-
tions Order Updating and the obsolete function Ex-
ternal Communication.
The application functions are visualised within the
group Application layer; the motivation elements are
presented within the Motivation group and the techno-
logical elements are situated in the group Technology
layer.
Aggregation and composition in ArchiMate have the
formal semantics inspired by the UML. When ele-
ments belong to other elements by an aggregation or
composition relation, elements can be rolled up to the
aggregated or composed element. In our example, the
requirements in Figure 3 can be rolled up to the top
requirement Requirements for Order Management.
5.2.3 Omitting Unchanged Elements
The unchanged elements can be sometimes omit-
ted from the model. When a model contains un-
changed elements and those elements are part of a
more generic element (that is required for clarity in
the model), the elements can be left out and only the
generic element can be a part of the model, using the
generalization method.
Figure 10 shows the changes of the relations be-
tween the application and business layers: the rela-
tion between the function External Communication
and the Contact Relevant Party is obsolete. The func-
tion Order Updating is omitted from the Order Entry
Module, because the omitted function does not have
any changed relations with business layer.
5.2.4 New Relations Between Changed Elements
and Motivation
We have found it very useful that the core ele-
ments of ArchiMate can be related to motivational
elements (goals, principles, requirements etc). (The
Open Group, 2013) We associate the changed archi-
tectural elements with motivation elements to visual-
ize the reasoning behind the changes.
Figure 8 shows that the motivating requirement
Order Entry must contain order updating function-
ality is related to the Order Updating function. The
principles SaaS Unless Policy, Reuse before Buy be-
fore Build and Fit for Purpose and domain dedicated
applications motivate the Online messaging platform
vendor X (SaaS).
5.2.5 Relations < Extended-by>,
<Replaced-by>.
The core of the transformation of ERP using the Best
of Breed strategy is the decomposition of functional-
ity and data, as it is shown in Figure 2. However, in
reality, this pure transformation is rare. Usually, even
when following the Best of Breed strategy of changes,
some functions are deleted; the new functions replace
the old ones, and the new functions are often added.
Therefore, we have found it useful to introduce the re-
lations between the new and old functions and groups
of functions.
Relations like <Extended-by> and <Replaced-
by> are definitely needed for the visualization of
changes. Figure 7 shows such relationships. As the
Visualization of Changes in ArchiMate - Within the Application and Technology Layers
121

current ArchiMate language does not have such re-
lation types, we reuse the directed relations of types
<used-by> or <triggering relationship> and replace
their labels by <Extended-by>, <Replaced-by>.
5.3 Scalability of Visualization
In all cases, the visualization of changes is a very
creative activity that demands good abstraction and
generalization skills. The comprehensible views of a
system with large amount of elements cannot be pro-
duced without abstractions. In particular, the ability
to make groups of elements and the ability to respon-
sibly omit elements are the key techniques for visual-
izing of changes in a comprehensible way.
Three types of abstractions have been found useful
for visualization of changes:
1. the abstractions from the unchanged elements;
2. the abstraction from the elements that are out of
focus of particular view;
3. the abstractions from relations and elements in
a chain using the derived relationships of Archi-
Mate.
The abstractions from relations and elements in
a chain using the derived relationships of ArchiMate
need some explanation. The matter is that the struc-
tural relations in ArchiMate are divided into four cat-
egories of strength, where “association is the weakest
structural relationship; composition is the strongest.
Part of the language definition is an abstraction rule
that states that two relationships that join at an inter-
mediate element can be combined and replaced by the
weaker of the two.”(The Open Group, 2013)
Using this abstraction rule of derived relations, a
view may abstract from the intermediate elements of
a chain of related elements (make some intermediate
elements invisible). Elements can be rolled up, us-
ing the derived relationship of ArchiMate, where the
chain of related elements can be generalized by re-
lating two elements in the chain using the “weakest”
relation in the chain.
For example, this derived relationship rule allows
us to show in Figure 9 only the access relations be-
tween the services the Order Entry Module and the
Communication Application and the massages (data
objects) via the Enterprise Service Bus. All other
technological components are omitted.
Another way of making the visualization of
changes scalable is showing a sequence of gaps. As
changes within a system are often implemented in
steps, the visualization of each step as a gap of
changes may restrict the number of changed elements
and relations and make the visualization of each gap
comprehensible.
6 CONCLUSIONS AND FUTURE
WORK
This paper presents a method for visualization of
changes in ArchiMate with its motivation, migration
and implementation extensions.
It was found that this combination of ArchiMate
and extensions supports visualization of changes. We
identified a set of views, and abstractions needed to
visualize the changes in cases of transformation of
ERP using the Best of Breed strategy. However, we
also found a small set of new elements needed in
ArchiMate to specify the relations between the obso-
lete and the new elements and to support abstraction
from the obsolete and unchanged elements.
The reproducibility of the proposed visualization
method was tested on several cases of transformation
of ERP using the Best of Breed strategy. We ex-
pect that different strategy of changes may extend our
method with new views on the gap of changes, but the
core of the proposed method and discussed abstrac-
tions should remain the same.
In the future work, we are going to apply this
method of visualization of changes in new projects.
We plan to focus on the cases of application of derived
relationships for visualization. Moreover, we plan to
look at the methods for the separation of changes into
sequential steps making the visualization of archi-
tectural changes scalable. Potentially, the proposed
method may become a basis of a tool support for vi-
sualization of changes in ArchiMate.
REFERENCES
Cardoso, J., Bostrom, R. P., Sheth, A., and Sheth, C. I. A.
(2004). Workflow Management Systems and ERP
Systems: Differences, Commonalities, and Applica-
tions. Inf. Technol. Manage, 5:319–338.
Fritscher, B. and Pigneur, Y. (2011). Advanced Information
Systems Engineering Workshops: CAiSE 2011 Inter-
national Workshops, London, UK, June 20-24, 2011.
Proceedings, chapter Business IT Alignment from
Business Model to Enterprise Architecture, pages 4–
15. Springer Berlin Heidelberg, Berlin, Heidelberg.
Institute of Educational Cybernetics (2012). Archi 2.4,
http://archi.cetis.ac.uk/.
Lankhorst, M. M., Proper, H. A., and Jonkers, H. (2009).
Enterprise, Business-Process and Information Sys-
tems Modeling: 10th International Workshop, BP-
MDS 2009, and 14th International Conference, EMM-
Sixth International Symposium on Business Modeling and Software Design
122

SAD 2009, held at CAiSE 2009, Amsterdam, The
Netherlands, June 8-9, 2009. Proceedings, chapter
The Architecture of the ArchiMate Language, pages
367–380. Springer Berlin Heidelberg, Berlin, Heidel-
berg.
Lankhorst, M. M., Proper, H. A., and Jonkers, H. (2010).
The Anatomy of the ArchiMate Language. IJISMD,
1(1):1–32.
Light, B., Holland, C. P., and Wills, K. (2001). ERP and
Best of Breed: a comparative analysis. Business Pro-
cess Management Journal, 7(3):216–224.
The Open Group (2013). ArchiMate 2.1 Specification.
http://pubs.opengroup.org/architecture/archimate2-
doc/chap03.html.
The Open Group (2016). TOGAF 9.1, an Open Group stan-
dard, http://www.opengroup.org/subjectareas/
enterprise/togaf.
Visualization of Changes in ArchiMate - Within the Application and Technology Layers
123
