
Parallel Real Time Seizure Detection in Large EEG Data
Laeeq Ahmed
1
, Ake Edlund
1
, Erwin Laure
1
and Stephen Whitmarsh
2
1
Department of Computational Science and Technology, Royal Institute of Technology, Stockholm, Sweden
2
Swedish National Facility for Magnetoencephalography (NatMEG), Karolinska Institutet, Stockholm, Sweden
Keywords:
BigData, MapReduce, Spark, Epilepsy, Seizure Detection, Real Time.
Abstract:
Electroencephalography (EEG) is one of the main techniques for detecting and diagnosing epileptic seizures.
Due to the large size of EEG data in long term clinical monitoring and the complex nature of epileptic seizures,
seizure detection is both data-intensive and compute-intensive. Analysing EEG data for detecting seizures in
real time has many applications, e.g., in automatic seizure detection or in allowing a timely alarm signal to be
presented to the patient. In real time seizure detection, seizures have to be detected with negligible delay, thus
requiring lightweight algorithms. MapReduce and its variations have been effectively used for data analysis in
large dataset problems on general-purpose machines. In this study, we propose a parallel lightweight algorithm
for epileptic seizure detection using Spark Streaming. Our algorithm not only classifies seizures in real time, it
also learns an epileptic threshold in real time. We furthermore present “top-k amplitude measure” as a feature
for classifying seizures in the EEG, that additionally assists in reducing data size. In a benchmark experiment
we show that our algorithm can detect seizures in real time with low latency, while maintaining a good seizure
detection rate. In short, our algorithm provides new possibilities in using private cloud infrastructures for real
time epileptic seizure detection in EEG data.
1 INTRODUCTION
We are currently seeing a surge of data produced both
by businesses and the scientific community due to the
relentless growth in information technology and in-
strumentation, coined “BigData”. Much of this data
needs to be processed and analysed at the same rate as
it is produced, i.e., in an online analysis setting. Ex-
amples of applications that need real time predictive
data analysis are forex trading, web traffic monitor-
ing, network data processing, and sensor-based mon-
itoring. The three main characteristics of BigData are
volume, variety and velocity (Zikopoulos and Eaton,
2011). Due to the variety and velocity of BigData,
analysis in real time comes with challenges that are
not taken care of by customary methods (Bifet, 2013).
These challenges include the huge sizes of data that
do not fit in memory and the time required for an
online processing model (integrating newly produced
data to the predictive model with negligible delay is a
challenge) (Bifet, 2013).
Various parallel programming models and frame-
works are available to solve such complex and large
size problems, such as MPI (Gropp and Skjellum,
1999), OpenMP (Dagum and Enon., 1998) and
MapReduce (Dean and Ghemawat, 2008). MPI is
an open source message passing programming library
for parallel and distributed systems. OpenMP was in-
troduced to make use of shared memory for parallel
processing with the arrival of the multicore era. Al-
though BigData problems can be solved with MPI and
OpenMP, it requires extra effort from scientists who
are experts in their domains but lack the necessary
programming skills to be able to use such initiatives.
Furthermore, high throughput and fault-tolerance are
key requirements for real time applications with mas-
sive datasets, which are not readily available with
MPI and OpenMP.
MapReduce (Dean and Ghemawat, 2008) is
a parallel programming framework for commod-
ity machines that was introduced by Google in
2005. MapReduce is a high-throughput program-
ming model that comes with built-in fault tolerance,
data-distribution and load balancing, thus making
easier to implement parallel applications. Previous
studies (Kang and Lee, 2014; Ekanayake and Fox,
2008) have shown that MapReduce scales well when
the size of data is large and the computations are
relatively simple. The past decade has seen dif-
ferent variations of MapReduce or similar frame-
works, the most famous one being Hadoop MapRe-
duce (HMR) (Hadoop, 2009). Apache Spark (Za-
214
Ahmed, L., Edlund, A., Laure, E. and Whitmarsh, S.
Parallel Real Time Seizure Detection in Large EEG Data.
DOI: 10.5220/0005875502140222
In Proceedings of the International Conference on Internet of Things and Big Data (IoTBD 2016), pages 214-222
ISBN: 978-989-758-183-0
Copyright
c
2016 by SCITEPRESS – Science and Technology Publications, Lda. All rights reserved
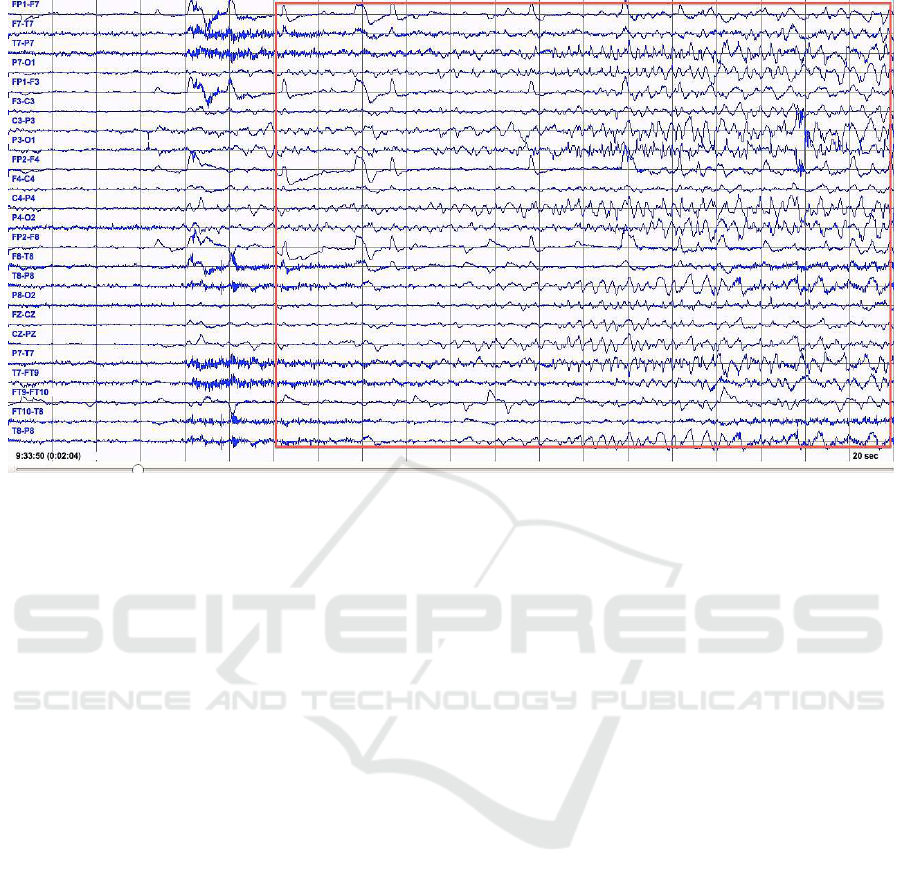
Figure 1: Rhythmic Activity during Epileptic Seizure.
haria, 2010) is one of the emerging frameworks for
cluster computing, which make use of commodity
systems for big data analytics. Spark is an in-memory
distributed processing framework that can be up to
100 times faster than HMR. It has an efficient fault
tolerance approach based on “lineage”, which saves
I/O. More details about “lineage” are given in Sec-
tion IV. Furthermore, Spark has a much richer API
than conventional HMR, and includes many functions
other than just Map and Reduce. This richer API
makes Spark a general-purpose parallel programming
framework, thus suitable for scientific use, such as in
neuroscience.
In this paper, we focus on real time processing
of neuroimaging data. Epileptic patients are nor-
mally monitored in the neurophysiological clinics us-
ing EEG, a non-invasive, multichannel technology for
recording the brain’s activity. The scalp EEG record-
ings used in the clinics are capable of producing data
at a sampling rate of about 2kHz. Furthermore, espe-
cially in experimental studies, the number of channels
used has increased from tens to hundreds (Riedner,
2007; Ferrarelli, 2010). To get an idea of the amount
of data, a continuous EEG monitoring of a patient at
256 Hz with 24 channels will approximately gener-
ate 1GB data per day. With higher sampling rate and
increased number of channels, datasize can increase,
e.g., 500GB per day (Wulsin, 2011) . All these char-
acteristics make the processing of EEG a compute-
intensive and data-intensive task.
EEG is one of the techniques that is used for
detecting and diagnosing epileptic seizures (Smith,
2005). Real time automatic seizure detection can be
beneficial in many scenarios. For instance, it is labor-
intensive to manually monitor continuous EEG of
epileptic patients to observe abnormalities. Real-time
detection of the onset of epileptic seizures can also
provide timely alarms to the patient. It has been pre-
viously (Kramer, 2011) shown that automatic seizure
detection in combination with alarm signal can be
used to alert a patient or a caretaker regarding the
seizure. In these scenarios data has to be analyzed
online, and in real-time. In other words, decisions
have to be made, and results provided with negligible
delay. These big data size and real time requirements
make EEG data a good candidate for the real time dis-
tributed streaming framework.
Studies of processing EEG data using MapReduce
or other cloud based programming models have been
scarce. Though previous studies (Wang, 2012; Dutta,
2011) show commendable results, they were used for
general processing and storage of EEG, and not for
seizure detection. Furthermore, in most of the stud-
ies, EEG data was processed as a batch in an offline
setting. More on related work in Section II.
In this paper, we present a lightweight algorithm
for real time seizure detection in EEG data using
Spark streaming (Zaharia, 2012a), a component of
Spark for parallel processing of streaming data. Using
this algorithm we classified the epileptic EEG from
normal EEG of the same patient in real time. Our
algorithm not only classified seizures in real time, it
also learned the threshold in real time. We also in-
troduced a new feature “top-k amplitude measure”
Parallel Real Time Seizure Detection in Large EEG Data
215
for classifying seizures from non-seizure EEG data,
which helps with the size reduction of data. Our work
shows that EEG can be processed and analyzed as
streams in real time using big data analytics technolo-
gies, opening up a new way to process EEG data on
huge cloud computing infrastructures. To the best of
our knowledge, this paper is the first attempt to pro-
cess EEG as parallel streams for seizure detection in
such an environment.
The rest of the paper is organized as follows: In
Section II, we discuss related work. In Section III, we
describe the working of EEG and give details about
seizure characteristics. In Section IV, we introduce
Spark streaming. In Section V, we discuss feature se-
lection, seizure detection algorithm and implementa-
tion. In Section VI, we discuss the performance of our
implementation and in Section VII, we give a conclu-
sion and future work.
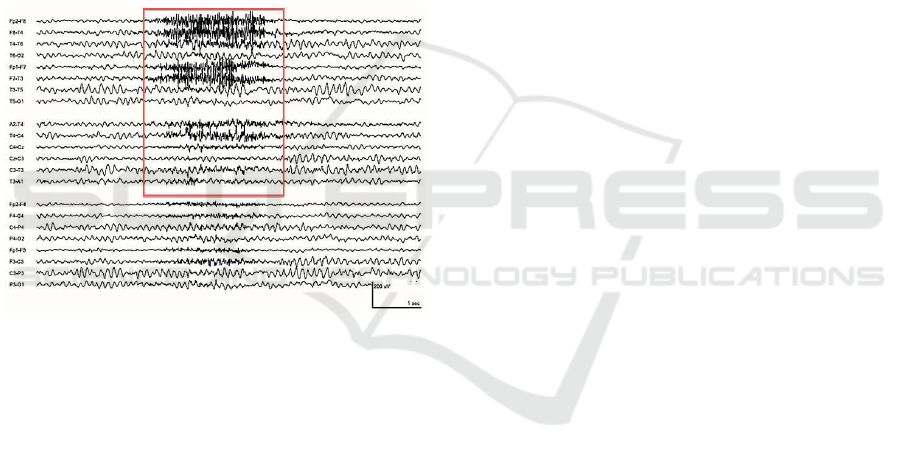
Figure 2: Facial Muscle Artifact (Stern, 2005).
2 RELATED WORK
Although we have not found any studies for seizure
detection in EEG data using Spark or MapReduce,
there are some studies that use MapReduce for pro-
cessing and storage of EEG data. In study (Wang,
2012), the authors implement a parallel version of
Ensemble Empirical Mode Decomposition (EEMD)
algorithm using MapReduce. They advocate that al-
though EEMD is an innovative technique for process-
ing neural signals, it is highly compute intensive and
data-intensive. The results show that parallel EEMD
performs significantly better than the normal EEMD
and also verifies the scalability of Hadoop MapRe-
duce.
Another study (Dutta, 2011) uses Hadoop and
HBase based distributed storage for large scale Multi-
dimensionalEEG. They benchmark their study on Ya-
hoo! Cloud Serving Benchmark (YCSB) and check
the latency and throughput performance characteris-
tics of Hadoop and HBase. Their results suggest that
these technologies are promising in terms of latency
and throughput. However, at the time of their study,
they found that Hadoop and HBase were not mature
enough in terms of stability.
3 SCALP EEG AND EPILEPTIC
SEIZURES
EEG measures the electrical activity of the brain
through multiple electrodes attached to the scalp.
Electrical currents are recorded as multi-channel time
series, often in the range of 128 to 2,000 samples
per second per channel. The electrical current pro-
duced by a single neuron is too small to be recorded
by EEG (Nunez and Srinivasan, 2006). Instead, EEG
records the activity of many simultaneously active
neurons. Each EEG channel is typically calculated
by taking the difference between recordings of one or
two reference electrodes.
When a seizure occurs, it can be measured as high
amplitude EEG activity. A typical EEG with seizure
is shown in Figure 1. In the figure, we see a change in
the rhythmic activity of FP1-F7, FP1-F3, FP2-F4 and
FP2-F8 with the onset of an epileptic seizure and then
continue as seen in the red rectangle. Not all activity
measured by EEG is of cortical origin either. EEG
activity might be contaminated by electrical activity
from other parts of the body (e.g., the heart), from
instrument noise or from environmental interference.
For instance, Figure 2 shows a normal EEG with fa-
cial muscle artifact and should not be confused with
seizure activity.
There are some main characteristics that can be
considered in seizure detection (Qu and Gotman,
1997; Shoeb, 2004). First, a large variability of
seizure activity exists among individuals. Second,
seizure activity within an individual shows similar-
ities between different occurrences of seizures. On
the basis of these very general characteristics, patient-
specific seizure detection algorithms have been de-
veloped previously (Qu and Gotman, 1997; Shoeb
and Guttag, 2010). Our algorithm follows the same
principles and seizure activity of each individual is
learned in real time.
4 SPARK STREAMING
Spark streaming (Zaharia, 2012a) is part of Apache
Spark big data analytics stack for developing real
IoTBD 2016 - International Conference on Internet of Things and Big Data
216
time applications. One key issue with traditional
distributed stream processing systems was inefficient
fault tolerance. These systems either used replication
or upstream backup for providing fault tolerance. In
replication, two copies of each node exist whereas in
upstream backup, nodes keep messages in a buffer
and later send these messages to a new copy of the
failed node. Both approaches are unproductive (Za-
haria, 2012a) in large cloud infrastructures: replica-
tion needs twice the amount of hardware, whereas
upstream backup is slow because the whole system
waits for the new node to rebuild the state of the failed
node. Traditional distributed stream processing also
had issues of inconsistency and unavailability of any
approach for unifying stream processing with batch
processing. Another important challenge was to make
a low latency model for such systems. To overcome
these issues, Spark introduced a new programming
model of discretized streams (D-Streams).
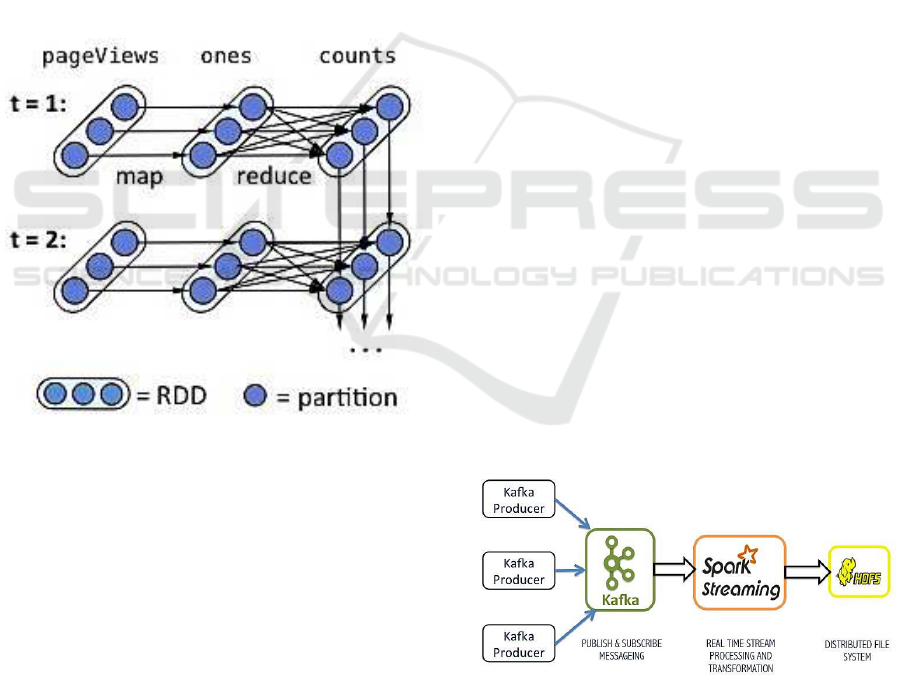
Figure 3: Lineage graph of RDDs (Zaharia, 2012a).
The idea of D-Streams (Zaharia, 2012a) is to con-
sider streaming computation into a sequence of de-
terministic batch computations on small time inter-
vals. During the time interval, the input for each in-
terval is stored across the cluster. After the comple-
tion of time interval, parallel operations like map, re-
duce and groupby are performed on input datasets to
produce intermediate or output representations. As
the earlier batch gets processed, the next batch comes
in and the same operations are performed on new
data and the process goes on. Resilient distributed
datasets (RDDs) (Zaharia, 2012b) are used to store
these datasets on a cluster. RDDs are parallel fault tol-
erant distributed data structures that allow us to store
intermediate results in memory, efficiently partition
the datasets for better data placement and transform-
ing them using multiple operations. The ability of
RDDs to regenerate themselves from lineage allows
D-Streams not to use the conventional way of fault
tolerance, i.e., replication. An example of a lineage
graph of RDDs is shown in Figure 3.
Spark Streaming (Zaharia, 2012a) lets users seam-
lessly blend streaming, batch and interactive queries,
thus immediately solves the issues regarding consis-
tency and unification of streams with batch process-
ing. D-streams also allowed to use similar fault tol-
erance strategy to batch systems at low cost. We also
required low latency in our study to provide results
in real time and fault tolerance to prevent loss of any
data during large EEG analysis.
5 PARALLEL SEIZURE
DETECTION
IMPLEMENTATION
The aim is to process EEG data and perform a binary
classification of seizure and non-seizures in real time.
For real time seizure detection, we built a classifier
that both learns and classifies in real time. The sub-
sections give details about our architecture, feature se-
lection, algorithm workflow and implementation.
5.1 Tools and Architecture
In this study, we used an OpenStack (Sefraoui and
Eleuldj, 2012) based private cloud infrastructure.
OpenStack is an open source platform for managing
all of the resources in a cloud environment i.e., com-
putes, storage and networking. Using the OpenStack
dashboard, one can easily do things like launch vir-
tual machines (VMs), attach storage volumes, block
storage and object storage etc.
Figure 4: Architecture for Real time Streams.
The architecture of our application is given in Fig-
ure 4. On top of our private cluster, we used Apache
Kafka for data transfer to our Spark cluster in real
time. Apache Kafka (Kreps and Rao, 2011) is a par-
titioned, replicated and distributed message log pro-
Parallel Real Time Seizure Detection in Large EEG Data
217
cessing system. Our EEG data is available in CSV
files. Kafka producers publish EEG data as messages
to Kafka cluster, which keeps these messages. Spark
acts as a Kafka consumer and receives these data mes-
sages from Kafka cluster as data streams. Apache
Kafka allows us to divide our data into partitions and
send them to Spark workers in a distributed manner
without creating a bottleneck at Spark master.
5.2 Feature Selection
Because we process EEG data in real time and EEG
data is of non-stationary nature, it needs to be divided
into small portions. As data cannot be divided based
on the physiological activity, a common approach is
to divide data into windows of two seconds each, and
features are then extracted from each window. On the
basis of the discussion in Section III, we selected the
following features.
5.2.1 Amplitude of Top-K Values
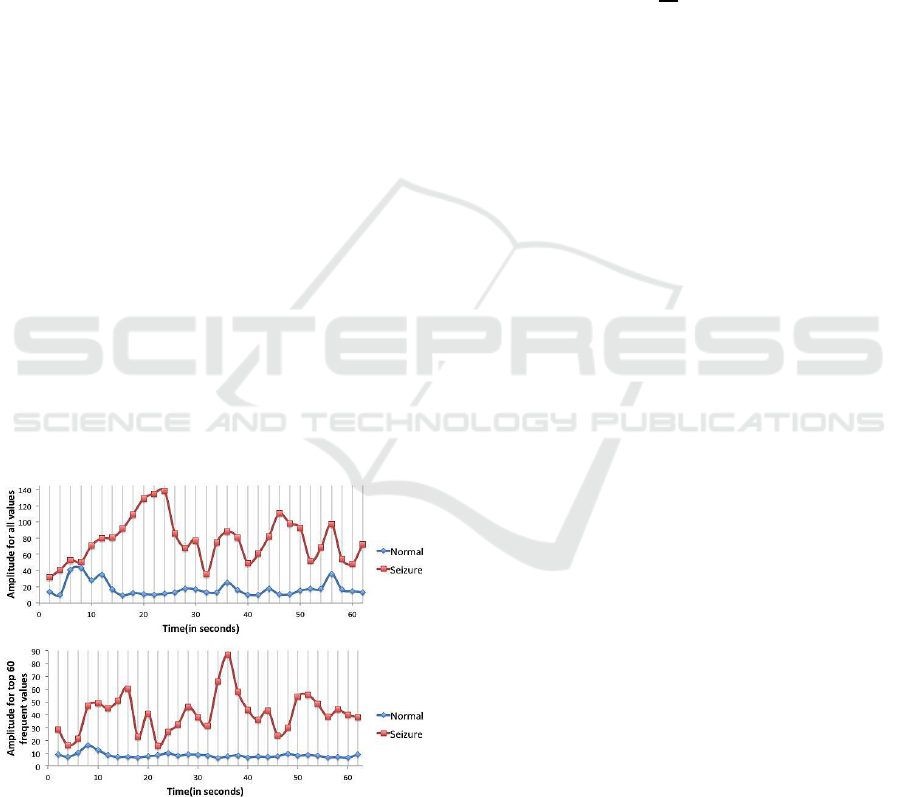
We noticed that during a seizure, the amplitude of the
signal is higher than during normal activity. Also in
earlier studies (Esteller, 2000; Litt, 2001), amplitude
measure (average amplitude of all values over a seg-
ment) has been successfully used for seizure detec-
tion. We also noticed that during non-seizure activ-
ity, most of the values appear near the rest position,
whereas during a seizure activity, values frequently
appear far away from the rest position. Therefore, we
find amplitude only for the top-k frequent values.
Figure 5: Amplitude Measure Comparison.
Figure 5 shows a comparison between amplitude
per window for all data points and amplitude of the
top 60 frequent values per window. The benefit of a
top-K amplitude measure over an amplitude measure
of all values is a smaller data size, which thus saves
time while applying further operations on the reduced
data. The smaller data size does not affect the feature
discriminating ability between normal and seizure ac-
tivity. A commonly used method for size reduction of
EEG data is “downsampling” where only every M
th
sample is kept for further processing. Downsampling
is done without taking EEG seizure activity into con-
sideration. On the contrary, we formed our method on
the basis that during seizure activity, values frequently
appear far away from the rest position. The average
top-k amplitude for a window is defined as:
Amp
top−k
=
1
M
M
∑
n=1
|x
top−k
(n)| ∗ t (1)
where M is the number of top-k values in each
window, x
top−k
(n) is the top-k values in the currently
processed window and t is the number of times each
top-k value appear in the current window.
5.2.2 Multi-window Measure
Isolated windows are good at recognizing a single
shape, but they cannot recognise a complete pattern
or evolution of a pattern from previous windows that
can be helpful in detecting seizures. Thus we use a
feature where we remember the activity from the pre-
vious windows for a particular number of windows.
As we discussed in Section III, it takes some time
for abnormal activity to evolve as a full seizure, after
which the activity can be concluded as a seizure. We
tried different numbers of windows (W) and noticed
that a smaller W gives results with low latency but
with more false positives, whereas a bigger W gives
fewer false positives, but will increase latency as well.
So we select a medium value of W=3 which gives us
a sweet spot where we get the least number of false
positives and low latency as well. This gives our al-
gorithm six seconds to recognize the seizure activity,
each window of being two seconds length each.
5.2.3 Multichannel Measure
Combining all the channels over a window gives us
the multichannel feature. There are some advan-
tages of doing this. This feature allows the algo-
rithm to identify patterns on multiple channels dur-
ing a seizure. It is common for seizures to appear on
multiple channels simultaneously, whereas there are
some artifacts that only appear on one or two chan-
nels. This property can be used to distinguish those
artifacts from the rest of EEG data. To implement this
feature, we count the number of windows that show
the seizure activity across multiple channels at a sin-
gle point of time interval.
IoTBD 2016 - International Conference on Internet of Things and Big Data
218
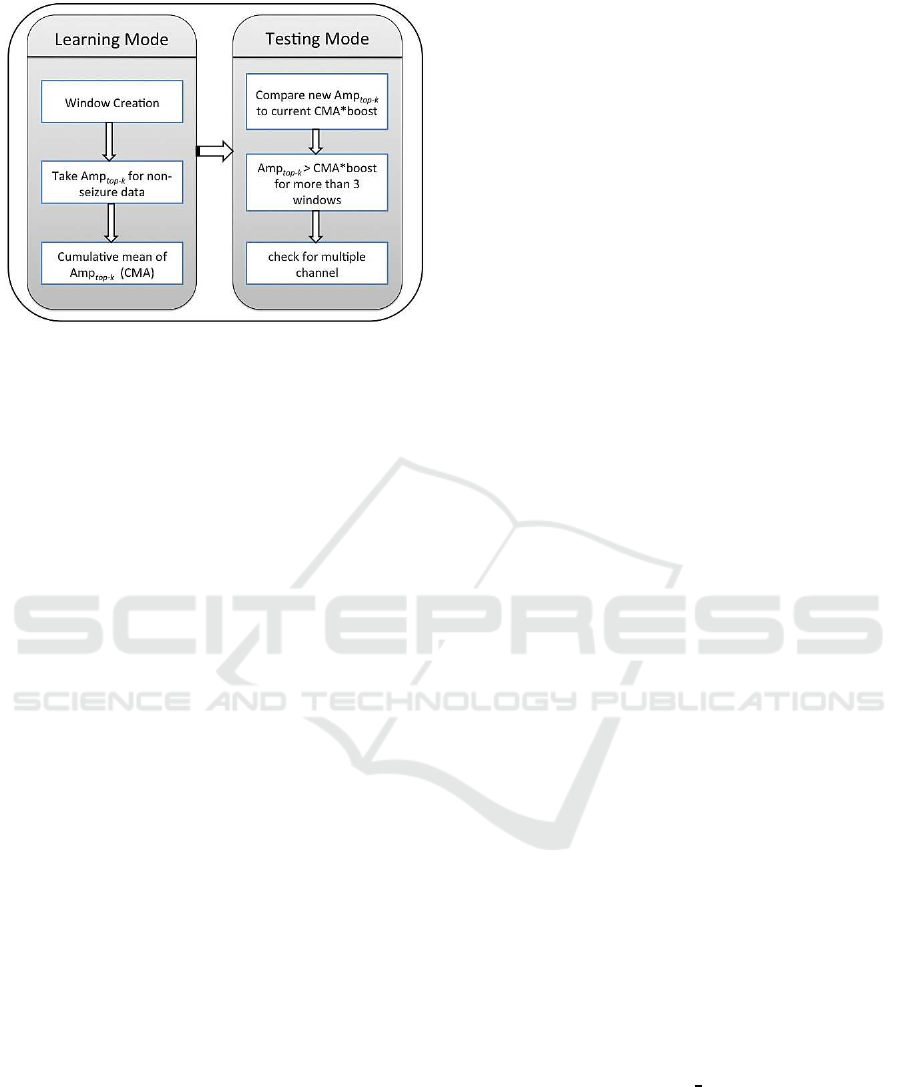
Figure 6: Workflow for lightweight Seizure Detection Al-
gorithm.
5.3 Algorithm Workflow and
Implementation
Our method is to learn a non-linearthreshold to distin-
guish epileptic seizures in EEG data. It is a two-step
process with a learning phase and a testing phase. The
algorithm structure is given in Figure 6.
Every patient will need to go once through the
learning phase. The idea behind the algorithm is
“To find abnormal, we must know what is normal”.
Figure 6 shows the steps involved in our lightweight
seizure detection algorithm. Once the Spark cluster
receives the data, it is segmented into windows. Then
we evaluate Amp
top−k
for each window for the non-
seizure activity. Then we take the cumulative mean of
Amp
top−k
(CMA) for previous windows. We found
that it is enough to process one thousand previous
windows to learn the normal pattern for CMA.
After one thousand windows, we start to test new
EEG data for seizures. We keep updating our CMA
during the test phase, unless there is a seizure ac-
tivity. By not updating CMA during seizure activ-
ity, we keep our CMA threshold unaffected. As dis-
cussed earlier, during seizure the Amp
top−k
is distant
from CMA. To enable CMA to distinguish between
seizure and non-seizure activity, we amplify CMA
by multiplying it with a parameter, boost. A large
boost value decreases the number of true positives,
whereas a small boost value increases the number of
false positives. We tried different values and selected
boost=2.7, which works well for all the patients. Any
value over CMA*boost is considered a candidate for
seizure and is filtered out in the first step. This is illus-
trated in Figure 7. In the second step, we use Multi-
window measure feature to count the number of con-
secutive windows for this property and if we have 3 or
more consecutive windows where Amp
top−k
is above
CMA*boost, those windows are considered for the fi-
nal check. In the final step, we apply the Multiple-
channel measure feature to check the appearance of
abnormal activity on multiple channels. Abnormal
activity on more than 2 channels is considered as a
true seizure activity. These steps allow us to get rid of
most of the artifacts.
Each of the steps given in Figure 6 involves one
or more Spark parallel operations. E.g., the following
code snippet illustrates the steps involved in evaluat-
ing Amp
top−k
.
//Count the number of times a value appears in
a window
val amplitudeTopK = windowedEEG
.map(x => math.abs(math.round(x._2.toDouble)))
.countByValue()
//Top 60 frequent values
.map(_.swap)
.transform( rdd => rdd.context
.makeRDD(rdd.top(60),4))
//Finding numerator and denominator
.map(x => (x._2 * x._1 , x._1 ))
.reduce((a, b) => (a._1 + b._1, a._2 + b._2))
//Amplitude of Top-K for Normal Data
.map(x => (x._1.toFloat/x._2))
Once our EEG data stream is windowed, we count
the number of times a value appears in each window
with countByValue() operation. Then we filter out
most frequent values using top(), evaluating numer-
ator and denominator by map and reduce operations
and then we find Amp
top−k
. The complete code is
available at (Ahmed, 2015).
6 EXPERIMENTS AND RESULTS
We performed experiments to evaluate the perfor-
mance of our parallel seizure detection algorithm and
implementation. These experiments evaluate two per-
formance characteristics i.e., seizure detection abil-
ity and Spark streaming performance. The experi-
ments are performed on virtual machines running on
our OpenStack based private cluster. Our cluster is
based on HP ProLiant DL165 G7, 2XAMD Opteron
6274, 64 GB ram and 32 cores per node. The virtual
machines are based on x86
64 bit architecture. One
VM is used for master and 10 for worker nodes. Each
worker node has an internal memory of 8GB and 4
cores for processing. The master node has an inter-
nal memory of 16GB and 8 cores for processing. The
master node needs extra memory for keeping meta-
data of Spark workers and HDFS datanodes. Each
node is installed with Ubuntu.
Parallel Real Time Seizure Detection in Large EEG Data
219
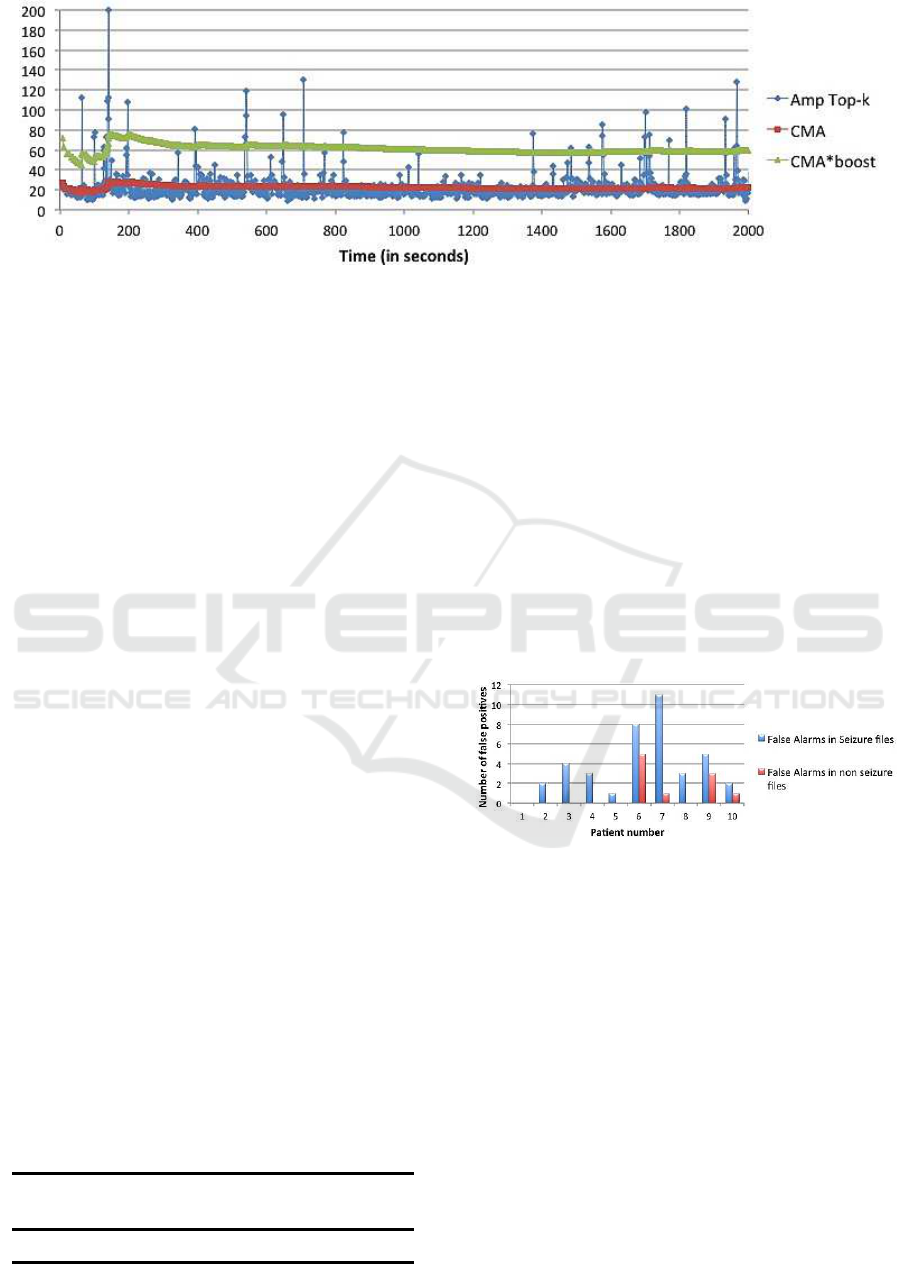
Figure 7: Amp
top−k
VS CMA*boost.
6.1 EEG Dataset
The EEG data is downloaded from freely available
CHB-MIT (chb, 2000) database. The data is avail-
able as hour-long records in European Data Format
(EDF) that we converted to CSV files for our exper-
iments. The data size of the complete dataset after
conversion was 1.44TB. EDF format is not directly
supported by Spark, although one can write a class for
EDFInputFormat (Jayapandian, 2013). Furthermore,
each 2 sec. window originally (before sampling) con-
tains 512 data points. With a total of 10 data streams,
we had 5120 data points in each window.
6.2 Seizure Detection
For evaluating the seizure detection ability, we tested
for sensitivity and specificity. Sensitivity is the per-
centage of true positives for detecting test seizures,
whereas specificity is the relative number of false pos-
itives given by the algorithm during 24 hours when
the actual seizure did not occur. The experiment was
performed for 10 patients with a total of 47 seizures
identified out by experts in the CHB-MIT dataset.
Data consisted of continuous scalp EEG recordings
during 240 hours at 256 Hz sample rate.
6.2.1 Sensitivity
Our algorithm detected 91% of the overall seizures.
Our algorithm missed some seizures that were too
short in length. E.g., for patient number 2, there were
three seizures of 1 min. 12 sec., 1 min. 11 sec. and 9
sec. long. The longer seizures of over one min. were
Table 1: Sensitivity Performance.
No. of
Patients
Actual
Seizures
Found Missed %age
10 47 43 4 91%
caught, whereas the 9 sec. seizure was missed. Ta-
ble 1 shows the overall sensitivity performance of our
algorithm.
6.2.2 Specificity
Figure 8 shows the number of false positives for each
patient. In most of the patients, the number of false
positives were almost negligible. We also saw that
most of the false alarms appeared in recordings con-
taining seizures, which suggests that our algorithm
works well and only has false positives around the ac-
tual seizures. In patient 6 and 7, we found artifacts
that appear on multiple channels that causes a higher
number of false positives in these two patients.
Figure 8: Specificity: Number of false positives.
6.3 Spark Streaming Performance
Other than seizure detection, we also performed ex-
periments to check Spark streaming performance.
6.3.1 Scaling and Latency
In this experiment, we check the scalability and la-
tency of Spark streaming. We ran experiments where
we process EEG data for a period of 20 minutes and
find the average time taken by each 2 sec. window to
process. We performed the same experiment starting
from 4 cores, increasing 4 cores at a time.
In Figure 9, we see that with 4 cores, we were pro-
cessing each window over 4 seconds. This is consid-
erable latency for a 2 sec. window. With the increas-
IoTBD 2016 - International Conference on Internet of Things and Big Data
220
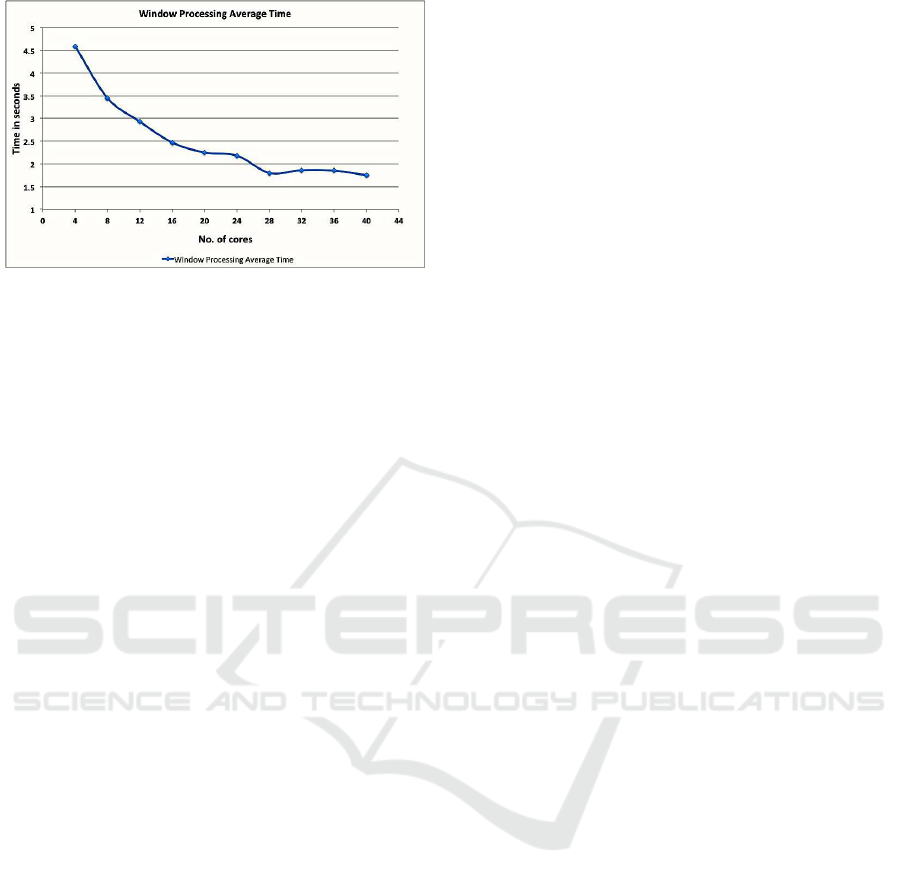
Figure 9: Scalability.
ing number of cores, the processing time decreased
almost linearly and then became constant just under 2
seconds once we reached 28 cores and we were able
to process our EEG data in real time. The experiment
shows that Spark streaming scales well for EEG data
with increasing number of cores with low latency.
Overall, Spark streaming performs well with EEG
data, but we also notice that it has some limitations,
e.g., it does not allow making windows on the basis of
input data time stamps and is only allowed on the ba-
sis of time duration that gives variable number of data
records in each window in a distributed environment.
7 CONCLUSIONS AND FUTURE
WORK
We have presented a parallel lightweight method for
epileptic seizure detection in large EEG data as real
time streams. We provided the architecture, work-
flow and Spark streaming implementation of our al-
gorithm. In an experimental scenario, our lightweight
algorithm was able to detect seizures in real time with
low latency and with good overall seizure detection
rate. Also, we have introduced a new feature, “top-k
amplitude measure” for data reduction. On the basis
of results, we believe that this method can be used
in clinics for epileptic patients. We noticed that al-
though Spark streaming scales well and produces re-
sults in real time with low latency, currently it is bet-
ter suitable for processing unstructured data and needs
improvements in providing facilities for scientific ap-
plications. Overall, we believe that Spark streaming
has potential for real time EEG analysis. In future we
might improve it for easier use for scientists, and this
study is a great first step.
REFERENCES
(2000). Chb-mit scalp eeg database. In Available at
http://physionet.org/pn6/chbmit/.
Ahmed, L. (2015). Github, inc. In
https://github.com/laeeq80/RealTimeEEG.
Bifet, A. (2013). Mining big data in real time. In Informat-
ica 37.1.
Dagum, L. and Enon., R. (1998). Openmp: an industry stan-
dard api for shared-memory programming. In Com-
putational Science & Engineering, IEEE 5.1 (1998):
46-55.
Dean, J. and Ghemawat, S. (2008). Mapreduce: simplified
data processing on large clusters. In Communications
of the ACM 51.1 (2008): 107-113.
Dutta, Haimonti, e. a. (2011). Distributed storage of large-
scale multidimensional electroencephalogram data us-
ing hadoop and hbase. In Grid and Cloud Database
Management. Springer Berlin Heidelberg, 2011. 331-
347.
Ekanayake, Jaliya, S. P. and Fox, G. (2008). Mapreduce
for data intensive scientific analyses. In IEEE Fourth
International Conference on e-science. IEEE.
Esteller, R. (2000). Detection of seizure onset in epileptic
patients from intracranial eeg signals. In Vol. 1.
Ferrarelli, Fabio, e. a. (2010). Reduced sleep spindle activ-
ity in schizophrenia patients. In The American journal
of psychiatry 164.3 (2007): 483-492.. Vol. 10. 2010.
Gropp, William, E. L. and Skjellum, A. (1999). Us-
ing mpi: portable parallel programming with the
message-passing interface. In Vol. 1. MIT press.
Hadoop (2009). Apache hadoop. In Available at
https://hadoop.apache.org.
Jayapandian, Catherine P., e. a. (2013). Cloudwave: dis-
tributed processing of big data from electrophysio-
logical recordings for epilepsy clinical research us-
ing hadoop. In AMIA Annual Symposium Proceed-
ings. Vol. 2013. American Medical Informatics Asso-
ciation.
Kang, Sol Ji, S. Y. L. and Lee, K. M. (2014). Performance
comparison of openmp, mpi, and mapreduce in prac-
tical problems. In Advances in Multimedia.
Kramer, Uri, e. a. (2011). A novel portable seizure detec-
tion alarm system: preliminary results. In Journal of
Clinical Neurophysiology 28.1 (2011): 36-38.
Kreps, Jay, N. N. and Rao, J. (2011). Kafka: A distributed
messaging system for log processing. In Proceedings
of the NetDB.
Litt, Brian, e. a. (2001). Epileptic seizures may begin hours
in advance of clinical onset: a report of five patients.
In Neuron 30.1 (2001): 51-64.
Nunez, P. L. and Srinivasan, R. (2006). Electric fields of
the brain: the neurophysics of eeg. Oxford university
press.
Qu, H. and Gotman, J. (1997). A patient-specific algo-
rithm for the detection of seizure onset in long-term
eeg monitoring: possible use as a warning device. In
Biomedical Engineering, IEEE Transactions on 44.2
(1997): 115-122. IEEE.
Parallel Real Time Seizure Detection in Large EEG Data
221

Riedner, Brady A., e. a. (2007). Sleep homeostasis and cor-
tical synchronization: Iii. a high-density eeg study of
sleep slow waves in humans. In Sleep 30.12 (2007):
1643.
Sefraoui, Omar, M. A. and Eleuldj, M. (2012). Open-
stack: toward an open-source solution for cloud com-
puting. In nternational Journal of Computer Applica-
tions 55.3 (2012): 38-42.
Shoeb, A. H. and Guttag, J. V. (2010). Application of ma-
chine learning to epileptic seizure detection. In Pro-
ceedings of the 27th International Conference on Ma-
chine Learning (ICML-10).
Shoeb, Ali, e. a. (2004). Patient-specificseizure onset detec-
tion. In Epilepsy and Behavior 5.4 (2004): 483-498.
Smith, S. J. M. (2005). Eeg in the diagnosis, classification,
and management of patients with epilepsy. In Journal
of Neurology, Neurosurgery and Psychiatry 76.suppl
2 (2005): ii2-ii7.
Stern, J. M. (2005). In Atlas of EEG patterns. Lippincott
Williams and Wilkins.
Wang, Lizhe, e. a. (2012). Parallel processing of massive
eeg data with mapreduce. In ICPADS. Vol. 2012.
Wulsin, D. F., e. a. (2011). Modeling electroencephalogra-
phy waveforms with semi-supervised deep belief nets:
fast classification and anomaly measurement. In Jour-
nal of neural engineering 8.3 (2011): 036015.
Zaharia, Matei, e. a. (2010). Spark: cluster computing with
working sets. In Proceedings of the 2nd USENIX con-
ference on Hot topics in cloud computing. Vol. 10.
2010. USENIX.
Zaharia, Matei, e. a. (2012a). Discretized streams: an ef-
ficient and fault-tolerant model for stream process-
ing on large clusters. In Proceedings of the 4th
USENIX conference on Hot Topics in Cloud comput-
ing. USENIX.
Zaharia, Matei, e. a. (2012b). Resilient distributed datasets:
A fault-tolerant abstraction for in-memory cluster
computing. In Proceedings of the 9th USENIX con-
ference on Networked Systems Design and Implemen-
tation. USENIX Association.
Zikopoulos, P. and Eaton, C. (2011). Understanding
big data: Analytics for enterprise class hadoop and
streaming data. McGraw-Hill Osborne Media.
IoTBD 2016 - International Conference on Internet of Things and Big Data
222
