
Semantic Approach for Prospectivity Analysis of Mineral Deposits
Sławomir Wójcik
1
, Taha Osman
2
and Peter Zawada
1
1
International Geoscience Services (IGS) Ltd., BGS, Keyworth, Nottingham NG12 5GG, U.K.
2
School of Science and Technology, Nottingham Trent University, Nottingham NG11 8NS, U.K.
Keywords: Geodata, Semantic Web, Geospatial Reasoning, Mineral Prospectivity Analysis.
Abstract: Early mineral exploration activities motivates innovative research into cost-effective methods for
automating the process of mineral deposits’ prospectivity analysis. At the heart that process is the
development of a knowledge base that is not only capable of consuming geodata originating from multiple
sources with different representation format and data veracity, but also provides for the reasoning
capabilities required by the prospectivity analysis. In this paper, we present an integrative semantic-driven
approach that reconciles the representation format of sourced geodata using a unifying metadata model, and
encodes the prospectivity analysis of geological knowledge both at the schemata modelling level and
through more explicit reasoning rules operating on the semantically tagged geodata. The paper provides
valuable insights into the challenges of representation, inference, and query of geospatially-tagged
geological data and analyses our initial results into the prospectivity analysis of mineral deposits.
1 INTRODUCTION
World-wide expenditure on non-ferrous mineral
exploration (gold, copper, nickel and zinc) has
varied from 14 – 20 billion USD annually for 2011 –
2012 (SNL 2015). This significant level of
expenditure is part of a mining related value chain
that can have an important impact on national and
regional jurisdictions for creating wealth and
alleviating poverty. A vital component of early stage
exploration activities is the availability of multi-
source geodata comprising geology, geophysics,
geochemistry and remote sensing from which initial
prospectivity maps are assembled. Prospectivity
maps at this initial stage represent broad and
generalised conceptualizations of the geological
conditions that may indicate areas or commodities of
interest for more detailed follow-up exploration. The
availability of this geodata from public and private
sources such as national Geological Surveys is a
significant factor in attracting the mineral
exploration sector (MINEX). However, the geodata
is rarely seamless, is discontinuous and is in multiple
representation formats involving traditional methods
of collating and analysing these data in a lengthy and
labour-intensive process by specialists. Recently, the
dramatic increase in processing capacity of current
computer systems and increasing availability of
geodata in digitised format promoted investigating
more cost-effective, computerised prospectivity
analysis. Mineral prospectivity maps can then be
produced by an automated, iterative process that is
designed to reconcile the discrepancy in geodata
representational formats, correlate the multi-source
data, and reason upon it using geological rules in
order to infer and visualise potentially prospective
regions. This approach would radically shorten
delivery time by reducing the time to perform the
analysis using traditional methods and ultimately
provide the MINEX sector with early stage
indications of prospectivity. In collaboration with
Nottingham Trent University, the International
Geoscience Services Ltd (IGS) (IGS 2015) would
like to contribute to that paradigm change by
developing a system that is able to store, model and
query different types of geological data and perform
automatic and human-assisted automatic analysis of
these data to produce various reports and maps of
prospectivity (likelihood of a given mineral being
deposited in a given area).
In this paper, we argue that Semantic Web
technologies are currently well placed to assist in
addressing the challenges of mineral prospectivity
analysis, and present an integrative approach that
exploits the capabilities of semantic technologies to
solve the data reconciliation problems by deploying
180
Wójcik, S., Osman, T. and Zawada, P.
Semantic Approach for Prospectivity Analysis of Mineral Deposits.
In Proceedings of the 2nd International Conference on Geographical Information Systems Theory, Applications and Management (GISTAM 2016), pages 180-189
ISBN: 978-989-758-188-5
Copyright
c
2016 by SCITEPRESS – Science and Technology Publications, Lda. All rights reserved

an ontology-based unifying metadata model, and
support the automation of the geospatial analysis by
encoding the relevant geological knowledge at the
ontology modelling and the semantic reasoning
levels. The paper also contributes to the
methodology of semantic-driven analysis in this
sector by highlighting various limitations hampering
the full automation of the prospectivity analysis
process such as free-form description of geological
attributes and the subjectivity in assessing some
structures.
The rest of this paper is organised as follows.
Section 2 reviews related work. The overall
architecture of our system is discussed in Section 3.
Section 4 provides insights into the workflow of the
spatial geodata management. Section 5 describes
how the domain knowledge was captured and its
translation into semantic ontologies. In section 6, we
detail how our proposed systems address the
challenges in automating mineral prospectivity
analysis. Section 7 evaluates the system
implementation. Section 8 concludes the paper and
presents our plans for further research.
2 RELATED WORK
Mineral exploration is one of the most important
topics in geology and arguably one that historically
motivated evolution of the science of geology.
While it is out of scope to describe the plethora of
prior art, there are some excellent efforts trying to
find synergy between computing principles and
methods and classical mineral exploration.
Most of currently used geology software suites
such as ArcGIS (Law and Collins 2013) or QGIS
(QGIS 2015), either have elements or modules
designed to simplify mineral prospectivity analysis
such as ones offered by GeoTools (Geosoft 2015), or
enable the processing of ancillary data for the same
purpose. Generally, one can assume that most
prospectivity analysis software packages are either
generalised cartography/GIS suites enriched with
geology-enabling modules, or large-scale/small-area
geodata management for mine development similar
to the system developed by MapTek Vulcan
(Maptek 2015). While almost all of these packages
can be used to help with mineral prospectivity
assessment of a given terrain, few offer
comprehensive, automated solutions and mostly rely
on deploying the geologists’ expertise in driving the
analysis the process using the software package as a
tool, thus contributing significantly to the investment
required at the early stages of mineral exploration.
The effort reported by Noack et al. in (Noack, et
al. 2012) is one of the few works attempting to use
advanced automatic techniques to guide the
prospectivity analysis process. Their approach uses
neural networks and statistical analysis to predict
presence of a terrain feature - existence of mineral
deposits or otherwise, as implemented in Beak
Advangeo software. This approach requires the user
to provide a set of training data that describes
describing terrain geology and measurements and
existing known mineral deposits or occurrences. For
most potential regions, such data is available,
however, most sourced geodata is incomplete and
therefore do not provide the necessary set of training
ground-truth to yield accurate analytical results.
Statistical analysis is also a black box, making it
difficult to trace and verify how certain decisions
were made.
In the recent years, fuzzy logic has been used in
geology context. Lusty in (Lusty, et al. 2009)
presents a fuzzy logic approach to assess gold
prospectivity of Irish geology and discusses controls
used to emphasise influence of different geological
features of the terrain. These controls present in their
approach parameterise the fuzzy logic analysis,
showing the need for proven targeting models that
are both flexible and transparent. Their discussion of
the results concludes the need to construct more
controllable and reliable methodologies for analysis,
where relation between the used criteria and analysis
result is more explicit and accurate.
Our investigation claims that Semantic Web
technologies can help to address some of these
limitations. The Semantic Web allows the modelling
of the taxonomy of the geological features as nodes
in a graph interconnected using object and data
relations, which describe the geological processes
that link those features as well as their interaction
with other elements in the target system such as non-
geothematic data, user profiles etc. Moreover,
semantically tagged data is inherently amenable to
reasoning that can be utilised to inform the
prospectivity analysis process based on pre-
compiled rules.
There is a significant body of work that focuses
on utilising semantic technologies to facilitate the
interpretation and sharing of geospatial data and
services. Zhang et al. in (Zhang, Zhao and Li 2010)
propose a framework for geospatial Semantic Web-
based spatial decision support system that provides
for heterogeneous ontology integration and web
services composition. Tian and Huang in (Tian and
Huang 2012) use purposely built semantic
ontologies to combine the Open Geospatial
Semantic Approach for Prospectivity Analysis of Mineral Deposits
181
Consortium (OGC) specifications with the Universal
Description, Discovery and Integration (UDDI)
standards in order to enhance the discovery of web
services compliant with OGS specifications and
promote utilising them for geospatial information
access. Janowicz et al. in (Janowicz, et al. 2010)
propose a user-transparent semantic enablement
layer for Spatial Data Infrastructure that promotes
the semantic interoperability of the OGC services
and facilitates reasoning to allow for their workflow-
based composition. These works offer a valuable
contribution towards creating frameworks enabling
the interoperation and composition of possibly
heterogeneous geospatial services and promoting
data exchange between them by means of ontology
alignments. However, the current MINEX sector
infrastructure provision, in terms of availability of
relevant geospatial services and ontology-aligned
geodata, suggests that the benefit from exploiting
these frameworks in the context of securing a
holistic cost-effective solution to mineral
prospectivity currently insignificant. It is therefore
necessary to build all the processes contributing to
our system architecture from the ground up.
3 SYSTEM ARCHITECTURE
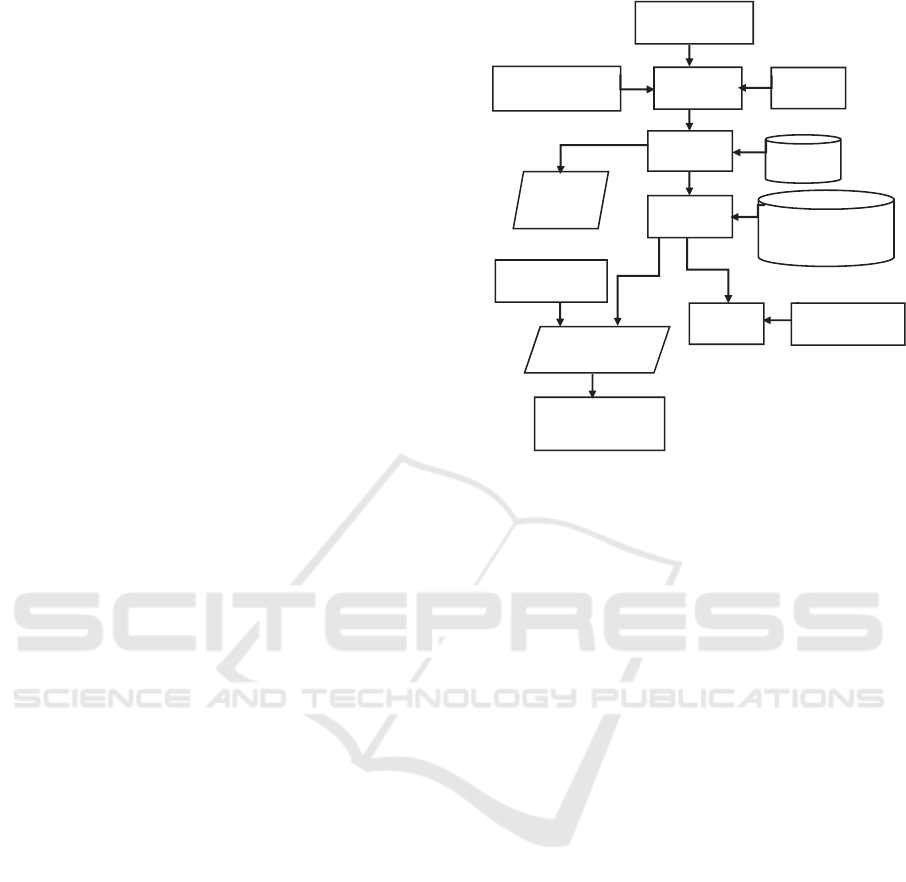
Figure 1 below presents the overall architecture of
the system and illustrates the workflow between its
essential components, which begins with geodata
gathering. After identifying regions of interest,
potential data sources in the region are identified.
Data is sourced from third party public and private
organisations.
The majority of geodata are sourced from public
sector bodies such as national geological surveys
that historically have focussed on the production of
physical, paper based products. The integration of
these many maps, by different authors using
differing taxonomies, varying quality of digitisation
has therefore made the task of producing seamless
geological maps an important goal but one that has
not been achieved by many geological surveys.
Notable exceptions are however, the relatively small
scale map compilations of the Commission for the
Geological Map of the World and One Geology.
Consequently, an important stage prior to data
upload into our system is the assessment of
publically available in terms of scale, edition,
coverage, detail and digitization quality and where
necessary a data cleaning process is employed. This
is particularly important across adjacent map sheets
where line work and taxonomies used differ.
Figure 1: IGS Geodata system workflow.
To allow for further processing using Semantic
Web technologies, data has to be converted into the
appropriate format and uploaded to a spatially
enabled linked geodata store. Data conversion and
upload is a significant element of the process, in
which GIS database items are tagged with unique
identifiers and converted to data objects that are
assigned to the appropriate ontology class
(representing the geological taxonomy) in
accordance to the annotations in the source
geospatial database. The ontology model also
incorporates a set of necessary & sufficient
conditions that facilitate further classification of
basic input geological data by reasoning, for
instance, on the rock formations’ chemical and
physical properties. Next, the resultant data and the
associated polygon information are stored in a
spatially-enabled triple store, with geometries
represented by WKT (Well Known Text) strings.
Further interpretation of the data is facilitated by
a new approach to representing geological expertise.
While core concepts of geology and immutable
relations are encoded within ontologies,
prospectivity analysis required a new framework of
reference. To facilitate that, methods of geological
analysis were encoded as generic rules that guide the
prospectivity analysis process. These rules are
compiled as geospatial queries that can be fired
against the semantic triple store to evaluate the
prospectivity for a given natural resource in a
particular region.
To store our geospatially tagged geodata in
Data collection &
metadata generation
Data curation
& conversion
Sensory data
collection & curation
Data
Archiving
Semantic data
modelling
Report
generation
Integration of non-
geothematic data
Geospatial
Triplestore
Ontology
Encoded Geology
Knowled
g
e (SPARQL)
Visualisation &
delivery to GIS env.
Sextant semantic
geodata visualiser
Prospectivity
analysis
Fuzzy Logic
confidence analysis
GISTAM 2016 - 2nd International Conference on Geographical Information Systems Theory, Applications and Management
182
semantic format, we adopted the geospatially-
enabled triple-store Strabon (Kyzirakos et al., 2013).
It provides for storing linked geospatial data and
supports spatial datatypes enabling the serialization
of geometric objects in OGC standards WKT and
GML. Strabon is built by extending the well-known
RDF store Sesame and extends Sesame’s
components to manage thematic, spatial and
temporal data that is stored in the backend
RDBMS. Strabon supports the state of the art
semantic geospatial query languages stSPARQL and
GeoSPARQL and is integrated with the Sextant
(Bereta et al., 2013) tool that allows the seamless
visualisation of the complex geospatial query results.
The described workflow comprises the
integration of semantically tagged data, advanced
classification using model-embedded inference
conditions, and prospectivity analysis using
geospatial queries, thus enabling the departure from
the classical, project-based prospecting to an
iterative, repeatable, automated process.
4 MANAGEMENT OF
GEOSPATIAL DATA
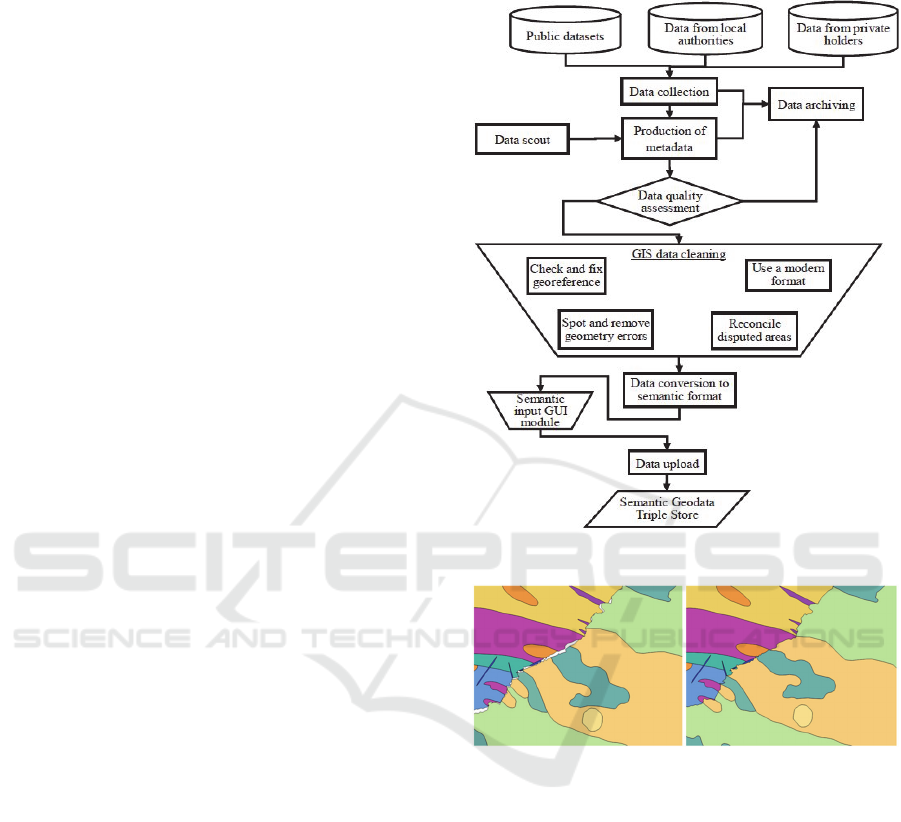
The workflow of geodata management within our
system is illustrated in Figure 2. The data is sourced
from a multitude of suppliers with varied data
representational format and quality. Disorganised
nomenclature and use of out-dated database formats
is commonplace with missing data ranges, file
compression artefacts and noise from print
preparation techniques.
Data cleaning usually comprises of checking data
georeference and fixing geometrical errors common
to manually drawn polygons. Most of the datasets
procured suffer from some geometrical errors such
as polygon intersections without vertices. In some
severe cases, map georeference might be inaccurate,
missing or done in an obscure, locally used
projection. Sometimes even whole areas might not
conform to international standards, which is the case
with disputed borders of Venezuela, where two
neighbouring countries routinely include certain
areas within their territory.
In an overwhelming majority of cases maps
produced by different authors do not accurately
follow delineations and might even disagree about
entire border shape, as presented on Figure 3. While
correcting the above is a crucial step ensuring
adequate data representation, automation of the
process is complicated, especially where
delineations do not match at all. Correcting this
accuracy has to be done manually by a data engineer
or a geologist using a GIS editing tool.
Figure 2: Geodata sourcing and clearing workflow.
Figure 3: Discontinuities between neighbouring datasets in
the Guyana Shield region before and after cleaning.
The last step in data processing is the conversion
to the appropriate Semantic Web format. The
semantic technologies present an opportunity for
data reconciliation, enrichment and provides for
more sophisticated query mechanisms. The semantic
technology also enables integration of classical
geology data with non-geothematic data such as
cadastre data, economy-related maps and locality
descriptions through unifying metadata tagging.
The bulk of data processing is being achieved
automatically, but due to variability in data
representation and presence of freeform comments
and annotations in the original GIS representation,
some manual intervention is required to complete
the data conversion process. However, to enable the
process, basic transformations of given SQL
Semantic Approach for Prospectivity Analysis of Mineral Deposits
183
columns and records to appropriate taxonomies has
to be done manually by a person familiar with
geodata being processed. This is caused by the fact
that geospatial databases do not follow same or
similar structure, language or taxonomy and the
system requires an informed person to point out
where relevant data is located and how to translate it
into appropriate system-wide taxonomy.
Unfortunately, the working case shows that
among geodata classifications encountered in one of
the test areas only less than 10% of rock name
records were recurring among more than one
dataset, with the rest being dataset-specific. While it
was projected that it might be possible to automate
taxonomy conversion, this required supervision and
creation of dictionaries to translate between native
taxonomy and those designed for the project at hand.
This needed to be done on a case by case basis for
each dataset. It is worth noting, however, that
described data curation is limited to at most a few
man-hours per dataset and can be performed by a
fairly inexperienced geologist with little training.
5 DOMAIN ANALYSIS AND
ONTOLOGY ENGINEERING
This section describes the process of knowledge
modelling for our prospectivity analysis system, and
elaborates on the specific challenges to the MINEX
sector.
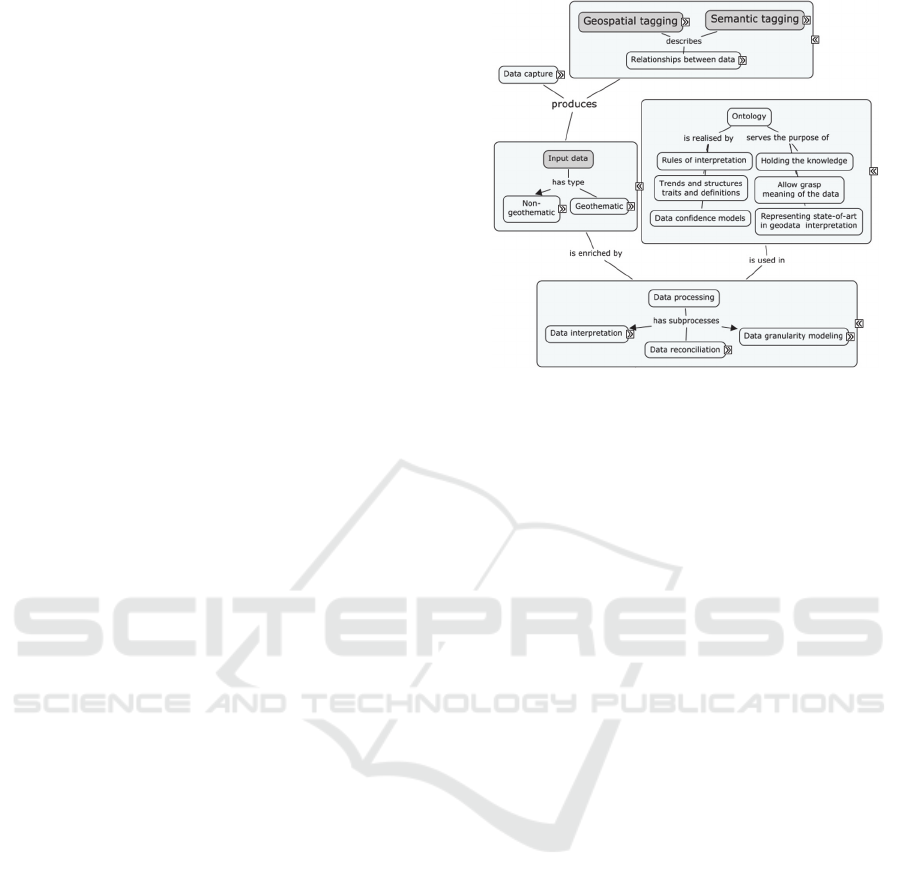
5.1 Capturing the Domain Knowledge
The domain knowledge relevant to prospectivity
analysis was compiled into a concept map that
follows intuitive conceptualisation (Osman et al.,
2013) of the proposed system integrating concepts
from the fields of geology, data processing and
visualisation. Figure 4 illustrates the segment of the
concept detaining the process of geodata analysis.
This process is split into two stages. The first is the
geodata modelling stage that is realised by the use of
ontologies and inference and uses knowledge that is
universal and applicable to any geodataset. It is
deployed using OWL ontologies to enable maximum
extensibility allowing the update of the system with
new geological concepts without invalidating
existing ones. Prospectivity analysis is implemented
at the second stage, where geospatial queries that
encode geological analytical knowledge are used to
evaluate the likelihood of mineral deposits existence
for a particular region.
Figure 4: Geodata analysis concept map.
5.2 Core Ontology Design
Our semantic modelling approach for prospectivity
analysis is implemented in two phases. The first
phase described in this section discusses the
modelling of the taxonomy structure of the MINEX
domain, while the next section details the
engineering of the necessary & sufficient conditions
driving the geological classification of new geodata
instances.
British Geological Survey with support from
Commission for the Management and Application of
Geoscience Information, IUGS and OGC has made
an excellent effort to provide a modern, complete
vocabulary of geological terms and concepts based
on XML language and called GeoSciML (Sen and
Duffy, 2005) that were compiled by Smyth and
Jondeau, members of the SEEGRID community,
into a semantic OWL Ontology (CGI Geoscience
Concept Definitions Task Group). Transparent
international standards are crucial to the
development of any innovative system and in this
case this work has been used as a basis for IGS
geodata modelling. We adopted the ontology as the
basis for modelling the taxonomy of lithological
concepts and properties in our ontology and
extended it to represent various subdomains of
geology present including various types of lithology,
geological structures, tectonics, geophysics etc.
Figure 5 below illustrates the geological
classification in our ontology where base rock type
classes are semantically annotated with semantic
object properties such as particle types and sizes,
chemical composition category or consolidation
degrees. This provides excellent opportunity to
create a unified classification of all rock properties
GISTAM 2016 - 2nd International Conference on Geographical Information Systems Theory, Applications and Management
184
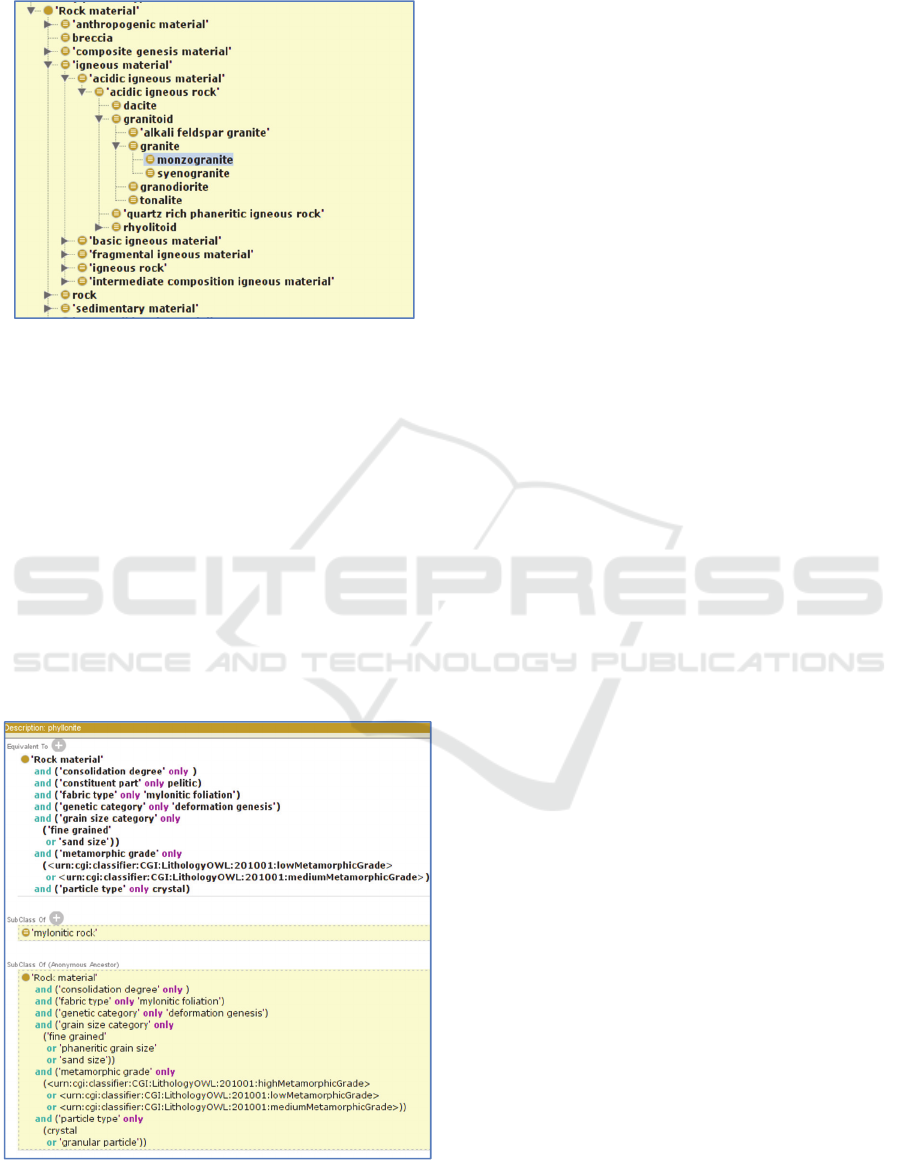
and facilitate seamless data interpretation.
Figure 5: Excerpt from IGS ontology classes.
5.3 Classification of Geological Feature
by Composite Properties Inference
The Semantic Web ontology language (OWL)
allows the definition of a set of necessary and
sufficient conditions that assert class membership.
An individual fulfilling these conditions will be
automatically ‘inferred’ as belonging to the class.
We utilise this facility of OWL in our ontology to
compile a set of necessary and sufficient conditions
that define geological features by describing their
composite properties, which in turn will
automatically infer the appropriate geological
feature for newly sourced geodata instances.
Figure 6: Phyllonite rock definition encoded as object
relations (explicit above & inferred).
Figure 6 provides an example of encoding the
geological definition (class membership) for
phyllonite by a set of necessary and sufficient
conditions that explicitly denote its exclusively
pelitic constituent parts, mylonitic foliation fabric
type, fine or sand-size grains, crystalline particle
type etc.
5.4 Challenges in Semantic Geological
Modelling
We encountered two problems with data accuracy in
the sourced geodata sets. The first is the
contradictory information input in the dataset as a
result of a mistake or misconception, which usually
stems from assessments done by authors using
unclear criteria for differentiation, such as lack of
clear distinction between similar structures or types
of rock formations. A common example is the
practice of assigning properties as freeform
comments to features that should not have them, e.g.
assigning 'majorly mud-sized grain' property to a
block of muddy sandstone, which by definition is a
sand size grained rock, with a minority of mud-sized
grains. In the project we can't use such contradictory
statement and have to decide whether to keep
assigned grain size and change rock type or keep the
rock type while assigning different grain size. This
has been delegated to a person to make an informed
decision while performing data upload step
described in the previous section.
The second source of inaccuracy is the
discrepancy between basic geology definitions used
by different map authors, especially if affiliated to
different geology institutions. One of the major
efforts in ontology design was to redesign
classifications for the purpose of overriding
otherwise subjective values found in source data
with clear and universal definitions, while
preserving the internationally accepted nomenclature
as much as it was possible. Thus, properties such as
granularity, basic chemical compositions, genetic
categories and metamorphic grades have been
defined. These properties were encoded in our
ontology as class instances (individuals) to further
categorise the classes by certain attributes. For
instance, the grain size property aided in
categorising rock types into igneous, sedimentary
and clastic. This has been resolved by creating
comprehensive grain size scales, with equivalent
(aliased) subclasses to preserve traditional
nomenclature. However, we could not use class
instances (individuals) to denote the equivalent
geological definitions as OWL classification can
Semantic Approach for Prospectivity Analysis of Mineral Deposits
185
only be based on class definitions. Therefore, we
had to create several subcategories to allow for the
mapping between the overlapping geological
definitions, which somewhat bloated the ontology as
the subcategories classes, such as grain size, hosted
only one individual at any time.
Finally, it's worth noting that geological
knowledge is not exclusively contained within maps.
Reputable data sources publish their surveys in the
form of a map (often in GIS DB format)
accompanied by head geologist memoirs, report or
commentary, sometimes even embedded into the
database itself (see Figure 7). Some of those
comments carry invaluable information about
surveyor's findings at a given locality that can enrich
the geological database. Since automatic analysis of
freeform comments that deploy natural language
processing would be difficult and expensive to
implement, such data entries are manually
transformed into taxonomy items and properties by a
geologist at the time of data input.
Figure 7: Example of typical geology data (Venezuela)
with important info encoded as a freeform comment.
6 AUTOMATING MINERAL
PROSPECTIVITY ANALYSIS
Geology is often regarded by professionals to have
an element of art to it, and the consensus is that the
geologist should drive the prospectivity analysis
process. Our objective is to shorten the delivery time
and reduce the cost of the early stages of mineral
exploration by automating the lion-share of the
process of prospectivity analysis tasks, and only
deploying geological expertise at the one-off
semantic modelling phase and in minor supervisory
role related to data curation.
The last section discussed the semantic
modelling in our system and how we hard-wired
necessary & sufficient conditions into our ontology
that automatically classifies newly sourced geodata
instances into the appropriate geological categories.
This section describes the final phase of our
prospectivity analysis system, where we encode the
relevant geological knowledge as generic rules that
guide the prospectivity analysis process. These rules
are compiled as geospatial queries that can be fired
against the semantic triple store to evaluate the
prospectivity for a given natural resource in a
particular region.
The queries combine searching for geologically
interesting map features and spatial analysis of
geometries representing these features. A set of
queries retrieves polygons, which have parameters
indicating likelihood of existence of mineral
deposits at a given location, such as favourable rock
type, appropriate age or evidence of geological
processes necessary for mineralisation event. The
results of those queries are subjected to spatial
analysis, which transform retrieved geometries into
more appropriate format using operations of unions
and intersections as designed in the geological rules.
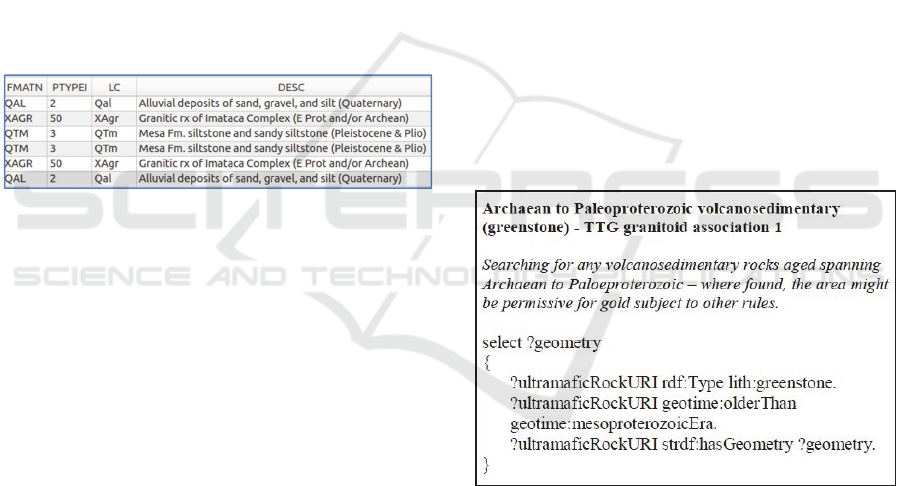
The geological rules were encoded as natural
language statements using intuitive geological
terminology. An example of encoding such a
statement can be seen on Figure 8. Mnemonic form
(in bold) of a geological rule used in the process of
gold prospectivity analysis is followed by its verbose
phrasing (in italics), explaining in detail what
geological features are being searched. An
stSPARQL expression of the same meaning is
presented below.
Figure 8: Example of typical geology data (Venezuela)
with important info encoded as a freeform comment.
It is noteworthy to mention that due to rock
formations following trends beneath the visible rock
outcrops that may not be evident from the data,
prospectivity of a certain buffer area around
geological features is affected. Even when one can
corroborate geophysical information to discover
those trends, geological processes are not always
limited to the volume of rock in question; contrarily,
mineralisation may occur away from the source
material. The range of this processes is very hard to
estimate and in certain cases has be performed
GISTAM 2016 - 2nd International Conference on Geographical Information Systems Theory, Applications and Management
186

empirically, but there are already methods of
establishing optimal spatial parameters in other
works. In a similar fashion, one has to recognise the
need for additional parameters - weight values for
establishing finer control of the influence of various
queries over the analysis or logical ones, to compile
a number of queries' results into one coherent result.
Thus, a number of adjustable parameters are present
in the system, increasing its flexibility, but also
requiring careful consideration at the analysis design
process.
One of the challenges encountered when
designing the system architecture was to decide
which elements of the analytical process should be
modelled into the ontology and which should be
implemented by means of explicit reasoning. The
decision is made on a case-by-case basis, with
arguments both for and against each of the
implementation methods. The main focus of the
design was to reduce the effort required to extend
and modify the system to incorporate additional
features such as new deposit models or use of data
of new types. Hence, wherever possible, we encoded
directly into the ontology model all the ‘universal
and immutable’ knowledge related to the
classification of newly sourced geodata instances
into geological categories, and only resorted to
explicit reasoning for the final stage of encoding the
rules evaluating the mineral prospectivity. Hence,
surficial and below-surficial features were hard-
wired into the semantic ontology, while the rules
encoded as geospatial queries focused on geological
processes of local range and objective approach to
geological analysis. This helped to decouple the
geodata processing from the analysis process thus
reducing the workload for designing and encoding
new rules and promoting their usability.
The identification and interpretation of
geological features on a map by a geologist is a
highly assimilative, cognitive and nuanced process.
It requires the experience, often collective of
integrating a sequence of features such as the spatial
distribution of strata at the surface, which can be
extrapolated to depth (3D visualization skills), age
relationships (relative and absolute) of adjacent and
intersecting features and many other components,
which are set within the constraints of a larger or
macro geological context. The above process is one
that is not easily replicated by current computing
methodologies. A good example is the definition of
a basin, which is a large geological depression, a
result of tectonic warping. Most of the common
features of basins - such as hipsometric depression,
normal younging of the strata and presence of
sedimentary material is found not only in basins but
also in other geological structures such as some
craters or some glacier valleys. To further
complicate the issue, detecting basins automatically
using stSPARQL geospatial queries would require
the queries to contain large amount of incidental
geological knowledge, specific to a given location.
For example, some basins can be detected by careful
spatial analysis of 3D model of topology, and rock
strata formation to distinguish them from impact
craters. However, some are filled with sediment due
to their age and don't show on the terrain model,
while other might have underwent geothermal
processes that disrupt original rock layers - both of
which are quite easy to spot by a geologist while
remaining hard to encode. Recognising that
removing false negatives and positives would be
laborious and require a geologist to perform a
supervisory role despite automation, the task of
recognising basins and other similar terrain features
has been delegated to a geologist during the data
input process (Figure 2), to manually add
appropriate taxonomy items.
7 SYSTEM EVALUATION
Geology knowledge is encoded into an ontology
data model and rule-driven prospectivity analysis
process. This required significant amount of
preparatory work by an experienced exploration
geologist in cooperation with a semantic technology
specialist to transform his knowledge into a
machine-readable form. The main advantage of the
system is capability to house an extraordinary
amount of geology knowledge, which is
automatically applied to a large set of geodata, from
which value-added analytical products can be
generated and delivered and updated as needed.
The above is accomplished without sacrificing
the transparency of the process, as explicitly
represented queries and ontologies are human-
readable and their outcomes can be backtracked. The
mutable parameters and separation between geology
model and prospectivity analysis allows for their
seamless modification and extension, which gives
our approach an advantage over statistical and
machine learning approaches, access to the
intricacies of the analytical process is difficult.
Data enrichment is evidenced by the increasing
number of relations in the system. For the test
dataset close to 8000 triples have been present at the
beginning of the process, while after applying the
geological model, that number increased to over
Semantic Approach for Prospectivity Analysis of Mineral Deposits
187
60000. From that data prospectivity maps for 30
different types of deposits can be produced, each
using a combination of 10-20 purpose-designed
stSPARQL queries. The result of combinations of
those queries is a set of polygons, delineating areas
of similar prospectivity rating. These polygons then
are stored within the geospatial database and
accessed by Sextant data visualiser seamlessly and
without the need of format conversion. Thus, one is
able to quickly produce a custom map compilation,
by compiling polygons straight from geospatial
database in desired combination.
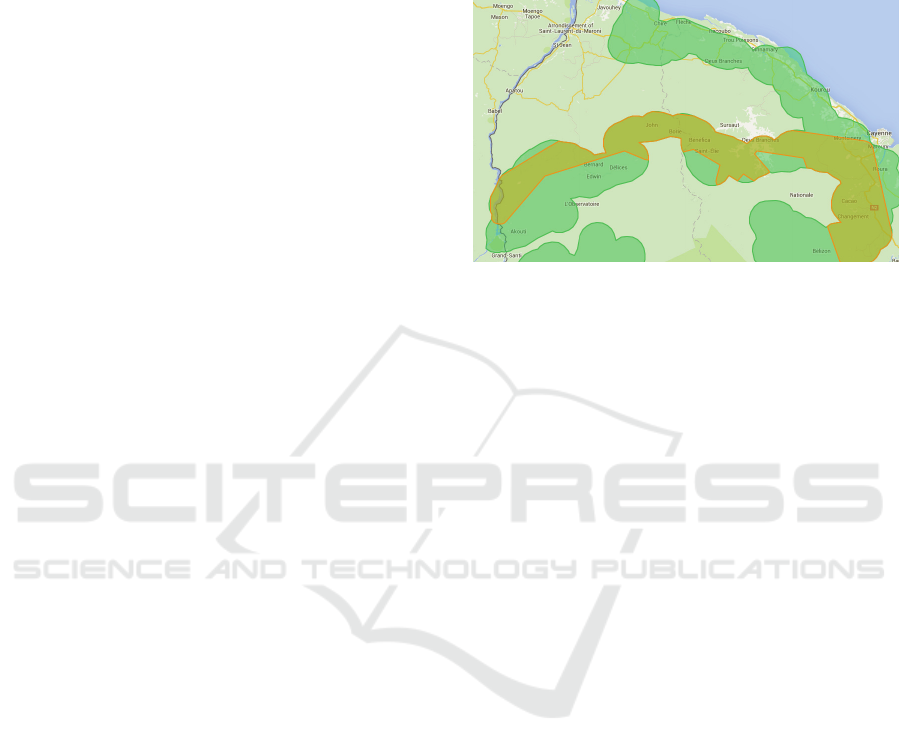
Generating a prospectivity map in a visual form
is the goal of the analysis process. As shown on
Figure 9, delineation of different grades of
prospectivity for minerals over Google Maps
background enables approachable presentation,
which can be inspected even in image format. By
delivering it in an accessible form, effects of the
analysis can be included in a decision making
process, even without specialised knowledge or
tools.
While semantic technologies have been very
useful in modelling geology, some of the data types
proved to be difficult to describe, especially those
that in classical prospectivity analysis need to be
heavily modified and carefully examined by an
expert geologist, such as raster-based geophysical
measurements. Automation of geophysical analysis
is often hampered by the fact that very similar
patterns can be a result of a great number of
different subsurface features. With the exception of
dykes, recognising most subsurface rock bodies or
structures relies on geophysicist’s experience and
judgment and while automation of the delineation
process is currently implemented, it is still a
significant challenge to classify the delineated
structures. Since the automation of geophysical
analysis is a computationally intensive process using
advanced algorithms, it was impractical to
incorporate it fully and geophysics role has been
relegated to data validation and extrapolation. There
are plans to revisit this issue in the future.
One of the projected benefits of the project was
to be able to add more data without the need of re-
applying the analysis. This is only achieved for the
modelling stage, but not the querying stage. Because
of efficiency limitations of Sextant visualiser, very
complicated queries have to be run and their results
cached in advance. These caches need to be updated
each time new data is being added to the system,
which in practice happens infrequently, but poses an
additional difficulty. This inefficiency issue is not
present in Strabon triple store, so a different
visualiser might be able to perform all queries on
demand. The system is not required to provide real-
time response, and current processing times of under
a minute to perform modelling and 3 minutes per
deposit type are acceptable.
Figure 9: Polygons denoting prospectivity for orogenic
gold visualised over a map of northern French Guiana.
8 CONCLUSIONS AND FUTURE
WORK
Motivated by the need for more cost-effective
approach to prospectivity analysis, we presented
new semantic-driven integrative approach to
prospectivity analysis. Our approach initially
deploys an ontology-based unifying metadata model
to reconcile the discrepancy the representational
format of geodata that is sourced from multiple
private and public suppliers often with disorganised
nomenclature and non-digitised freeform text
describing geological features that are critical to the
analysis process. Our approach then uniquely utilises
semantic modelling to support the automation of the
prospectivity analysis by encoding the relevant
geological knowledge at the ontology modelling and
the semantic reasoning levels. At the semantic
modelling level, we hard-wired necessary &
sufficient conditions into our ontology to
automatically classify newly sourced geodata
instances into the appropriate geological categories,
and at the explicit reasoning level we encode the
relevant geological knowledge as generic rules that
guide the prospectivity analysis process. These rules
are compiled as geospatial queries that can be fired
against the semantic triple store to evaluate the
prospectivity for a given natural resource in a
particular region. We endeavour to strike the balance
between the elements of the analytical process
encoded at each level in order to decouple the
geodata processing activity from the prospectivity
GISTAM 2016 - 2nd International Conference on Geographical Information Systems Theory, Applications and Management
188

analysis process, thus reducing the workload for
designing and encoding new prospectivity rules and
promoting their seamless extensibility.
The reported work in this paper also contributes
to the methodology of utilising semantic
technologies for mineral prospectivity analysis by
investigating the practical constraints hindering the
complete automation of the prospectivity analysis
process. Such limitations include the misleading
assignment of properties as freeform comments to
features in the sources geodata, the complexity in
modelling geophysical measurements, and the
limitation of the visualisation tool in caching the
geospatial query results.
Our plans for future research involve the curation
and processing of sensory raster data that comprises
geophysical measurements, various types of imaging
and LIDAR data. We are optimistic this will further
improve the accuracy of our prospectivity analysis
model. We also intend to investigate the use of fuzzy
logic to model the certainty in the perceived
accuracy of the prospectivity analysis as a function
of quality and completeness of the sourced geodata.
ACKNOWLEDGEMENTS
This research was partially supported by Innovate
UK through a Knowledge Transfer Partnership
funding (KTP009221).
REFERENCES
Bereta, K., Nikolaou, C., Karpathiotakis, M., Kyzirakos,
K. and Koubarakis, M., 2013. SexTant: Visualizing
Time-Evolving Linked Geospatial Data. In:
International Semantic Web Conference (Posters &
Demos), pp. 177-180.
CGI Geoscience Concept Definitions Task Group, OWL
Ontology for Lithology [online]. . Available at:
https://www.seegrid.csiro.au/wiki/CGIModel/Concept
DefinitionsTG#OWL_Ontology_for_Lithology
[Accessed 12,09 2015].
Geosoft, 2015. ArcGIS Extensions, Mapping Software for
ArcGIS [online]. Available at: http://www.geosoft.
com/products/arcgis-extensions/overview [Accessed
12/09 2015].
IGS, 2015. International Geoscience Services (IGS) Ltd
[online]. Available at: http://www.igsint.com/
[Accessed 12/09 2015].
Janowicz, K., Schade, S., Bröring, A., Keßler, C., Maué,
P. and Stasch, C., 2010. Semantic Enablement for
Spatial Data Infrastructures. Transactions in GIS, 14
(2), 111-129.
Kyzirakos, K., Karpathiotakis, M., Bereta, K., Garbis, G.,
Nikolaou, C., Smeros, P., Giannakopoulou, S.,
Dogani, K. and Koubarakis, M., 2013. The
spatiotemporal RDF store strabon. In: The
spatiotemporal RDF store strabon. Advances in Spatial
and Temporal Databases. Springer, 2013, pp. 496-
500.
Law, M., and Collins, A., 2013. Getting to know ArcGIS
for desktop. Esri Press.
Lusty, P., Gunn, A., McDonnell, P., Chacksfield, B.,
Cooper, M. and Earls, G., 2009. Gold potential of the
Dalradian rocks of north-west Northern Ireland:
prospectivity analysis using Tellus data. Applied Earth
Science: Transactions of the Institutions of Mining and
Metallurgy: Section B, 118 (3-4), 162-177.
Maptek, 2015. Mine Planning Solutions [online]. .
Available at: http://www.maptek.com/solutions/
mine_planning.html [Accessed 12/09 2015].
Noack, S., Barth, A., Irkhin, A., Bennewitz, E. and
Schmidt, F., 2012. Spatial modeling of natural
phenomena and events with Artificial Neural
Networks and GIS. International Journal of Applied
Geospatial Research (IJAGR), 3 (1), 1-20.
Osman, T., Rmaswamy, S., Mahmoud, S. and Saeed, M.,
2013. Utilising semantic technologies for decision
support in dementia care. In: Computer Modelling and
Simulation (UKSim), 2013 UKSim 15th International
Conference on, IEEE, pp. 628-633.
QGIS, 2015. Open Source Geographic Information System
[online]. . Available at: http://www.qgis.org/
[Accessed 12/09 2015].
Sen, M., and Duffy, T., 2005. GeoSciML: development of
a generic geoscience markup language. Computers &
Geosciences, 31 (9), 1095-1103.
SNL, 2015. Expert Mining Research [online]. . Available
at:
http://www.snl.com/Sectors/MetalsMining/ExpertMini
ngResearch.aspx [Accessed 12/09 2105].
Tian, Y., and Huang, M., 2012. Enhance discovery and
retrieval of geospatial data using SOA and Semantic
Web technologies. Expert Systems with Applications;
Expert Syst.Appl., 39 (16), 12522-12535.
Zhang, C.R., Zhao, T. and Li, W., 2010. The framework of
a geospatial semantic web-based spatial decision
support system for Digital Earth. International Journal
of Digital Earth; Int.J.Digit.Earth, 3 (2), 111-134.
Semantic Approach for Prospectivity Analysis of Mineral Deposits
189
