
Optimized Cold Storage Energy Management
Miami and Los Angeles Case Study
Sebastian Thiem
1,2
, Alexander Born
1
, Vladimir Danov
1
, Jochen Schäfer
1
and Thomas Hamacher
2
1
Corporate Technology, Siemens AG, Günther-Scharowsky-Str. 1, Erlangen, Germany
2
Institute for Renewable and Sustainable Energy Systems, Technische Universität München, Munich, Germany
Keywords: Multi Modal Energy Systems, Smart Grid, Cold Thermal Energy Storage, Ice Storage, Chilled Water
Storage, Energy Management, Dynamic Programming, Optimal Control.
Abstract: Smart management of cold thermal energy storages could help future sustainable energy systems drawing
large shares of electricity from renewable sources to balance fluctuating generation. This paper introduces a
model-based predictive control strategy for cold thermal energy storages. A novel ice storage model for
simulating and optimizing partial charge and discharge storage operation is developed and validated. The
optimization problem is solved using a Forward Dynamic Programming approach. A case study analysis for
a very hot and humid location (Miami) and a rather temperate climate (Los Angeles) and for each four
building types (apartment building, hospital, office, and school) reveals that total cost savings of up to 20%
compared to conventional control strategies are possible.
1 INTRODUCTION
Increased electricity generation from renewable
energy sources requires storage solutions or
enhanced flexibility of the demand side to handle
fluctuating supply (U.S. Energy Information
Administration, 2015). Smart management of
cooling loads, accounting for 15% of primary energy
use in United States buildings in 2010, may help
improving economics and stability of future
sustainable energy systems utilizing large shares of
solar or wind energy (Johansson et al., 2012; Zhang
and Lu, 2013). The climate change may even further
increase both cooling energy demand and peak loads
in the 21
st
century (Wang and Chen, 2014).
Power-to-cold solutions utilizing cold thermal
energy storages (CTES) can decouple the electric
load from the cooling demand and are economically
very attractive due to small capital expenditures,
especially compared to electrochemical storages
(Claessen and Poutré, 2014). For improving
operating expenses (OPEX), control of these
systems is of major importance. Model-based
predictive controls (MPC) aiming to minimize
OPEX require accurate but runtime-efficient models.
A near-optimal control strategy for ice thermal
energy storages (ITES) operation was introduced by
Braun (2011). Henze et al. (1997) developed a
predictive optimal controller for a cooling system
with ITES using a Reverse Dynamic Programming
(RDP) approach. Other researchers examined
different algorithms for the optimization problem,
such as a particle swarm algorithm (Lee et al.,
2009), or tested the model-based predictive
controller at a university cooling system including a
chilled water storage (CWS) (Ma et al., 2012).
Previous research on cost-optimal control of
cooling systems with thermal energy storage is
lacking simulation with accurate storage models.
Furthermore, there is still a need of development of
optimal control algorithms based on annual case
studies examinations. Thus, this paper contributes to
the the development of
a novel model for partial charge and discharge
of ice thermal energy storages;
an optimal control strategy based on Forward
Dynamic Programming (FDP) incorporating
final costs;
a full year case study for four building types in
two American cities: Miami and Los Angeles.
Therefore, the paper is separated into three
sections. First, the experimental setup will be
explained and the model will be described briefly.
Then, the optimization problem and its solution
approach will be outlined. Finally, the case study
Thiem, S., Born, A., Danov, V., Schäfer, J. and Hamacher, T.
Optimized Cold Storage Energy Management - Miami and Los Angeles Case Study.
In Proceedings of the 5th International Conference on Smart Cities and Green ICT Systems (SMARTGREENS 2016), pages 271-278
ISBN: 978-989-758-184-7
Copyright
c
2016 by SCITEPRESS – Science and Technology Publications, Lda. All rights reserved
271
will quantify advantages from using an optimal
control approach.
2 EXPERIMENTAL SETUP
The cooling system investigated for this paper
consists of a two-stage compression chiller and
appropriate condenser-side dry air-cooled heat
exchanger (cooling fans). An ice thermal energy
storage (ITES) manufactured by Fafco is used as
cold thermal energy storage (CTES), as highlighted
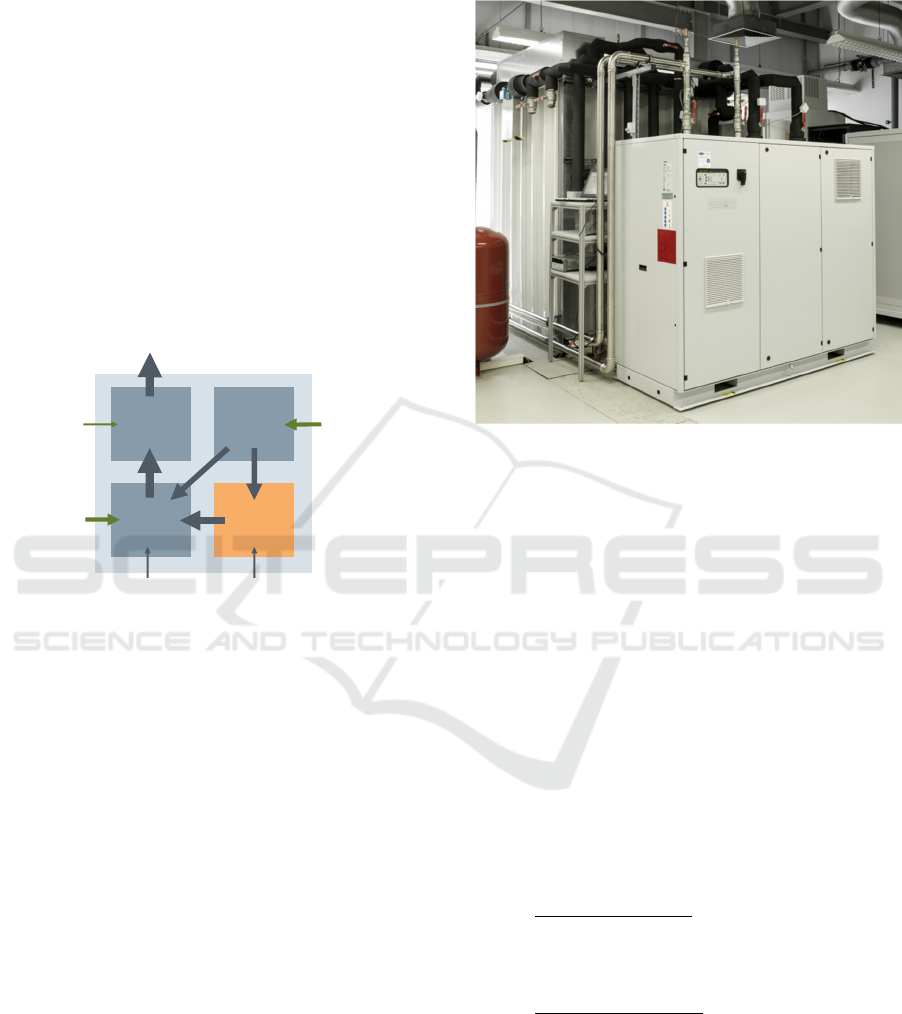
in the schematic in Figure 1. Building cooling loads
are simulated by electric heaters that can dump heat
into the ice storage or transfer heat to the evaporator
side of the chiller.
Figure 1: Schematic representation of the cold thermal
energy storage (CTES) experimental setup, including
electricity and heat flows.
To derive accurate models of the entire cooling
system, several sets of experiments were run:
14 complete charge and discharge cycles;
Four experiments with simultaneous operation
of chiller and heaters;
Six partial charge and discharge cycles.
Heat flow rates are computed from measured
temperatures and mass flow rates. The ITES state of
charge is determined in two different ways. By an
estimation of the initial state of charge and integral
balancing of the measured heat flow rates, is
determined. Due to the difference in density of water
and ice, freezing of water and melting of ice result in
a change of volume within the storage (at constant
mass). This is detected with a float sensor and
denoted as volumetric state of charge (
).
Variations in density from sensible cooling or
heating of water and ice are also measured by the
float sensor. However, since these changes are small
compared to the density change induced by the
phase change,
hardly includes any effects
from sensible cooling or heating.
The system under test is illustrated in Figure 2.
Figure 2: Compression chiller and ice storage system
under test.
3 MODEL
The model developed for this research is based upon
a previously published model of an ice storage
supported cooling system (Thiem et al., 2015). The
whole cooling system model consists of several
submodels. Whereas chiller, cooling fans, and heater
can be modelled with well-known relations from
literature (Lee et al., 2012), modelling of the ITES is
more challenging due to its large inertia and several
nonlinear characteristics depending on its current
state.
The previously published model of the ice
storage is mainly based on two quantities, the heat
exchanger effectiveness ()
ITES,in
ITES,out
ITES,in
PCM
,
,
(1)
and the charge/discharge effectiveness ()
ITES,eff
ITES,HTF
ITES,gain
exp
.
(2)
In these equations
ITES,in
and
ITES,out
denote the
in- and outlet temperature, respectively;
PCM
the
phase change temperature of the medium inside the
storage (0 °C for water);
ITES,HTF
the heat flow rate
transferred by the heat transfer fluid (HTF) pumped
Cooling
Fans
Chiller
Load
CTES
Heat gain
Released heat
Electrical
energy
input
Electrical
energy input
for heater
SMARTGREENS 2016 - 5th International Conference on Smart Cities and Green ICT Systems
272
through the storage heat exchanger tubes,
ITES,gain
the heat gained from ambience; and
ITES,eff
the
effective heat transfer rate related to a change in
volumetric state of charge (
).
With these quantities, outlet temperature and
next time step both real and volumetric state of
charge can be computed. The efficiency of the
chiller depends on its evaporation temperature,
which itself depends on the current thermal
resistance of the ice layers surrounding the pipes in
the storage. Commonly and are fitted as a
function of the volumetric state of charge (
).
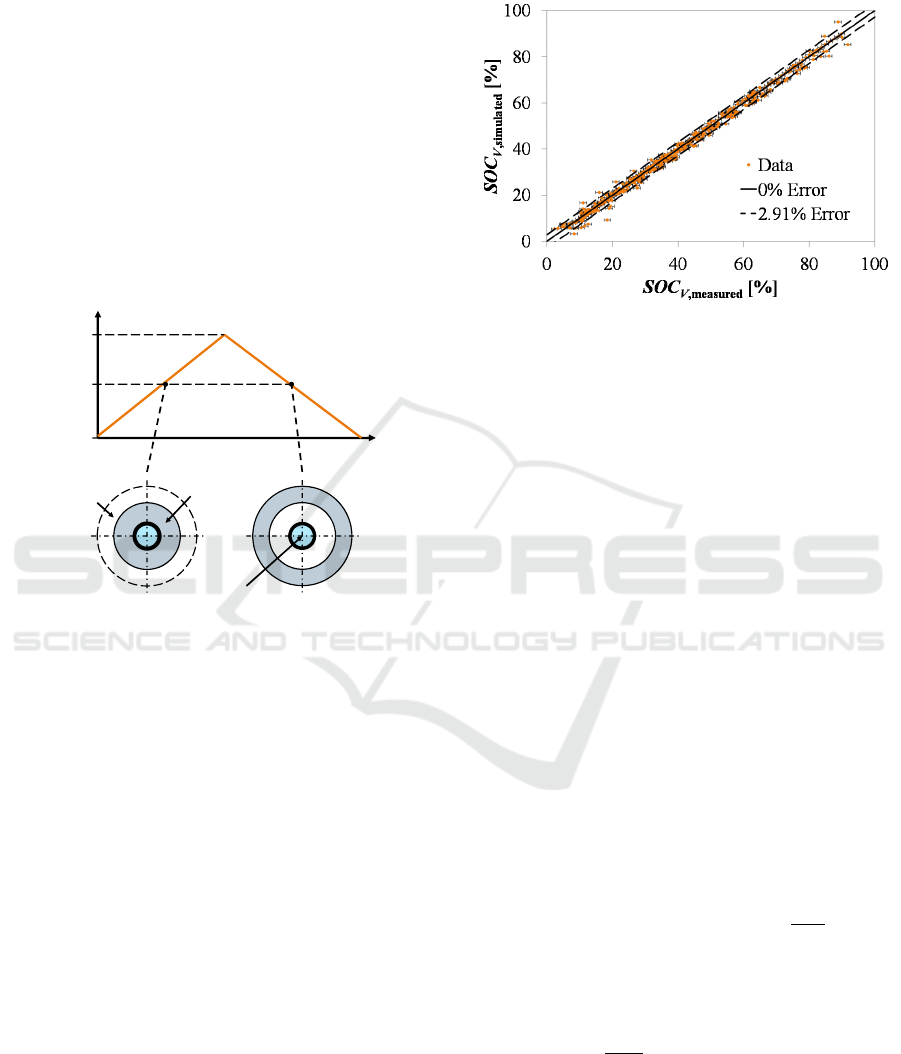
is less reliable due to the integration of
uncertainties in measured heat flow rates.
Figure 3: Misleading scalar quantity state of charge
(SOC): Complete charge-discharge cycle.
As highlighted in Figure 3, for complete charge
and discharge cycles, distinct layers of water and ice
form around the HTF tubes, respectively. Two
separate fits for ice storage charge and discharge can
be determined. The previous modelling approach
based on a fit of
is sufficient. However, for
partial charge and discharge cycles, i.e. storage
operation that does not charge or discharge the
storage completely, the model needs to account for
previous operation of the ice storage. Therefore,
and are determined as function of a newly
introduced relative state of charge (
,rel
).
,rel
comprises information on previous
maximum partial charge and discharge to model
layers of water and ice that build up around the tubes
in reality. More details on this approach can be
found in Born (2015).
The accuracy of this updated modelling approach
is shown in Figure 4. In this figure, a parity plot of
the volumetric state of charge shows that 90% of
simulated data of all experimental sets (see
Section 2) are within a 2.91% error margin.
Figure 4: Volumetric state of charge (
) parity plot for
the modified -model.
In addition to the introduced ITES model, a
stratified chilled water storage (CWS) model is
taken from literature (Wilden and Truman, 1985).
4 OPTIMIZATION PROBLEM
An optimal control problem is formulated based on
the models that were briefly introduced in the
previous section. The objective of the optimal
control strategy is to minimize operating expenses
() for a fixed-design cooling system. The objective
function is given by
el,e
el,d
s
u
fin
,
(3)
with the electricity energy charge (
el,e
),
electricity demand charge (
el,d
), compressor start-
up costs (
su
), and final costs for each period (
fin
):
el,e
el,
el,e
d
̃
∆
,
(4)
el,d
max
el,
,
el,max,0
el,d
∆
∆
,
(5)
su
su,
,
(6)
fin
̅
el,e
CTES,cap
∆
.
(7)
In Equations 4-7
el,
denotes the electric power
drawn by component ; the number of
components;
el,e
the electricity energy charge;
el,d
the electricity demand charge;
su,
start-up costs
SOC [%]
Time
100
0
50
Ice
Water
Heat transfer
Fluid (HTF)
Optimized Cold Storage Energy Management - Miami and Los Angeles Case Study
273
and
the number of start-ups for compressor ;
the number of compressors; the energy
efficiency ratio of the chiller;
CTES,cap
the storage
capacity; and ∆
the change of state of charge
during period . The time interval of the current
period is tagged as ∆
, ∆
is the length of the
month.
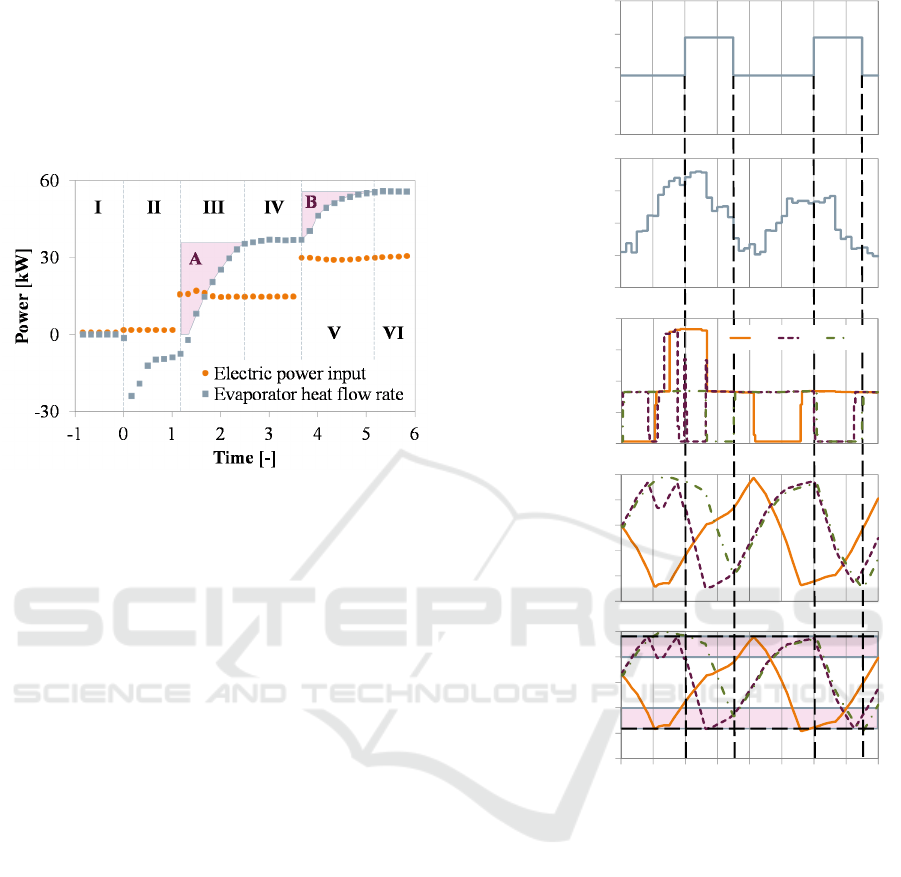
Figure 5: Approximation of compressor start-up costs.
Computation of start-up costs of the two
compressors under test is shown in Figure 5. In this
figure, electric power input and evaporator heat flow
rate during a typical chiller start-up are plotted
versus time. In Phase I, the chiller is turned off. In
Phase II chilled water pumps are on, the heat flow
rate shows an artefact from the previous hot water
discharge. The first compressor starts in Phase III,
heat transfer at the evaporator lacks the electric
power drawn (Area A). In Phase IV the first
compressor runs steady-state. The second
compressor starts in Phase V, and once again
evaporator heat transfer is delayed (Area B). In the
final Phase VI the compression chiller is running
steady-state. The highlighted Areas A and B are
directly related to the start-up costs of the two
compressors by computing the energy charge for the
electric power wasted until steady-state cooling
output is established. This is a very conservative
approach that does not include any lifetime
degradation effects during start-ups.
The introduction of final costs (
fin
) in the
objective function is necessary to avoid complete
discharge of the storage at the end of period . For
that reason low final states of charge are penalized
and high final states of charge awarded.
The optimal chiller operating strategy ()
describes when and how to operate the chiller. It is
determined by solving
argmin
.
(8)
Figure 6: SOC-controlled (SC), Price-controlled (PC), and
Optimal-controlled (OC) strategy for an example period of
48 hours: a) Electricity energy charge, b) Cooling load, c)
Compression chiller electric power input, d) Volumetric
state of charge (
), and e) State of charge ().
The presented optimization problem is mixed-
integer, non-linear (MINLP) with costs introduced
on maximum load (demand charges), and costs
inserted between time steps (start-up costs). A
Dynamic Programming algorithm can reduce the
problem complexity to solve it within a reasonable
amount of time (Bellman, 2003). For this, the
problem is discretised not only in time (∆
15min), but also in state-of-charge (∆0.5%).
Because the ITES model requires information on the
preceding operating strategy, a Reverse Dynamic
Programming (RDP) approach is not feasible. Thus,
0
20
40
60
80
100
0 6 12 18 24 30 36 42 48
SOC
[%]
Time [h]
a)
b)
c)
d)
e)
0
2
4
6
8
Energy
charge
[ct/
kWh
el
]
0
10
20
30
40
Load
[kW
th
]
0
20
40
60
80
100
SOC
V
[%]
0
10
20
30
40
Electric
power
[kW
el
]
SC PC OC
SMARTGREENS 2016 - 5th International Conference on Smart Cities and Green ICT Systems
274

a Forward Dynamic Programming (FDP) algorithm
is implemented. With this algorithm, a 24 hour
period is solved in approximately 50 seconds.
The optimal control (OC) strategy is compared to
two conventional, reference strategies: SOC-
controlled (SC), and price-controlled (PC) operation.
The SOC-controlled strategy is simulated based on
the following criteria:
Turn chiller on, if 25%;
And turn chiller off, if 95%.
The price-controlled strategy is determined in the
following way:
Turn chiller on, if
el,e
̅
el,e
;
Turn chiller off, if
el,e
̅
el,e
;
Turn chiller on, if 25% and keep on
until 40%;
And turn chiller off, if 95%, and keep
off until 80%.
To avoid over-depletion of the storage in SC and
PC operation, the second compressor is started, if
the chiller is on but not able to satisfy the cooling
load (which would additionally require the discharge
of the storage).
Results for all three strategies for an example
period of 48 hours are compared in Figure 6.
Electricity energy charges are shown in Figure 6 a).
The on-peak period lasts from 12 p.m. to 9 p.m.
Figure 6 b) outlines the cooling load, which is for
these and ongoing results assumed to be
deterministically known to the optimal controller.
The electric power drawn by the chiller is illustrated
in Figure 6 c). One may notice that both
conventional strategies use the second compressor at
some point in time. With two compressors in
parallel, the chiller operates less efficient.
Additionally, both conventional strategies are not
able to forecast the cooling load or ambient
temperatures, and adjust their strategies to these
constraints. Furthermore, they are only able to
consider storage constraints based on the simple
rules listed above. Finally, Figure 6 d) and e) show
the volumetric and real state of charge, respectively.
For this example period, both SC and PC strategy
leave the storage with a higher initial state of charge
for the next period than the OC strategy, but at the
cost of extensive chiller operation during on-peak
periods.
5 CASE STUDY
A large scale case study is intended to quantify
benefits that result from utilizing the OC strategy
over conventional operating strategies.
For this case study, building cooling and
electrical loads are simulated using EnergyPlus.
Four DOE commercial reference buildings (high-rise
apartment, hospital, large office, and secondary
school) are compared (Deru et al., 2011). In the
following, results are presented for the very hot and
humid climate of Miami and the Mediterranean
climate of Los Angeles. Time of use rates are very
well established in the United States and thus help
quantifying the results. The Florida Power & Light
General Service Large Demand Time of Use
(GSLDT-1) rate is used for Miami (Florida Power &
Light (FPL), 2015). For Los Angeles the real time
pricing rate TOU-8-RTP for general service, large
demand with hourly varying prices is used (Southern
California Edison, 2015).
Loads are proportionally scaled down to fit the
experimental test system, and afterwards results are
inverted back.
Specific invest costs for ice storages (
ITES
) and
chilled water storages (
CWS
) were calculated with
the following equations (Gebhardt et al., 2002):
ITES
$
kWh
⁄
66.8∙
ITES,cap
kWh
.
,
(9)
CWS
$
kWh
⁄
380.8∙
CWS,cap
kWh
.
.
(10)
Annual Operation and Maintenance (O&M)
costs for the compression chiller were assumed as
4% of the initial chiller invest (
CC
) (Gebhardt et al.,
2002):
CC
CC,cap
kWh
$
5503∙
CC,cap
kW
.
198.
(11)
Both ITES and CWS are only discharged, when
storage outlet temperatures are able to satisfy air
conditioning supply temperatures (≤ 8 °C). For each
case study, both storages are sized to the same
capacity.
The optimal control strategy is determined for 24
hour deterministic prediction and optimization
horizons, sweeping forward from day to day.
Results for Miami are summarized in Figure 7,
for Los Angeles in Figure 8. In these figures, total
annual costs for the four different building types,
two different storages (ITES and CWS), and
different operating strategies are shown. Total
annual costs are computed as the sum of capital
expenditures (CAPEX, annuity for storage invest at
an interest rate of 7% and depreciation time of 20
years), operation and maintenance (O&M), fixed
customer energy charges (Fixed), other electricity
Optimized Cold Storage Energy Management - Miami and Los Angeles Case Study
275
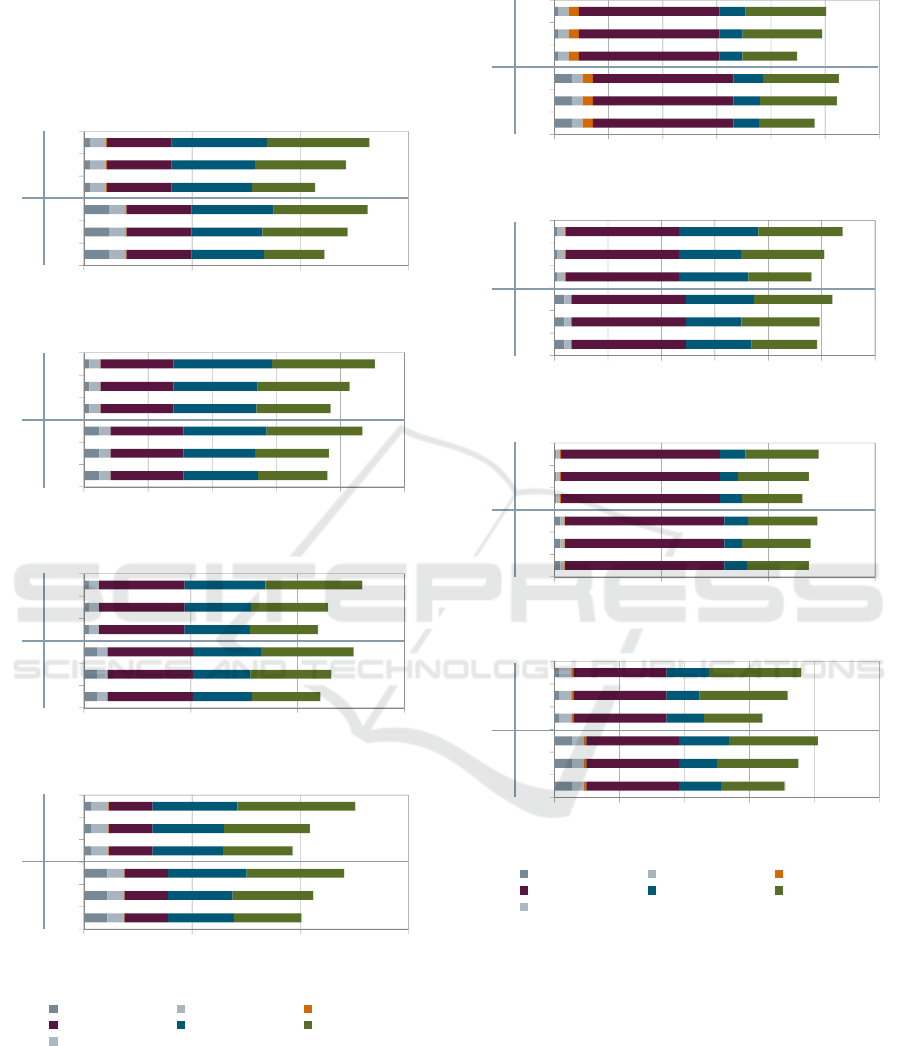
energy charges due to other electrical loads but
cooling (Energy (other)), energy charges related to
cooling (Energy (cooling)), electricity demand
charges (Demand), and compressor start-up costs
(Start-up).
Figure 7: Results of annual simulation/optimization for
buildings located in Miami: Ice thermal energy storage
(ITES) and chilled water storage (CWS) supported cooling
systems using a SOC-controlled (SC), price-controlled
(PC) or optimal-controlled (OC) strategy.
Figure 8: Results of annual simulation/optimization for
buildings located in Los Angeles: Ice thermal energy
storage (ITES) and chilled water storage (CWS) supported
cooling systems using a SOC-controlled (SC), price-
controlled (PC) or optimal-controlled (OC) strategy.
Based on the assumptions, the case study shows
that using the OC strategy total cost savings of app.
2-10% compared to the PC strategy and of app. 5-
20% compared to the SC strategy are possible. Exact
savings depend on both location (climate, electricity
rate), and particular object (building, electrical and
cooling equipment in use).
0 50 100 150
OC
PC
SC
OC
PC
SC
Total annual costs [k$]
0 200 400 600 800 1000
OC
PC
SC
OC
PC
SC
Total annual costs [k$]
0 500 1000 1500
OC
PC
SC
OC
PC
SC
Total annual costs [k$]
0 200 400 600
OC
PC
SC
OC
PC
SC
Total annual costs [k$]
CAPEX O&M Fixed
Energy (other) Energy (cooling) Demand
Start-u
p
a) High-Rise Apartment
b) Hospital
c) Large Office
d) Secondary School
ITESCWSITESCWSITESCWSITESCWS
0 100 200 300 400 500
OC
PC
SC
OC
PC
SC
Total annual costs [k$]
CAPEX O&M Fixed
Energy (other) Energy (cooling) Demand
Start-up
0 500 1000 1500
OC
PC
SC
OC
PC
SC
Total annual costs [k$]
0 200 400 600 800 1000 1200
OC
PC
SC
OC
PC
SC
Total annual costs [k$]
0 20 40 60 80 100 120
OC
PC
SC
OC
PC
SC
Total annual costs [k$]
a) High-Rise Apartment
b) Hospital
c) Large Office
d) Secondary School
ITESCWSITESCWSITESCWSITESCWS
SMARTGREENS 2016 - 5th International Conference on Smart Cities and Green ICT Systems
276

Cost savings in the very hot and humid climate
of Miami with large cooling loads are possible due
to both reducing energy and demand charges.
Savings in the more temperate climate of Los
Angeles with less persistent cooling loads are mainly
because of reductions in demand charges (peak
shaving).
For the building types and their according
storage sizes investigated during this research, ice
storages tend to be less capital intense than chilled
water storages, and thus are economically more
attractive. However, one may realize that energy
charges are smaller for CWS than for ITES. Lower
evaporation temperatures required for charging ice
storages decrease efficiency of the chiller and
therefore electric power drawn by the chiller tends to
be higher.
For this research project, efficiency of the
compression chiller determined during the
experiments was not altered for scaling to higher
loads and larger chiller sizes. For large scale
compression chillers, more efficient compressors
may be used. However, this will only change
absolute costs, but does not change the statements
made about the relative advantages of the OC
strategy.
6 CONCLUSIONS
This paper briefly introduced a novel model for
partial charge and discharge of ice storages
incorporating the preceding storage operating
strategy. The model was validated in a set of
experiments.
The model was implemented in a model-based
predictive controller, which uses a Forward
Dynamic Programming algorithm for solving the
optimization problem.
A large scale case study for four different
building types in two locations (Miami and Los
Angeles) revealed that utilizing the optimal control
strategy annual cost savings of up to 20% compared
to conventional control strategies are possible. Ice
storages tend to be economically more attractive due
lower invest costs, but compression chillers need to
operate at lower evaporation temperatures, which
requires more primary energy input.
The introduced model-based controller may be
utilized in future sustainable energy systems
incorporating large shares of renewable energy
sources. For this, dynamic electricity prices could be
used to force cooling systems with cold thermal
energy storage to run in a strategy beneficial to the
power grid.
Future research will focus on hardware
implementation and validation of the optimal control
approach.
ACKNOWLEDGEMENTS
The research was supported by the European Union
under the European Horizon 2020 strategy in the
Storage Enabled Sustainable Energy for Buildings
and Communities (SENSIBLE) project.
REFERENCES
Bellman, R., 2003. Dynamic Programming. Dover
Publications, Inc., Mineola, N.Y.
Born, A., 2015. Modellierung und experimentelle
Untersuchung einer Kompressionskälteanlage mit
Eisspeicher für die optimale Einbindung in ein Smart
Energy System. Technische Universität München.
Braun, J.E., 2011. A Near-Optimal Control Strategy for
Cool Storage Systems with Dynamic Electric Rates
(RP-1252). HVAC&R Res. 13, 557–580.
Claessen, F.N., Poutré, H. La, 2014. Towards a European
Smart Energy System - ICT innovation goals and
considerations. Brussels, Belgium.
Deru, M., Field, K., Studer, D., Benne, K., Griffith, B.,
Torcellini, P., Liu, B., Halverson, M., Winiarski, D.,
Rosenberg, M., Yazdanian, M., Huang, J., Crawley,
D., 2011. U.S. Department of Energy Commercial
Reference Building Models of the National Building
Stock. Golden, Colorado.
Florida Power & Light (FPL), 2015. Business rates,
clauses and storm factors - Effective June 2015
[WWW Document]. URL
https://www.fpl.com/rates/pdf/June2015_Business.pdf
(accessed 1.6.15).
Gebhardt, M., Kohl, H., Steinrötter, T., 2002. Preisatlas -
Ableitung von Kostenfunktionen für Komponenten der
rationellen Energienutzung. Duisburg-Rheinhausen.
Henze, G.P., Dodier, R.H., Krarti, M., 1997. Development
of a Predictive Optimal Controller for Thermal Energy
Storage Systems. HVAC&R Res. 3, 233–264.
Johansson, T.B., Patwardhan, A., Nakicenovic, N.,
Gomez-Echeverri, L., 2012. Global Energy
Assessment -Toward a Sustainable Future, Global
Energy Assessment (GEA). International Institute for
Applied System Analysis (IIASA), Laxenburg,
Austria.
Lee, T.-S., Liao, K.-Y., Lu, W.-C., 2012. Evaluation of the
suitability of empirically-based models for predicting
energy performance of centrifugal water chillers with
variable chilled water flow. Appl. Energy 93, 583–595.
doi:10.1016/j.apenergy.2011.12.001.
Lee, W.-S., Chen, Y. –Ting, Wu, T.-H., 2009.
Optimization for ice-storage air-conditioning system
Optimized Cold Storage Energy Management - Miami and Los Angeles Case Study
277

using particle swarm algorithm. Appl. Energy 86,
1589–1595. doi:10.1016/j.apenergy.2008.12.025.
Ma, Y., Borrelli, F., Hencey, B., Coffey, B., Bengea, S.,
Haves, P., 2012. Model Predictive Control for the
Operation of Building Cooling Systems. IEEE Trans.
Control Syst. Technol. 20, 796–803.
doi:10.1109/TCST.2011.2124461.
Southern California Edison, 2015. Schedule TOU-8-RTP -
General Service - Large - Real Time Pricing.
Rosemead, California.
Thiem, S., Danov, V., Schaefer, J., Hamacher, T., 2015.
Ice thermal energy storage (ITES) – Experimental
investigation and modeling for integration into multi
modal energy system (MMES), in: Proceedings of the
9th International Renewable Energy Storage
Conference. Duesseldorf, Germany.
U.S. Energy Information Administration, 2015. Annual
Energy Outlook 2015 with projections to 2040.
Washington, DC, USA.
Wang, H., Chen, Q., 2014. Impact of climate change
heating and cooling energy use in buildings in the
United States. Energy Build. 82, 428–436.
doi:10.1016/j.enbuild.2014.07.034.
Wilden, M.W., Truman, C.R., 1985. Evaluation of
Stratified Chilled-Water Storage Techniques - Volume
2: Appendixes. Albuquerque, New Mexico.
Zhang, Y., Lu, N., 2013. Demand-side management of air
conditioning cooling loads for intra-hour load
balancing, in: 2013 IEEE PES Innovative Smart Grid
Technologies Conference (ISGT). IEEE, pp. 1–6.
doi:10.1109/ISGT.2013.6497905.
SMARTGREENS 2016 - 5th International Conference on Smart Cities and Green ICT Systems
278
