
Super-resolution based on Edge-aware Sparse Representation Via
Multiple Dictionaries
Muhammad Haris and Hajime Nobuhara
Department of Intelligent Interaction Technologies, University of Tsukuba, Tsukuba, Japan
Keywords:
Sparse Representation, Edge Orientation, Super-resolution, Multiple Dictionaries, Gradient, High-frequency
Component.
Abstract:
In this paper, we propose a new edge-aware super-resolution algorithm based on sparse representation via mul-
tiple dictionaries. The algorithm creates multiple pairs of dictionaries based on selective sparse representation.
The dictionaries are clustered based on the edge orientation that categorized into 5 clusters: 0, 45, 90, 135, and
non-direction. The proposed method is conceivably able to reduce blurring, blocking, and ringing artifacts in
edge areas, compared with other methods. The experiment uses 900 natural grayscale images taken from USC
SIPI Database. It is confirmed that our proposed method is better than current state-of-the-art algorithms. To
amplify the evaluation, we use four evaluation indexes: higher peak signal-to-noise ratio (PSNR), structural
similarity (SSIM), feature similarity (FSIM) index, and time. On 3x magnification experiment, our proposed
method has the highest value for all evaluation compare to other methods by 11%, 14%, 6% in terms of PSNR,
SSIM, and FSIM respectively. It is also proven that our proposed method has shorter execution time compare
to other methods.
1 INTRODUCTION
The needs of creating better super-resolution algo-
rithm become necessary due to increasing numbers
of hardware such as high-resolution television and
smartphones. Many images and videos are still avail-
able in lower resolution formats such as older video,
the source from internet, or old smartphones. The
problem happened while interpolating missing area,
then finding the best algorithm to predict the most
suitable pixel value. It becomes more challenging to
analyze the pattern of natural images and edge orien-
tation to be able to predict the missing pixels.
There have been many previous works on super-
resolution algorithms. The simplest algorithms used
linear function to interpolate new pixel values. The
classic bilinear and other methods have been widely
applied as a real-time application in image view-
ers and image-processing tools (Nuno-Maganda and
Arias-Estrada, 2005). These methods are computa-
tionally efficient yet obtained images do not appear
natural due to several drawbacks including the fol-
lowing: (1) blurring, blocking, and ringing artifacts
in edge areas; (2) less smoothness along the edges;
and (3) discontinuity along the edges (Asuni and Gi-
achetti, 2008).
Edge direction based algorithms have been per-
formed to overcome previous limitation (Li and Or-
chard, 2001; Chen et al., 2005; Hirakawa and Parks,
2005; Giachetti and Asuni, 2011; Haris et al., 2014).
They usually exploit local features like edges (often
called edge-adaptive) for example NEDI (Li and Or-
chard, 2001). The NEDI technique provides good re-
sults by adapting locally at each interpolating surface
and assuming local regularity in the curvature. Fast
Curvature Based Interpolation (FCBI) (Giachetti and
Asuni, 2011), which was inspired by NEDI (Li and
Orchard, 2001), obtained the interpolated pixels from
the average of the two pixels. These two pixels were
decided based on the second order directional deriva-
tives of image intensity.
Meanwhile, super-resolution by using sparse rep-
resentation become popular, since its ability that
could naturally encode the semantic information of
images (Wright et al., 2010; Zeyde et al., 2012; Yang
et al., 2010). By collecting the representative of each
sample then creating an over-completed dictionary,
we could discover the correct basis to encode the in-
put image correctly. The works conducted by Yang et
al. and Zeyde et al. focus on a single pair of dictionar-
ies. However, intuitively a single pair of dictionaries
could produce many redundancies that may cause in-
40
Haris, M. and Nobuhara, H.
Super-resolution based on Edge-aware Sparse Representation Via Multiple Dictionaries.
DOI: 10.5220/0005723300400047
In Proceedings of the 11th Joint Conference on Computer Vision, Imaging and Computer Graphics Theory and Applications (VISIGRAPP 2016) - Volume 3: VISAPP, pages 40-47
ISBN: 978-989-758-175-5
Copyright
c
2020 by SCITEPRESS – Science and Technology Publications, Lda. All rights reserved
stability during image reconstruction process. There-
fore, we proposed multiple pairs of dictionaries which
classified by the edge orientation to select the most
relevant pair of dictionaries for the particular signal.
The paper is organized as follows: Section 2
presents the explanation about current state-of-the-
art research. Section 3 explains the proposed algo-
rithm including edge orientation measurement, mul-
tiple dictionaries construction, and enlargement pro-
cess. Section 4 demonstrates the result of experiment
and analysis.
2 SUPER-RESOLUTION BASED
ON SPARSE REPRESENTATION
Nowadays, sparse signal representation has been
widely used as a powerful tool for representing and
compressing high-dimensional signals. It can find the
correct basis that naturally represent the signals of
audio and images. Sparse representation could nat-
urally generate semantic information of input data.
This advantage is also become the challenging point
to construct a sparse system. It is confirmed the
strength of sparsity as a powerful visual representa-
tion (Zeyde et al., 2012; Yang et al., 2010). The re-
sult of sparse representation naturally choose the most
relevant patch bases in the dictionary that could rep-
resent the patch of the low-resolution input image op-
timally.
There are two constraints to solve the ill-posed
problem on super-resolution that are proposed in this
system: (1) Reconstruction constraint, it requires to
force the recovered input X to be consistent with in-
put Y. (2) Sparsity prior, every patch from the image
could be represented as a sparse linear combination in
the dictionary.
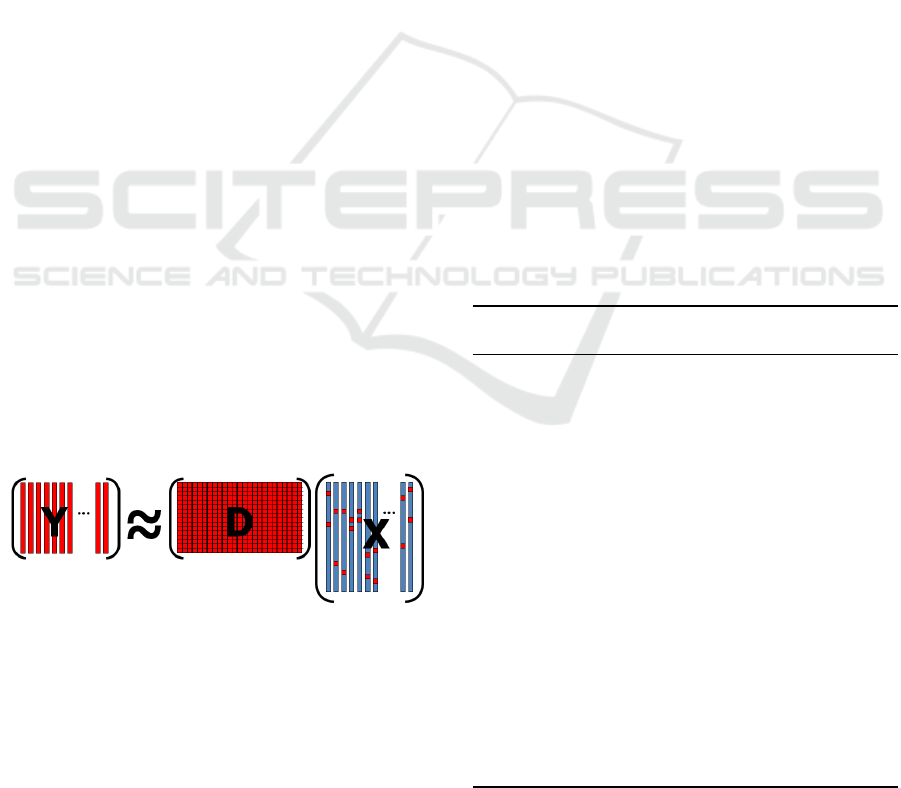
Figure 1: Sparse Signal Representation.
Let assumed the given low-resolution input image
Y , recover high-resolution image X, and D is down-
sampling or filter operator. By seeing this equation,
many high-resolution images X satisfy the reconstruc-
tion constraint in Fig. 1. Therefore, the patch x of
the high-resolution image X can be represented as a
sparse linear combination in dictionary D
h
of high-
resolution patches sampled from training images as
Eq. 1 below.
x ≈ D
h
α for some α ∈ R
K
with kαk K (1)
The sparse representation α will be recovered by
representing the patches y of the input image Y, with
respect to low-resolution dictionary D
l
and trained
with D
h
.
Based on Yang et al., the algorithm tries to in-
fer the high-resolution image patch for each low-
resolution image patch from the input. In this system,
they developed two dictionaries D
h
and D
l
, which are
trained to have the same sparse representations. They
obtain mean value from each patch so that the patch
could represent as texture rather than the absolute in-
tensity. Then, in the recovery process, the mean value
for each high-resolution patch is predicted by its low-
resolution patch.
For each low-resolution input patch y, it obtains
the sparse representation to D
l
. Then, the correspond-
ing high-resolution patch bases D
h
will be combined
according to these coefficients to generate the high-
resolution output patch x. The problem to find the
sparse representation of y can be defined by Eq. 2
below.
minkαk
0
s.t kFD
l
α − Fyk
2
2
≤ ε (2)
where F is feature extraction operator. F is taking
a main role as a perceptually meaningful constraint to
present the relation between α and y. Full steps of the
super-resolution algorithm describe in Algorithm 1.
Algorithm 1: Super-resolution via Sparse Represen-
tation (Yang et al., 2010).
Input: Training dictionaries D
h
and D
l
, a
low-resolution image Y
Output: super-resolution image X
?
1 For each 3 × 3 patch y of Y , taken starting from
the upper-left corner with 1 pixel overlap in
each direction,
• Compute mean pixel value m of patch y
• Solve the optimization problem with
˜
D and ˜y
defined in: min
α
k
˜
Dα − ˜yk
2
2
+ λkαk
1
• Generate the high-resolution patch x = D
h
α
?
• Put the patch x + m into HR image X
0
2 End
3 Using gradient descent, find the closest image
to X
0
which satisfies the reconstruction
constraint:
X
?
= argmin
X
kSHX −Y k
2
2
+ ckX − X
0
k
2
2
4 return X
?
Super-resolution based on Edge-aware Sparse Representation Via Multiple Dictionaries
41
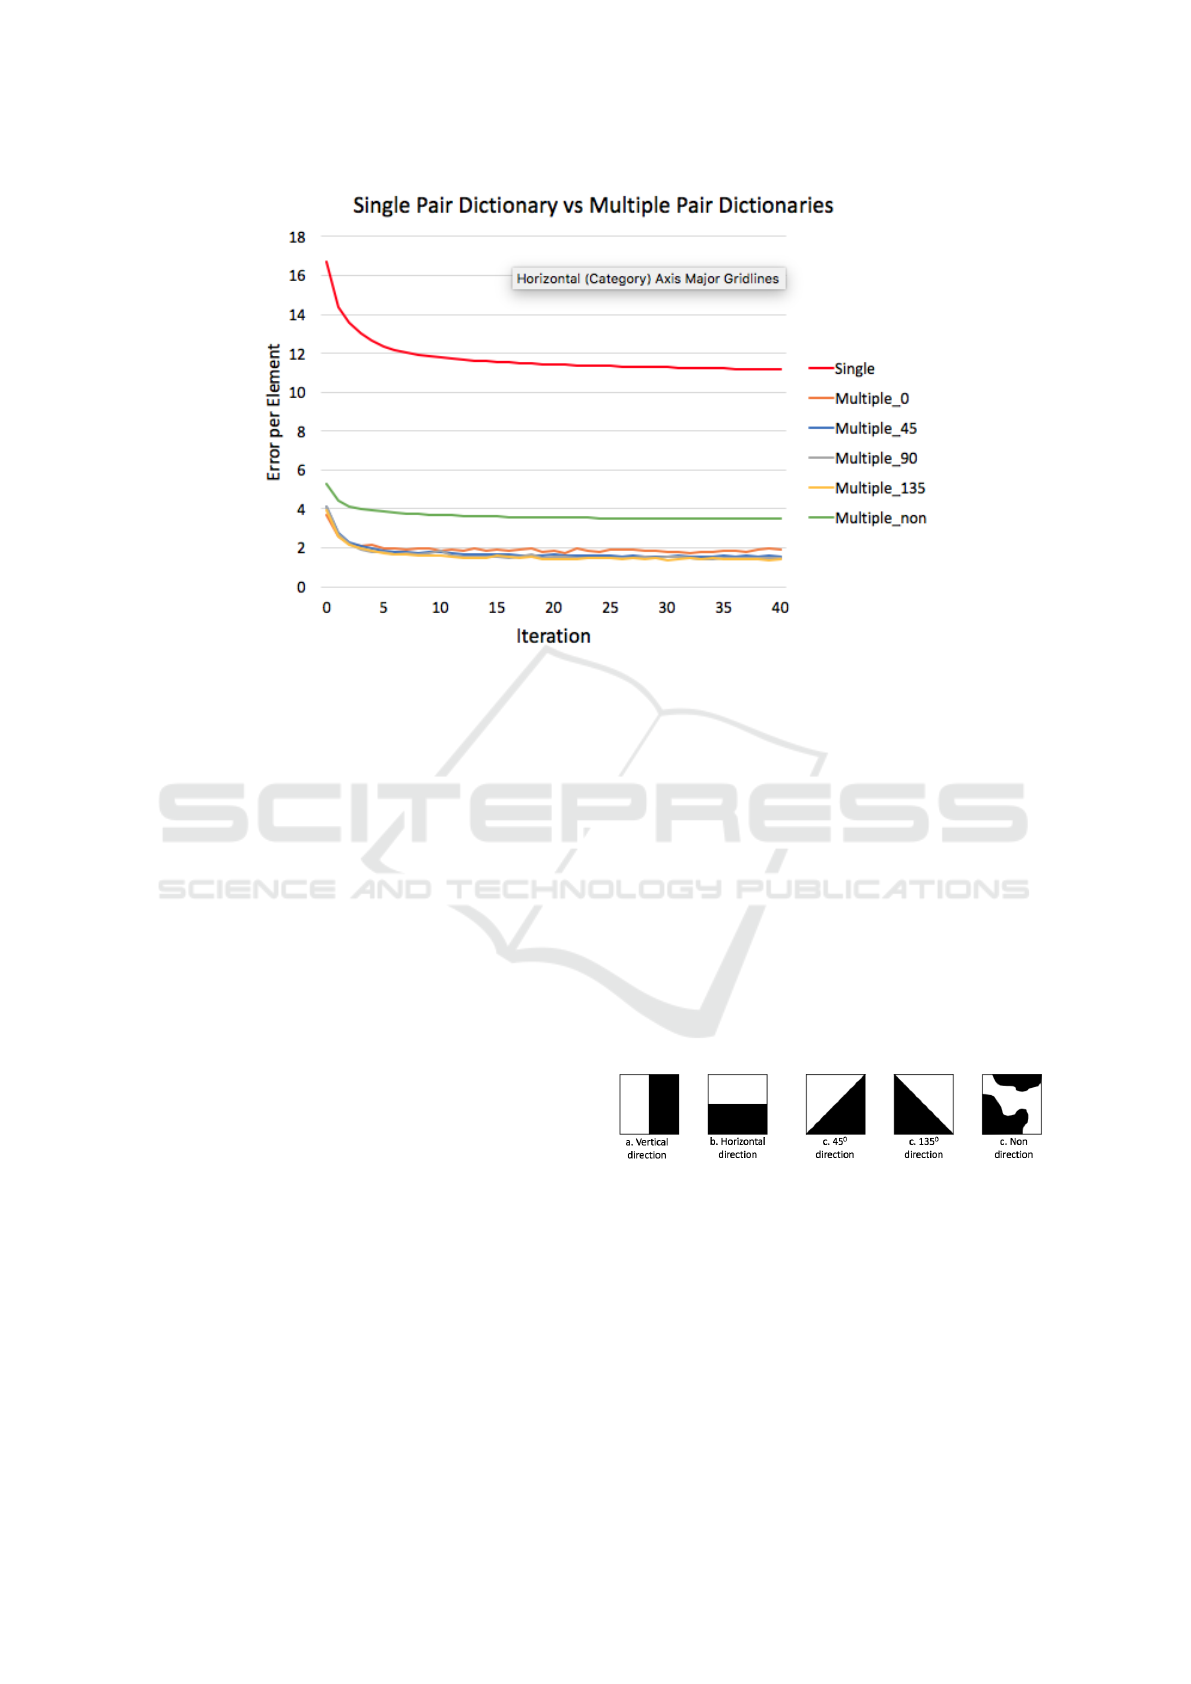
Figure 2: Error produced from K-SVD dictionary learning for single pair dictionary and multiple pair dictionaries with 1024
atoms. Single pair dictionary error is labeled as ”Single” which produce higher error than multiple pair dictionaries that
classify into five classes based on edge orientation (0, 45, 90, 135, and non-direction).
2.1 Single Dictionary vs Multiple
Dictionaries
The works conducted by Yang et al. and Zeyde et
al. are both focus on constructing a single pair of the
sparse dictionary. However, since the training patch
is not categorized into specific categories, it can pro-
duce many redundancies that lead to instability during
the sparse coding process. We found that selectively
choosing the training patches and then categorizing
into some specific classes could reduce the error dur-
ing the sparse coding process.
The comparison from K-SVD dictionary learning
algorithm from single pair dictionary and multiple
pair dictionaries are shown in Fig. 2. The experi-
ment uses 40 iterations and calculates the error per
element for each iteration. The figure shows that sin-
gle pair dictionary produces higher error per element
than multiple pair dictionaries that have a very small
error for some classes.
3 PROPOSED METHOD
In this section, the core algorithm is explained. Edge
orientation is used to classify each training patch pairs
to create multiple pairs of dictionaries. First, edge
orientation measurement is outlined then followed by
multiple dictionaries construction. Finally, the super-
resolution algorithm that utilize the obtained multiple
dictionaries is described.
3.1 Edge Orientation Measurement
As shown in Fig. 3, five edge orientations are defined
in the edge descriptor. They are four directional edges
and a non-directional edge. Four directional edges
include vertical, horizontal, 45 degrees, and 135 de-
grees diagonal edges. These directional edges are ex-
tracted from the image patches. If the image patch
contains an arbitrary edge without any directionality,
then it is classified as a non-directional edge.
Figure 3: Five types of edge orientations.
Fig. 4 explains the steps to obtain the edge ori-
entation. First, the original image is converted to
black-and-white edge image. Then, for each patch
size : 9 ×9, we calculate the gradient which is a scalar
that specifies the angle between the x-axis and the
major axis of the ellipse that has the same second-
moments as the region. The value is in degrees, rang-
ing from 0 to 180 degrees.
VISAPP 2016 - International Conference on Computer Vision Theory and Applications
42
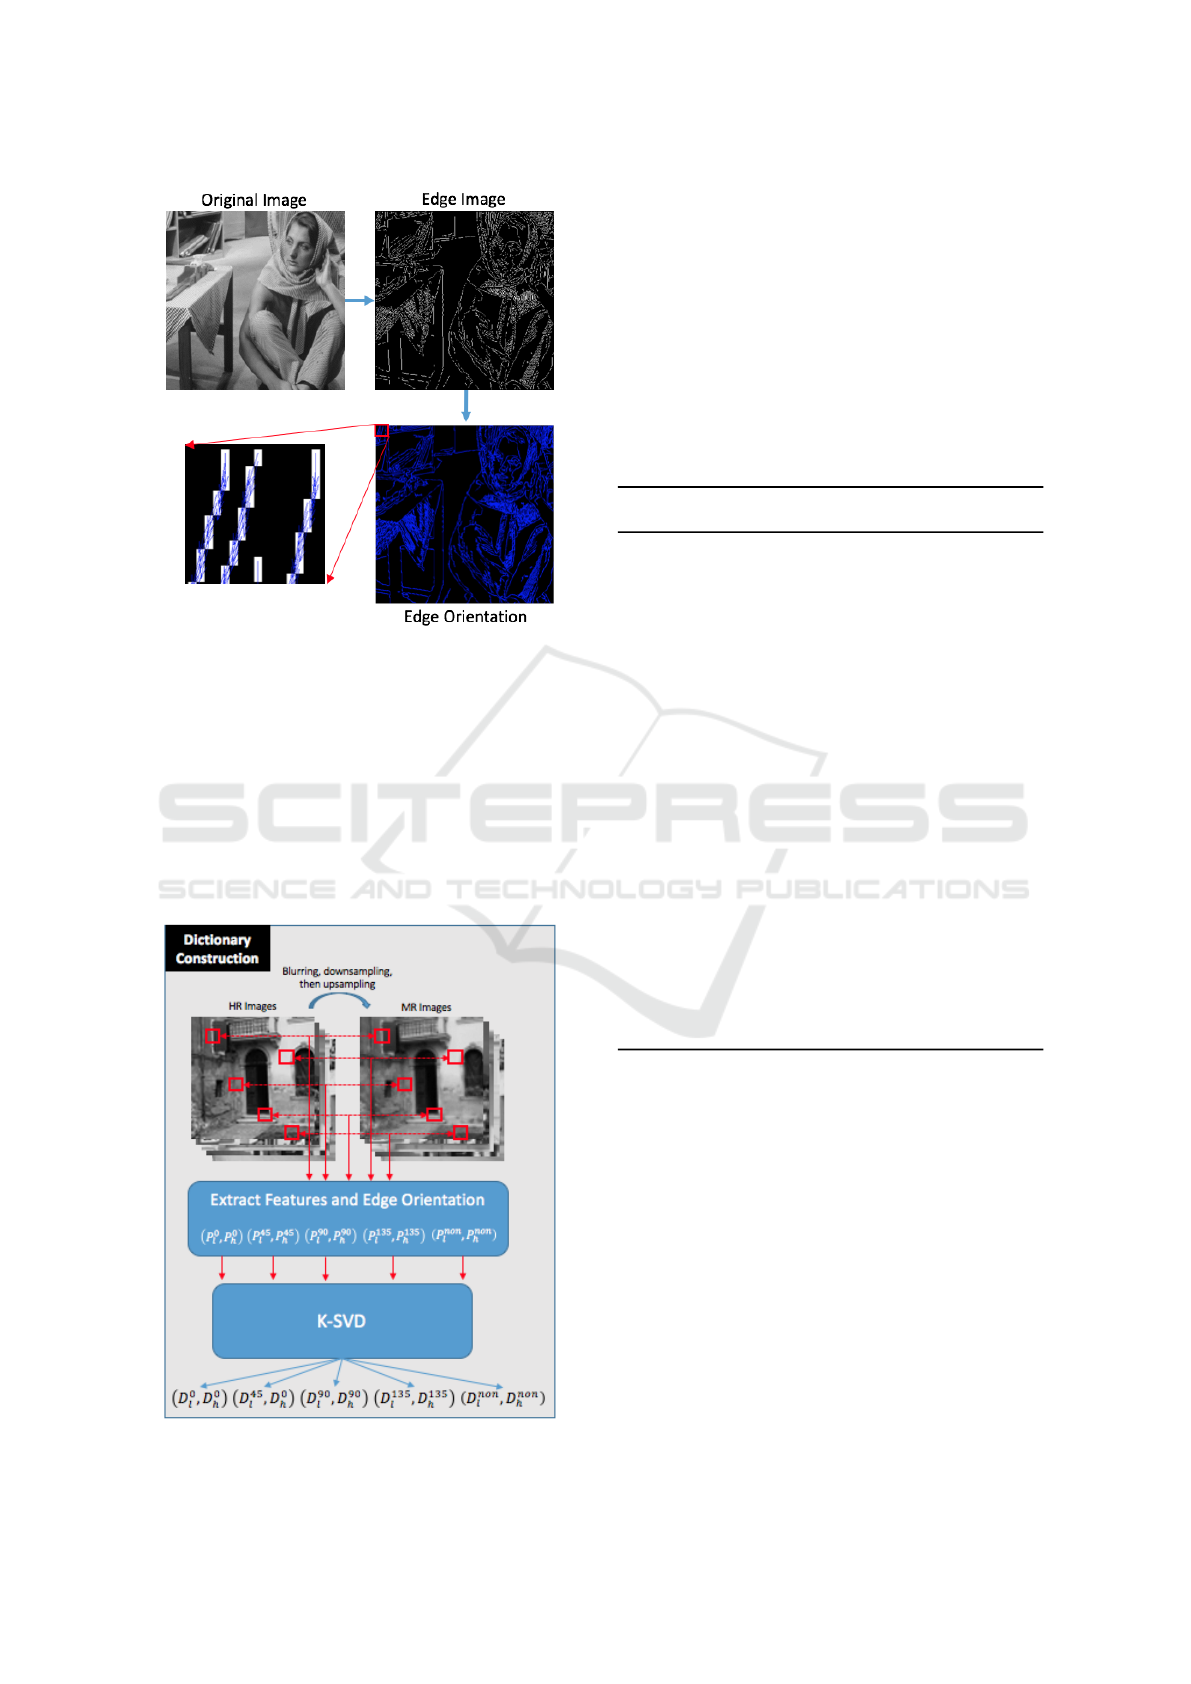
Figure 4: Process of edge orientation calculation. The blue
arrow in the last image shows the edge orientation of partic-
ular patch.
3.2 Multiple Dictionaries Construction
This subsection explains the dictionary training pro-
cess to create multiple pairs of dictionaries. The brief
process is illustrated in Fig. 5. This step will pro-
duce five pairs of dictionaries which will be used in
the sparse coding step to constructing HR image.
Figure 5: Process of dictionary construction.
A set of high-resolution (HR) images is required
as an input in the dictionaries construction process.
Algorithm 2 briefly explains the main steps of the dic-
tionaries construction. The middle resolution (MR)
image is obtained from the process of blurring, down-
sampling, then upsampling of HR image. The algo-
rithm starts by gathering pairs of feature patches from
HR and MR features that extracted from HR and MR
images, then classified the patches into five clusters
based on edge orientations. Finally, each cluster is
used to train D
l
and D
h
respect to its cluster using K-
SVD (Aharon et al., 2006).
Algorithm 2: The proposed multiple pairs dictionar-
ies construction.
Input: HR training images set.
Output: Multiple pairs of dictionaries D
h
and
D
l
.
1 Create LR images by blurring and
downsampling HR images
2 Upsampling each LR image to create MR
images
3 Apply feature extraction filters on each MR
image and obtain high frequency component
from HR images
4 Estimate the edge orientation from each HR
image
5 Divide each HR and MR feature into patches
then reshape them into one pair of vectors
6 Gather and cluster the vector into 5 classes
based on edge orientation
7 Combine the vectors into array for multiple
class MR patches (P
0
l
, P
45
l
, P
90
l
, P
135
l
, P
n
l
) and
HR patches (P
0
h
, P
45
h
, P
90
h
, P
135
h
, P
n
h
)
8 For each cluster, learn a pair of coupled
dictionaries
9 return X
?
3.3 Super-resolution Algorithm
The reconstruction process starts by up-sampling LR
image into MR image by using Bicubic. Features
and edge orientation are extracted and calculated, and
then reshape each patch into the one-row vector. Af-
ter multiple sets of vectors were created, by using
dictionaries obtained from learning steps, the sparse
coding coefficients of the MR feature over the clus-
ter LR dictionary are calculated. Finally, an HR patch
is obtained by multiplying the cluster HR dictionary
with sparse coding coefficients obtained from the pre-
vious step. The summary of the proposed algorithm
is briefly concluded in Fig. 6.
Super-resolution based on Edge-aware Sparse Representation Via Multiple Dictionaries
43
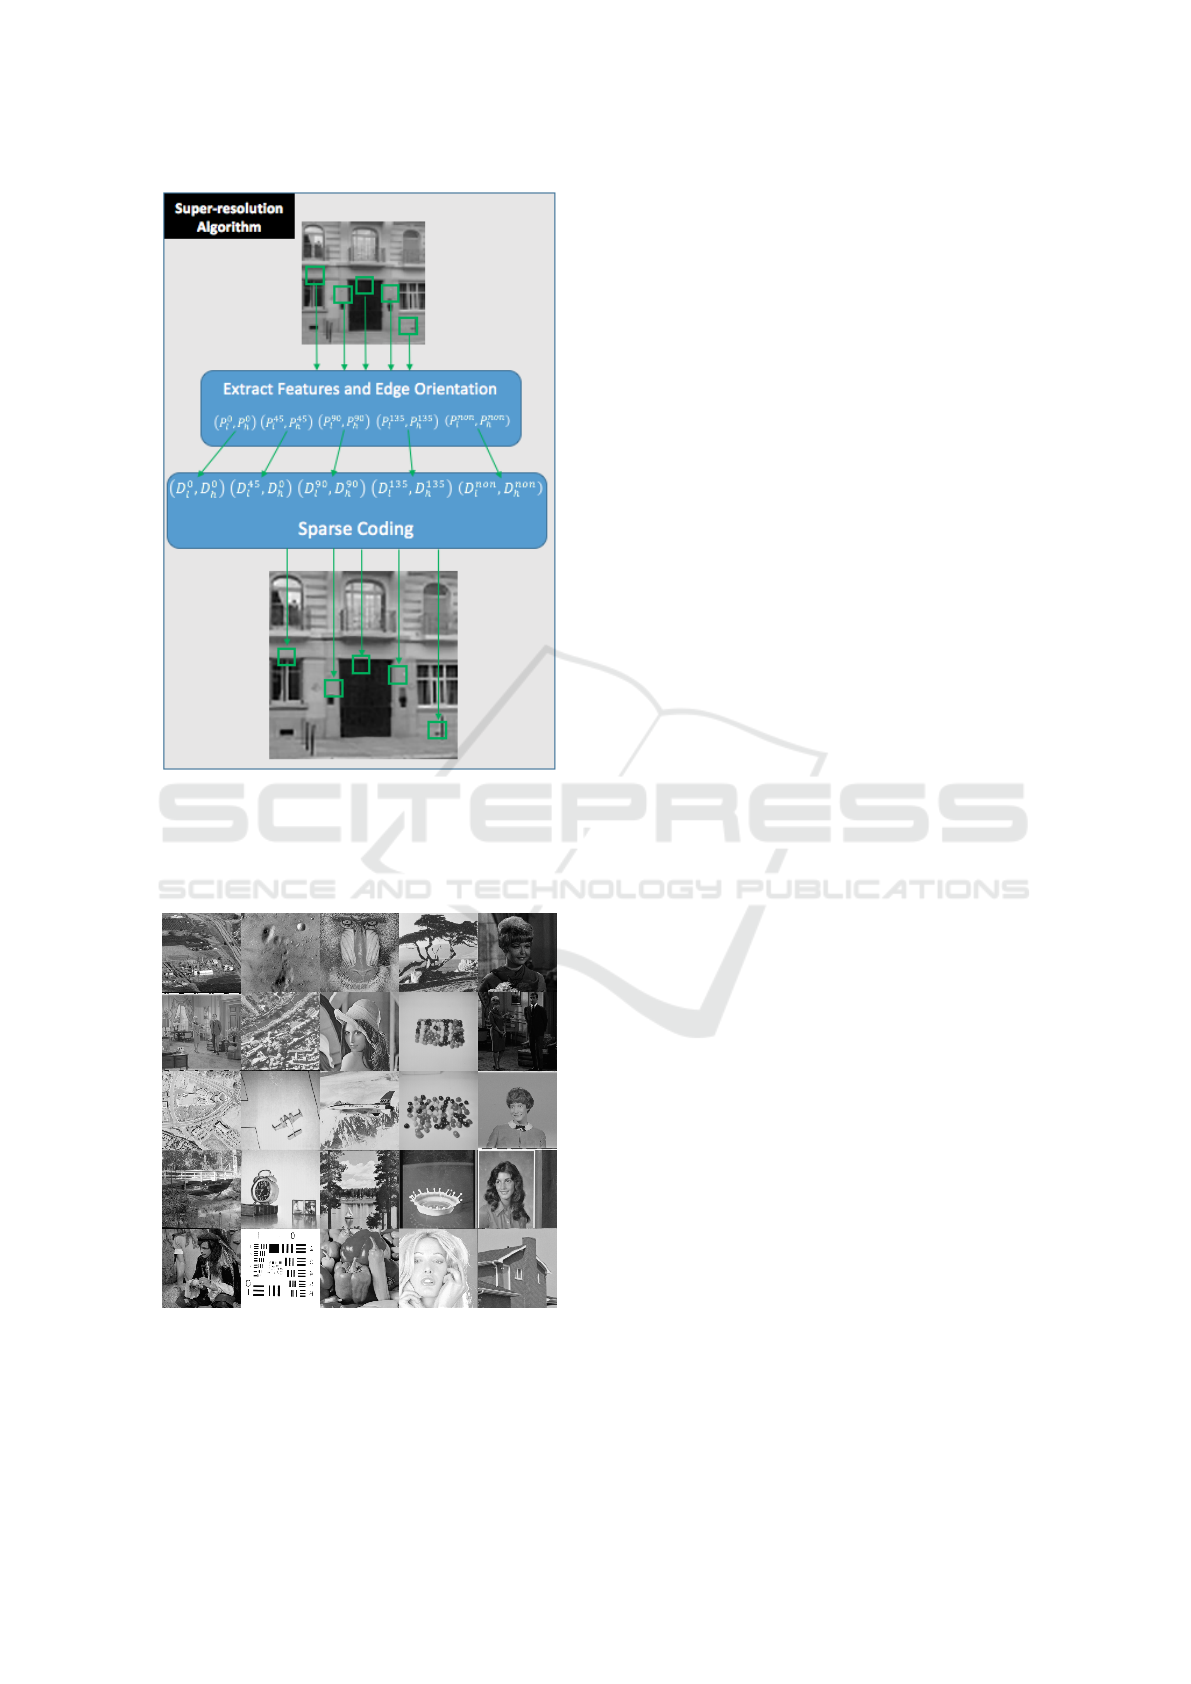
Figure 6: The proposed super-resolution algorithm.
4 EXPERIMENTAL RESULTS
Figure 7: Sample of training and testing images taken from
USC SIPI Image Databases.
The experiments were conducted to confirm the effi-
ciency of the proposed method. Analysis of the ex-
periments is divided into two subsections: quantita-
tive and qualitative analysis. All experiments are con-
ducted using Matlab R2012b on Win 8.1 64bit (In-
tel Core i7@3.2GHz, 8GB). We used images dataset
from USC SIPI Image Databases. The testing images
contained various patterns and natural objects. The
sample of the dataset is shown in Fig.7. The image
criteria of the experiment are:
• Grayscale images (Intensity range 8 bit)
• Original Images (256 x 256 pixels)
• Experimental 900 images
The experiments compare the observed images
that obtained by using downsampling from the orig-
inal images then enlarged with different methods
by 3× magnification. In this experiment, we com-
pare seven methods: Nearest neighbor, Bi-Linear, Bi-
Cubic, Yang et al., Kim et al., Zeyde et al., and Pro-
posed Method. The algorithm used in the experiment
has different in nature. Therefore, to have objective
comparisons, all parameters used in the training and
testing are similar. However, for conventional inter-
polation methods, there is no specific parameter that
need to be used.
Our proposed method uses 3×3 patches with no
overlap pixels and 5 pairs of dictionaries. The algo-
rithm of Yang et al. uses 5×5 patches with 4-pixels
patch overlap and a single pair of dictionaries with
1024 atoms. The algorithm of Zeyde et al. uses 3×3
patches with 2-pixels patch overlap and a single pair
of dictionaries with 1000 atoms. All parameters and
training images are provided by the authors. The D
l
is learned by K-SVD (Aharon et al., 2006) with 40
iterations and sparsity S = 3.
4.1 Quantitative Analysis
PSNR (Irani and Peleg, 1993), SSIM (Wang et al.,
2004), FSIM (Zhang et al., 2011), and elapsed time
are used as a quantitative measurement. The PSNR in
decibels (dB) between the original image and the up-
scaled image is given by (Irani and Peleg, 1993). The
SSIM is a method that measures the quality of images
based on the structural content of the original image
and the magnified image. FSIM is based on the fact
that the HVS understands an image mainly accord-
ing to its low-level features. Two features are consid-
ered in the FSIM computation: the primary feature,
i.e., phase congruency (PC), which is a dimension-
less measure of a local structures significance, and
the secondary feature, i.e., image gradient magnitude
(GM). FSIM combines both features to characterize
the local quality of the image. These three measure-
ments (PSNR, SSIM, FSIM) indicate better quality
by higher values. Meanwhile, CPU time is computed
VISAPP 2016 - International Conference on Computer Vision Theory and Applications
44

Table 1: Comparison of the average quantitative results by PSNR, SSIM, and FSIM for 3x magnification.
Methods PSNR SSIM FSIM Time
Nearest neighbor 22.762 ± 3.85 0.637 ± 0.12 0.736 ±0.06 -
Bilinear 23.243 ± 3.91 0.650 ± 0.12 0.767 ±0.06 -
Bicubic 23.361 ± 3.93 0.663 ± 0.12 0.779 ±0.06 -
Kim et al. 23.205 ± 3.93 0.674 ± 0.11 0.789 ±0.06 5.568 ± 1.83
Yang et al. 23.213 ± 3.93 0.673 ± 0.11 0.795 ±0.05 67.189 ± 4.78
Zeyde et al. 23.328 ± 3.93 0.677 ± 0.11 0.794 ±0.05 0.669 ± 0.04
Proposed 25.847 ± 4.35 0.768 ± 0.09 0.845 ± 0.05 6.290 ±1.15
by using Matlab function (tic, toc) which measure
elapsed time spent by a certain process to finish.
In Table 1, the average values from 4 measure-
ments are provided. The best values are in bold.
It confirms that our proposed method clearly out-
performs other methods for PSNR, SSIM, and FSIM.
For the PSNR value, our proposed method obtains
25.847 dB that at least higher around 11% compare
to other methods. SSIM also shows that our proposed
method obtains the best value compare to other meth-
ods by around 14% difference. Then, FSIM also notes
the best value for our proposed method by at least 6%
difference. However, it is noted that PSNR is not suit-
able to measure the quality of Bicubic and Bilinear
since the quantitative and qualitative analysis for both
methods shows some anomalies.
Our proposed method does not provide the lowest
computational time. However, our proposed method
is still far better than Yang et al.’s algorithm. The
lowest computational time is taken by Zeyde et al.,
while our proposed method competitively competes
with Kim et al. by less than 1 sec difference. In the
future, the GPU application also can widely open the
opportunity to decrease the computation time of pro-
posed method. Nearest neighbor, bilinear, and bicu-
bic are excluded from the time evaluation since it has
differences in nature from the proposed method and
other methods. These conventional methods are sim-
ple interpolation that not use any prior information or
learning process. Moreover, the implementation uses
Matlab built-in function that makes the unfair com-
parison since it has optimization process automati-
cally.
4.2 Qualitative Analysis
The evaluation of proposed method by visual result
is presented. This analysis verifies that the proposed
method can reduce common artifacts such as ringing,
blurring, and blocking. It is also proven that the algo-
rithm can reconstruct the image details successfully.
The experiment of 3x magnification is used to verify
the effectiveness of proposed method. Fig. 8 provides
the result of all methods used in the experiments. Our
proposed method shows its superiority to reconstruct
edges better that other algorithms.
To clearly see the difference of each result, we
also provide the difference between original image
and each output image. Fig. 9 shows that our pro-
posed method has the least amount of difference with
the original image. Meanwhile, other methods still
produce some artifacts that show clearly the pattern
of images.
In Fig. 10, we provide a better view to see the dif-
ference between each result. Red arrows show the dif-
ference between each image. The curvy line produced
by our proposed method shows clearer and stronger
edge compare to other methods.
5 CONCLUSIONS
In this paper, a super-resolution based on edge-aware
multiple pairs of dictionaries is proposed. The pro-
posed method employs the classification based on
edge orientation to obtain selective patches. By creat-
ing five clusters, each cluster obtains a pair of dictio-
naries D
l
and D
h
. The proposed method has been im-
plemented and out-performed other methods. The ex-
periment result shows the superiority of our proposed
method for both quantitative and qualitative analysis
by preserving the detail and reduce artifacts, such as
blurring and ringing around the edge. Furthermore,
the GPU application also open the opportunity to de-
crease the computation time of proposed method.
ACKNOWLEDGEMENTS
This work was supported by CREST, Japan Science
and Technology Agency. The author also would
like to thanks to Indonesia Endowment Fund for Ed-
ucation (LPDP) Scholarship from Ministry of Fi-
nance, The Republic of Indonesia for Doctoral De-
gree Scholarship.
Super-resolution based on Edge-aware Sparse Representation Via Multiple Dictionaries
45
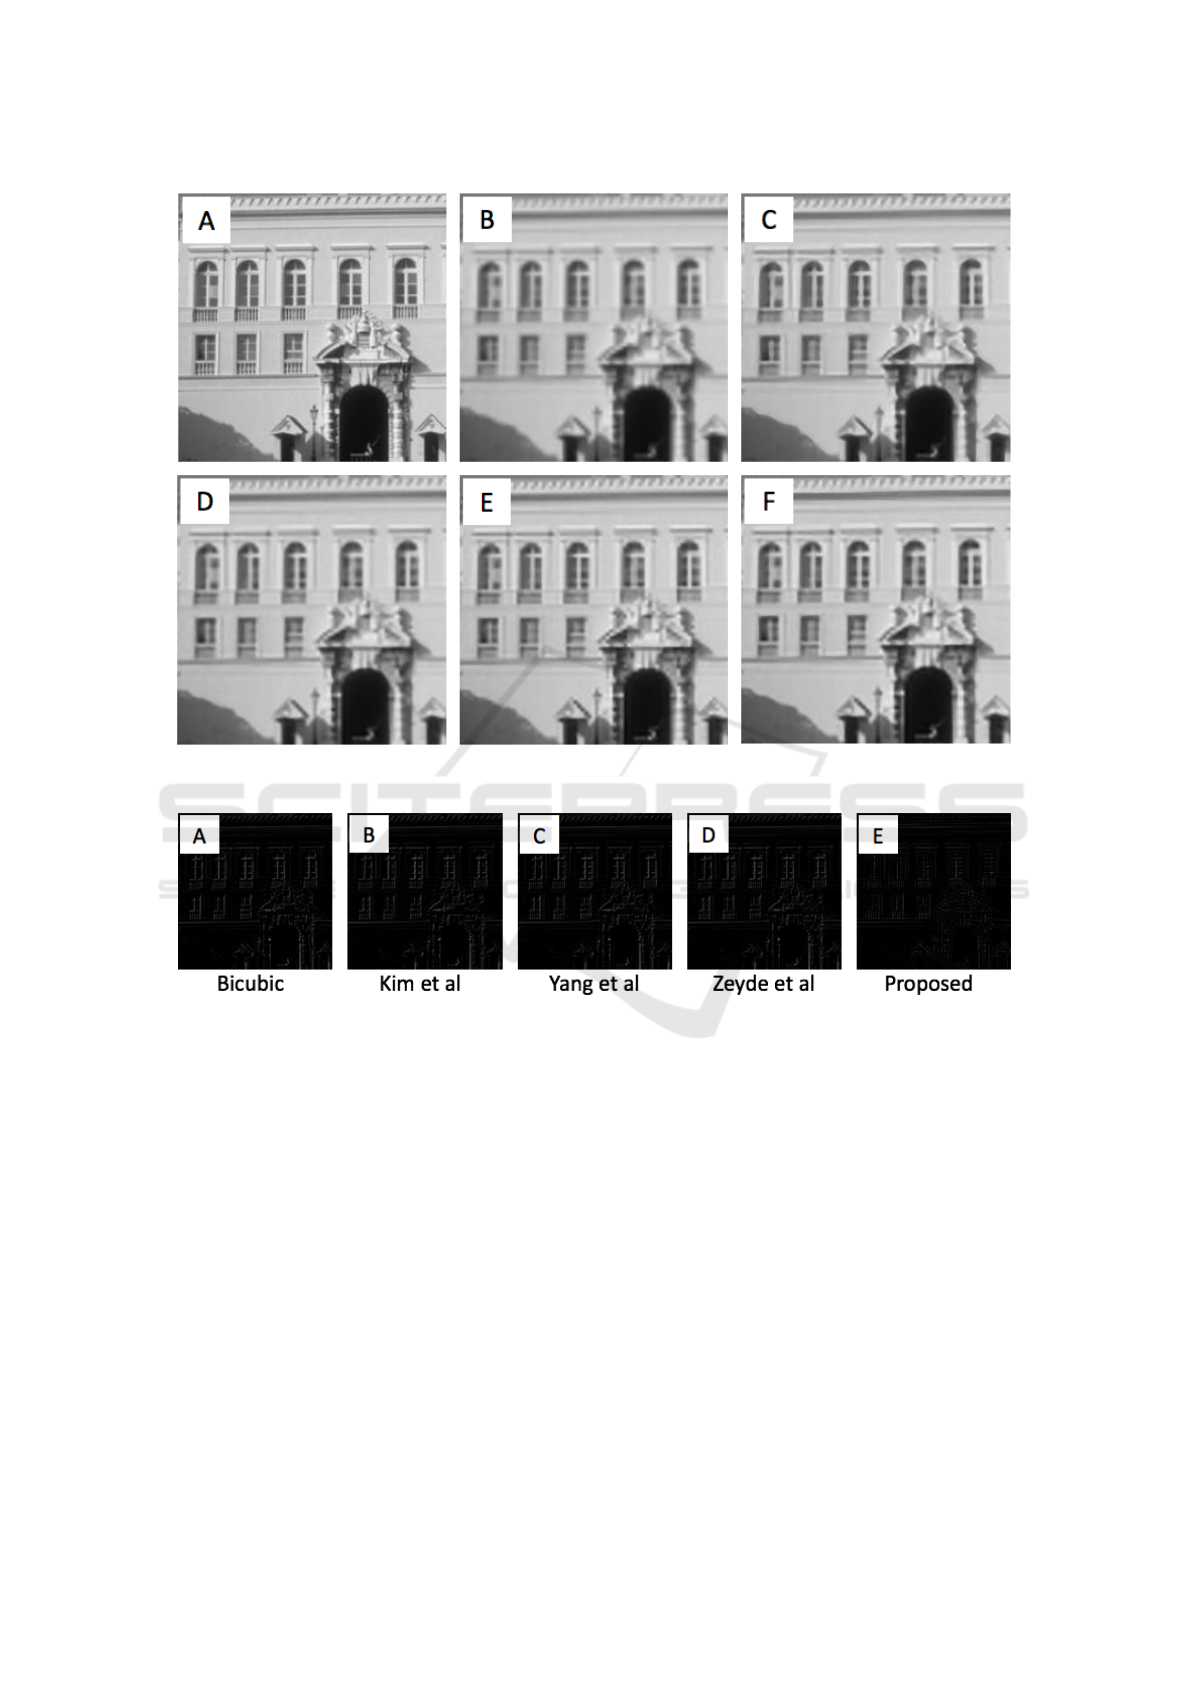
Figure 8: Result of experiment for 3x magnificant. A) Ground Truth, B) Bicubic (SSIM= 0.659), C) Kim et al. (SSIM=0.670),
B) Zeyde et al. (SSIM=0.673 ), E) Yang et al. (SSIM=0.671), F) Proposed method (SSIM=0.795).
Figure 9: The difference image between original image and related method of Fig. 8. (A) Bicubic, (B) Kim et al., (C) Yang et
al., (D) Zeyde et al., (E) Proposed method.
REFERENCES
Aharon, M., Elad, M., and Bruckstein, A. (2006). K-svd:
An algorithm for designing overcomplete dictionaries
for sparse representation. Signal Processing, IEEE
Transactions on, 54(11):4311–4322.
Asuni, N. and Giachetti, A. (2008). Accuracy improve-
ments and artifacts removal in edge based image in-
terpolation. VISAPP (1)’08, pages 58–65.
Chen, M.-J., Huang., C.-H., and Lee., W.-L. (2005). A fast
edge-oriented algorithm for image interpolation. Im-
age and Vision Computing, 23(9):791–798.
Giachetti, A. and Asuni, N. (2011). Real time artifact-free
image upscaling. Image Processing, IEEE Transac-
tions on, 20(10):2760–2768.
Haris, M., Sawase, K., Widyanto, M. R., and Nobuhara, H.
(2014). An efficient super resolution based on image
dimensionality reduction using accumulative intensity
gradient. Journal of Advanced Computational Intelli-
gence and Intelligent Informatics, 18(4):518–528.
Hirakawa, K. and Parks, T. (2005). Adaptive homogeneity-
directed demosaicing algorithm. Image Processing,
IEEE Transactions on, 14(3):360–369.
Irani, M. and Peleg, S. (1993). Motion analysis for im-
age enhancement: Resolution, occlusion, and trans-
parency. Journal of Visual Communication and Image
Representation, 4(4):324–335.
Li, X. and Orchard, M. T. (2001). New edge-directed in-
terpolation. IEEE Transactions on Image Processing,
10:1521–1527.
Nuno-Maganda, M. and Arias-Estrada, M. (2005). Real-
time fpga-based architecture for bicubic interpolation:
VISAPP 2016 - International Conference on Computer Vision Theory and Applications
46
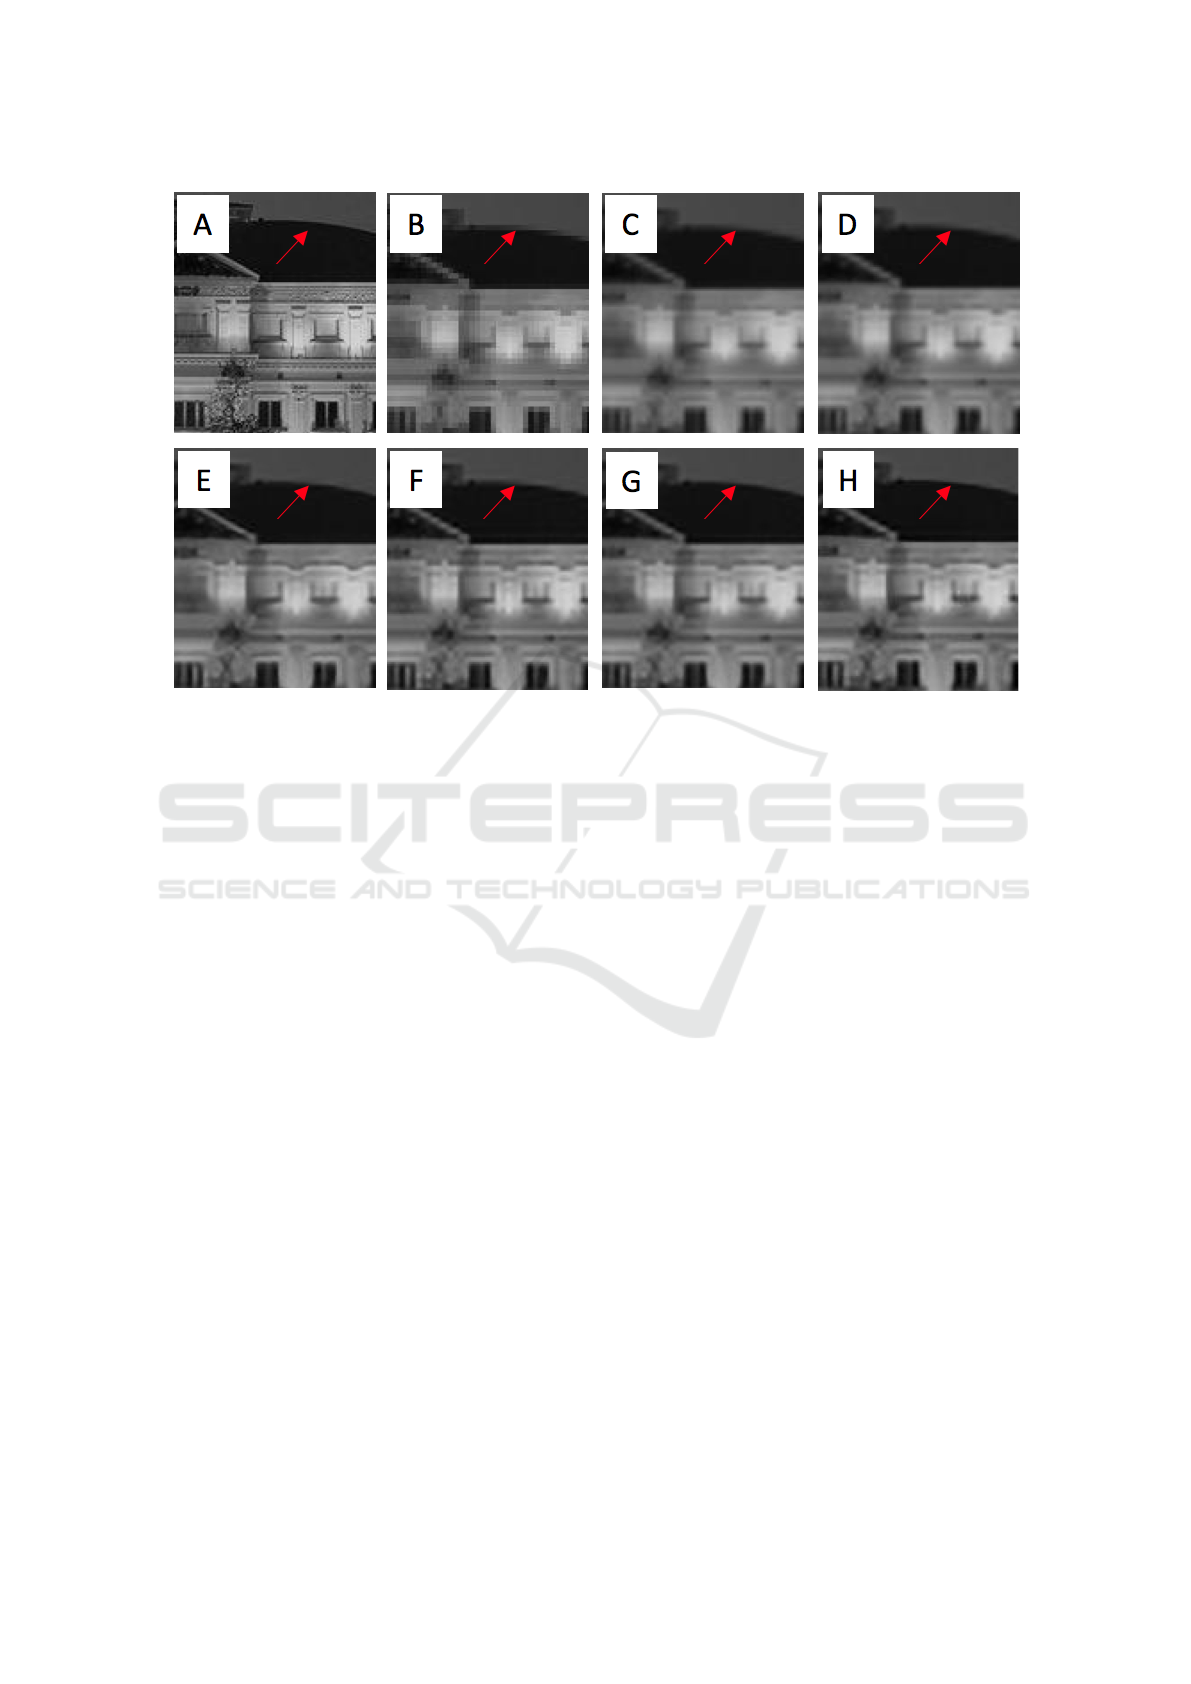
Figure 10: Result showing a portion of result image. A) Ground Truth, B) Nearest neighbor (SSIM=0.490), C) Bilinear
(SSIM=0.509), D) Bicubic (SSIM=0.525), E) Kim et al. (SSIM=0.542), F) Yang et al. (SSIM=0.538), G) Zeyde et al.
(SSIM=0.546), H) Proposed (SSIM=0.668).
an application for digital image scaling.
Wang, Z., Bovik, A. C., Sheikh, H. R., and Simoncelli, E. P.
(2004). Image quality assessment: from error visibil-
ity to structural similarity. Image Processing, IEEE
Transactions on, 13(4):600–612.
Wright, J., Ma, Y., Mairal, J., Sapiro, G., Huang, T. S., and
Yan, S. (2010). Sparse representation for computer vi-
sion and pattern recognition. Proceedings of the IEEE,
98(6):1031–1044.
Yang, J., Wright, J., Huang, T. S., and Ma, Y. (2010). Image
super-resolution via sparse representation. Image Pro-
cessing, IEEE Transactions on, 19(11):2861–2873.
Zeyde, R., Elad, M., and Protter, M. (2012). On single im-
age scale-up using sparse-representations. In Curves
and Surfaces, pages 711–730. Springer.
Zhang, L., Zhang, L., Mou, X., and Zhang, D. (2011).
Fsim: a feature similarity index for image quality as-
sessment. Image Processing, IEEE Transactions on,
20(8):2378–2386.
Super-resolution based on Edge-aware Sparse Representation Via Multiple Dictionaries
47
