
Patient Distraction and Entertainment System for Magnetic
Resonance Imaging using Visual Effects Synchronized to the
Scanner Acoustic Noise
Refaat E. Gabr and Ponnada A. Narayana
The University of Texas Health Science Center at Houston (UTHealth), Houston, TX, U.S.A.
Keywords: Patient Distraction, Magnetic Resonance, Gradient Coils, Acoustic Noise, Entertainment, Visualization,
Multisensory.
Abstract: Acoustic noise is a major source of discomfort for patients undergoing magnetic resonance imaging (MRI)
examination. Loud noise is generated from fast gradient switching during MRI scanning. The noise level is
reduced by wearing hearing protection devices, but the noise cannot be entirely avoided. Patient distraction
techniques can shift the attention away from the annoying noise. We implemented a simple and low-cost
system for patient distraction using visual effects that are synchronized to the gradient acoustic noise. This
multisensory approach for patient distraction is implemented on a 3.0T scanner and tested in six healthy
adult volunteers. After the scan was completed, the volunteers were asked about their scan experience with
visualization, rating their preference on a 0-10 scale. The images were visual inspected for any artifacts. All
volunteers indicated improved experience with the proposed visualization system with an average score of
6.3. The image quality was not affected by visualization.
1 INTRODUCTION
Magnetic resonance imaging (MRI) is a powerful
diagnostic technique, with approximately 60 million
scans performed worldwide each year (Sutton et al.,
2008). MRI provides excellent soft tissue contrast
without using ionizing radiation, making it a
preferred technique among many patient
populations, including children. Unfortunately, the
MRI environment suffers from multiple factors that
make it less patient friendly. These include the
confined environment inside the magnet bore and
the loud acoustic noise generated by the scanner.
Acoustic noise in MRI arises from the rapid
alterations in the current flowing in the gradient
coils when executing an imaging protocol. The large
currents in the presence of the strong magnetic field
produce large Lorentz forces, which cause the
vibrations of the gradient coils. The vibrations
generate loud tapping, knocking, or chirping sounds
(McJury and Shellock, 2000).
Acoustic noise can reach dangerous levels, with
the sound pressure level exceeding 100 dB(A)
(Counter et al., 2000; Price et al., 2001), where the
units dB(A) account for the frequency-dependence
of the human ear. Earplugs, headphones, and active
noise cancellation (McJury et al., 1997) can
significantly reduce the noise level and improve
hearing protection and patient safety (Brummett et
al., 1988). However, acoustic noise is not completely
avoidable, and noise remains a factor that adversely
affects the patient experience in MRI (McNulty and
McNulty, 2009).
A recent approach to reduce the perceived noise
it to play the gradient pulses in a fashion that
produces music (Ma et al., 2015). This approach can
improve the patient experience, but requires special
programming requirements to change the way MRI
pulse sequences are performed. This is beyond the
reach of most MRI centres.
The loud noise of MRI represents an intense
auditory stimulus. However, the intensity of a
sensory stimulus is one of multiple factors that
determine the tolerance of that stimulus. The
perception of the stimulus also depends on the
presence of other stimuli in the environment, and on
the multisensory integration capabilities of the brain
(Macaluso and Driver, 2005; Shimojo and Shams,
2001; Stein et al.. 2009; Witten and Knudsen, 2005).
Hence, the perception of the loud noise of MRI can
Gabr, R. and Narayana, P.
Patient Distraction and Entertainment System for Magnetic Resonance Imaging using Visual Effects Synchronized to the Scanner Acoustic Noise.
DOI: 10.5220/0005680503190323
In Proceedings of the 11th Joint Conference on Computer Vision, Imaging and Computer Graphics Theory and Applications (VISIGRAPP 2016) - Volume 3: VISAPP, pages 319-323
ISBN: 978-989-758-175-5
Copyright
c
2020 by SCITEPRESS – Science and Technology Publications, Lda. All rights reserved
319
be modulated by the introduction of other sensory
inputs (Gillies et al., 2013). Multisensory studies
suggest that vision dominates our sensory input and
can bias the perception of other stimuli (Witten and
Knudsen, 2005). We investigated whether visual
effects in the form of animated graphics that are
synchronized with the scanner acoustic noise could
change the patient’s perception of the loud noise of
the scanner. Moreover, by using pleasing and
engaging visual effects, this approach may provide
an entertaining environment that could further
improve the patient comfort and experience.
In this paper we describe the implementation of a
novel, simple, low-cost, and practical patient
distraction system based on audio-visual integration,
and demonstrate its performance in a clinical MRI
system.
2 METHODS
2.1 System Setup
All developments were carried out on a 3.0 T Philips
Ingenia MRI system (Philips Healthcare, Best, The
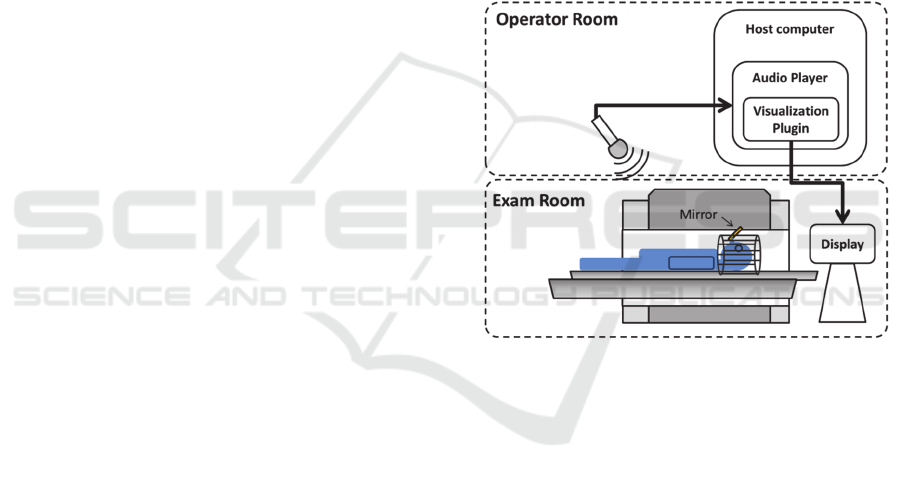
Netherlands). Figure 1 shows the schematic of the
patient distraction and entertainment setup.
A sensitive microphone is placed in the MRI
operator room adjacent to the MRI examination
room. The MRI scanner’s noise is picked up by the
microphone and is fed as the input audio signal to a
music player with sound-modulated visualization
capabilities. The visualization is projected back to a
display monitor placed at one end of the scanner
magnet. The display is projected to the patient eyes
using a system of mirrors mounted on top of the
head coil. MRI-compatible goggles, if available, can
be used in place of the display monitor and the
mirrors.
The Winamp media player software v5.666
(Nullsoft Inc., available at www.winamp.com) was
used to play the input noise signal from the
microphone. Other players with comparable
functionality can be similarly used. Winamp
includes multiple visualization plugins, including
MilkDrop 2 (www.geisswerks.com/milkdrop),
which was used in all experiments in this work.
MilkDrop is a hardware-accelerated environment for
running visualization routines (called presets)
defined by a scripting language.
A large number of visualization routines are
available in MilkDrop. However, not all routines are
suitable for use with patients. Based on
experimentation we identified the following criteria
for an MRI-friendly visualization routine. First, the
visualization routine must be reasonably responsive
to the audio signal such that the patient can easily
associate the animation with the acoustic noise.
Second, the routine must use an eye-friendly color
scheme, avoiding very bright colors. Third, the
routine should avoid very rapid transitions. Finally,
the routine should contain entertaining animations
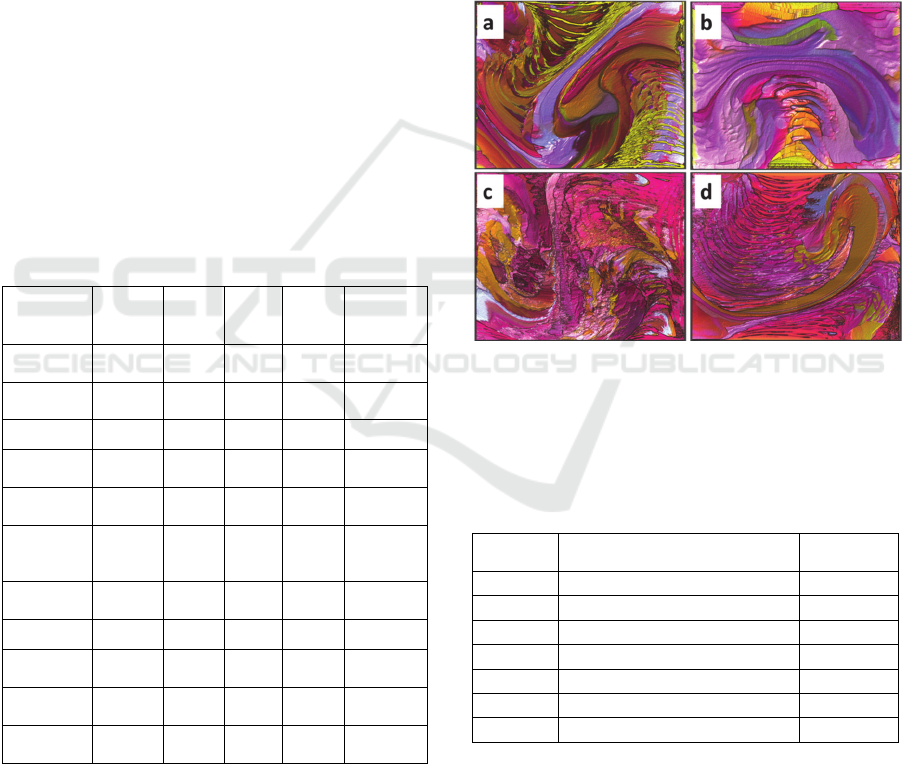
that engage the patient. Based on a consensus of the
authors and two MRI technologists, the visualization
routine selected in this work was the “Flexi, martin
+ geiss - dedicated to the sherwin maxawow”. This
preset displays a two-dimensional color-changing
flowing pattern which is modulated by the input
audio signal. This preset satisfied all the four criteria
we identified for a patient-friendly visualization
routine (Fig. 2).
Figure 1: The MRI acoustic noise-synchronized
visualization system. The mirror mounted on the head coil
helps the patient to view the display.
2.2 MRI Experiments
Six healthy adult volunteers (5 males, 1 female, age
= 42±13 years) participated in this study. The
volunteers were told that they will be watching
video material during the scan, but no clue was
provided about how the visualization worked or that
it was triggered by sound.
All six subjects were scanned twice using the
same protocol but with the visualization feedback
used in only one imaging session. Imaging in the
two sessions used a routine MRI brain protocol
including a survey scan, field calibration scan,
diffusion weighted imaging (DWI), three-
dimensional magnetization-prepared T1-weighted
(3D T1), multi-slice dual-echo turbo spin echo (2D
TSE) and multi-slice fluid-attenuated inversion
recovery (2D FLAIR) pulse sequences. These scans
VISAPP 2016 - International Conference on Computer Vision Theory and Applications
320
are typically used in routine clinical examination.
The total scan time for each imaging session was
~16 min. Note that the intensity and the pattern of
the scanner noise directly depend on the type of the
pulse sequence used and its scan parameters. The
scan parameters of all pulse sequences are listed in
Table 1.
Immediately after the imaging study, the
volunteers were asked whether they prefer the scan
with or without visualization, and were asked to rate
their preference on a scale from 0 to 10, with 0 being
no preference for either options (with or without
visualization), and 10 being highest preference. To
reduce possible bias on scoring, half of the subjects
underwent the visualization experiment in the first
part of the study, while the other half had the
visualization in the second part of the scan.
To investigate whether the visualization
feedback could increase the degree of volunteer
involuntary motion, corresponding image sets in the
two sessions were compared side-by-side for any
possible motion artifacts.
Table 1: The MRI protocol and the scan parameters used
in the study. GRE, gradient-recalled echo; SE, spin echo;
EPI, echo planar imaging; FOV, field-of-view; TR,
repetition time; TE, echo time; TI, inversion time.
Protocol
2D
Survey
2D
DWI
3D T1 2D TSE 2D FLAIR
Sequence
type
GRE
SE +
EPI
GRE SE SE
TR / TE
[ms]
11 / 4.6
5807 /
88
8.0 /
3.7
6800 /
(9.5, 90)
10,000 / 80
TI [ms] 800 NA 1068 NA 2600
Flip angle
[°]
15 90 6 90 90
FOV [mm] 300 x 300
240 x
240
256 x
256
256 x
256
256 x 256
Slice
Thickness
[mm]
10 3 1 3 3
Matrix 308 x 128
200 x
118
256 x
256
256 x
208
256 x 238
Plane 3-plane Axial Sagittal Axial Axial
Pulse train
length
64 59 256 12 16
b-value
[s/mm
2
]
NA 1000 NA NA NA
Scan time
[min:sec]
0:31 2:02 5:05 3:24 4:20
3 RESULTS
Figure 2 shows screenshots taken from the
visualization preset while playing out an MRI pulse
sequence. The visualization provided a sound-
responsive modulation of the flow pattern that is
pleasant for the observer. Table 2 lists the preference
and the scores reported by the six volunteers. All
volunteers preferred visualization, with average
score 6.3±1.2.
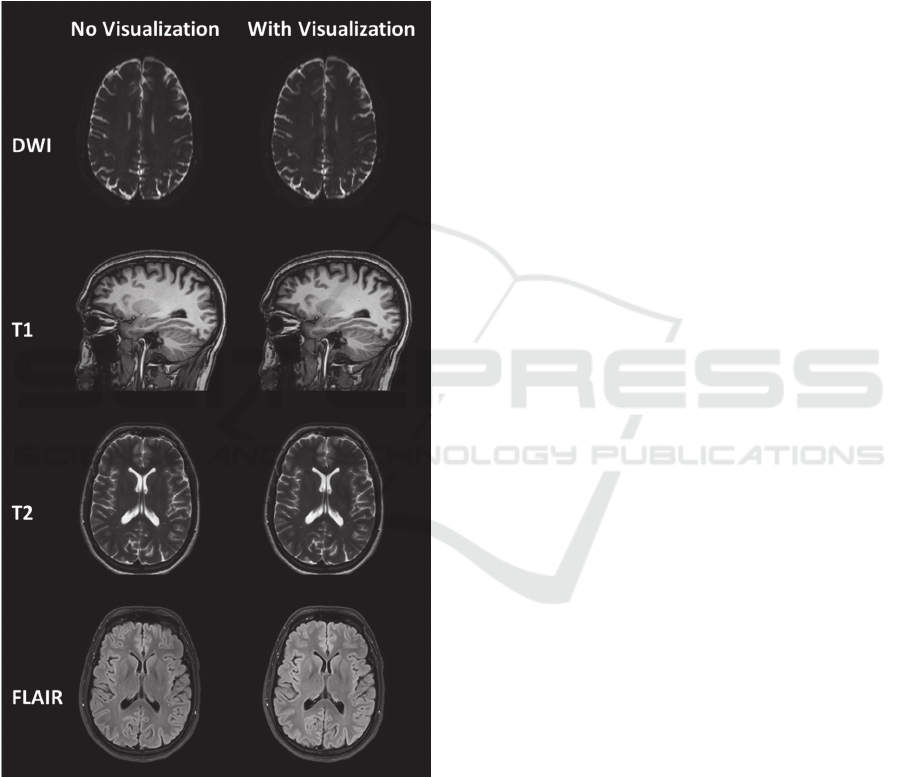
The images acquired in the two sessions (with
and without running the visualization) showed no
noticeable differences, indicating that the
visualization feedback did not affect the image
quality (Fig. 3). In one subject, motion artifacts were
observed on the dual echo scan as a result of patient
coughing in the middle of the scan. The scan was not
repeated.
Figure 2: Screenshots of the MRI acoustic noise-
synchronized visualization at four moments during the
execution of a T1 pulse sequence. The first two images
(a,b) are from a quiet period in the sequence, while the last
two (c,d) are recorded at a gradient-intensive period.
Table 2: Scores given by the volunteers for their scan
preference. 0=no preference, 10=most preference.
Volunteer Prefer Visualization? (Yes/No)
Score
[0-10]
1 Yes 7
2 Yes 5
3 Yes 8
4 Yes 5
5 Yes 7
6 Yes 6
All
6.3 ± 1.2
4 DISCUSSION
The high preference score reported by the volunteers
for the visualization indicates that visual effects
synchronized to the scanner’s acoustic noise
Patient Distraction and Entertainment System for Magnetic Resonance Imaging using Visual Effects Synchronized to the Scanner Acoustic
Noise
321
improved the patient experience during MRI
examination. All volunteers indicated that they were
entertained by the visualization. One volunteer
indicated that the visualization kept him awake
during the study when in fact he preferred to take a
nap. This case demonstrates that the visualization
may not be suitable for all subjects and that it is
better suited for certain categories of patients. This
approach for patient distraction and entertainment
may be particularly beneficial for scanning children.
Figure 3: MRI images acquired from one volunteer with
and without the visualization. No differences in image
quality are observed between the two datasets.
All experiments were performed with a single
visualization routine for the relatively short 16-min
scan. Nevertheless, one volunteer expressed that
after approximately five minutes the visualization
scheme was not as entertaining as it was at the
beginning of the study. Multiple and interleaved
routines should thus be incorporated and cycled
through in the visualization program to prevent
boredom from longer scans.
Very bright colors or rapid animations
corresponding to periods of fast-switching gradients
may be startling to the patient and cause involuntary
motion. We did not notice any effect on the image
quality from turning on the visualization routine
used in this preliminary study. A larger study is
recommended to study the effect of this technology
on patient motion with different types of
visualization routines.
The developed system for patient distraction and
entertainment in MRI is a simple, low-cost (costs
only the price of a sensitive microphone), and easy
to build around any MRI system without the need
for specialized pulse sequences. MRI-compatible
display monitors or goggles are required in this
approach. However, MRI-compatible display
monitors are widely available in many MRI suites as
they are needed for functional MRI studies.
We anticipate that optimized or even patient-
customized visualization routines may further
improve the patient experience and reduce the level
of anxiety associated with MRI procedures. These
possibilities will be explored in future studies.
ACKNOWLEDGEMENTS
This work was supported by a CTSA grant from the
National Center for Advancing Translational
Sciences of the National Institutes of Health under
Award Number UL1TR000371, awarded to The
University of Texas Health Science Center at
Houston, and the Chair in Biomedical Engineering
Endowment Funds.
The authors thank Vipulkumar Patel and Corina
Donohue for valuable technical assistance in
conducting the MRI experiments.
REFERENCES
Brummett, R. E., J. M. Talbot, and P. Charuhas. 1988.
“Potential Hearing Loss Resulting from MR Imaging.”
Radiology 169(2):539–40.
Counter, S. A. et al. 2000. “Analysis of Magnetic
Resonance Imaging Acoustic Noise Generated by a
4.7 T Experimental System.” Acta oto-laryngologica
120(6):739–43.
Gillies, Murray Fulton, Raymond Van Ee, Van Elswijk,
Gijs Antonius Franciscus, and Tim Johannes Willem
VISAPP 2016 - International Conference on Computer Vision Theory and Applications
322

Tijs. 2013. “System and Method for Distraction of
Patient During Scanning.” U.S. Patent Application
13/988,538.
Ma, Dan et al. 2015. “Music-Based Magnetic Resonance
Fingerprinting to Improve Patient Comfort during
MRI Examinations.” Magnetic Resonance in Medicine
doi: 10.1002/mrm.25818. [Epub ahead of print].
Macaluso, Emiliano, and Jon Driver. 2005. “Multisensory
Spatial Interactions: A Window onto Functional
Integration in the Human Brain.” Trends in
Neurosciences 28(5):264–71.
McJury, M., R. W. Stewart, D. Crawford, and E. Toma.
1997. “The Use of Active Noise Control (ANC) to
Reduce Acoustic Noise Generated during MRI
Scanning: Some Initial Results.” Magnetic Resonance
Imaging 15(3):319–22.
McJury, Mark, and Frank G. Shellock. 2000. “Auditory
Noise Associated with MR Procedures: A Review.”
Journal of Magnetic Resonance Imaging 12(1):37–45.
McNulty, J. P., and S. McNulty. 2009. “Acoustic Noise in
Magnetic Resonance Imaging: An Ongoing Issue.”
Radiography 15(4):320–26.
Price, David L., Janet P. De Wilde, Annie M. Papadaki,
Jane S. Curran, and Richard I. Kitney. 2001.
“Investigation of Acoustic Noise on 15 MRI Scanners
from 0.2 T to 3 T.” Journal of Magnetic Resonance
Imaging 13(2):288–93.
Shimojo, S., and L. Shams. 2001. “Sensory Modalities Are
Not Separate Modalities: Plasticity and Interactions.”
Current Opinion in Neurobiology 11(4):505–9.
Stein, Barry E., Terrence R. Stanford, and Benjamin A.
Rowland. 2009. “The Neural Basis of Multisensory
Integration in the Midbrain: Its Organization and
Maturation.” Hearing Research 258(1-2):4–15.
Sutton, Richard et al. 2008. “Safety of Magnetic
Resonance Imaging of Patients with a New Medtronic
EnRhythm MRI SureScan Pacing System: Clinical
Study Design.” Trials 9:68.
Witten, Ilana B., and Eric I. Knudsen. 2005. “Why Seeing
Is Believing: Merging Auditory and Visual Worlds.”
Neuron 48(3):489–96.
Patient Distraction and Entertainment System for Magnetic Resonance Imaging using Visual Effects Synchronized to the Scanner Acoustic
Noise
323
