Discovering Communities of Similar R&D Projects
Martin V´ıta
NLP Centre, Faculty of Informatics, Botanick´a 68a, 602 00, Brno, Czech Republic
Keywords:
Document Similarity, Latent Semantic Analysis, Community Discovery, Eigenvector Centrality.
Abstract:
Datasets about research projects contain knowledge that is valuable for several types of subjects working in the
R&D field – including innovative companies, research institutes and universities even individual researchers
or research teams, as well as funding providers. The main goal of this paper is to introduce a software tool
based on a reusable methodology that allows us to deal with similarity of projects in order to group them and
provide a deeper insight into a structure of considered set of projects in a visual way. In our approach we use
several concepts developed in social network analysis.
1 INTRODUCTION
Successful cooperation in R&D requires up-to-date
knowledge about the state in the particular field from
different perspectives – including reports about re-
search projects, research teams and companies in-
volved. Research teams preparing a new project pro-
posal are interested in information concerning insti-
tutions and teams working on similar problems, suc-
cessfully completed projects and projetcs in progress.
Policy makers are interested in condensed informa-
tion about the orientation of research financed from
public sources. Data about researchers participating
on certain groups of projects are interesting for HR
departments of innovative companies in order to build
talent pools.
The main goal of this work is to develop a hand-
ful software tool based on a reusable methodology
for exploring the structure of a given collection of
projects with respect to their content similarity (affin-
ity). Since project descriptions are stored in a tex-
tual form, it can be considered as a text mining issue.
Hints of the implementation in
R
are included in this
paper.
Our basic requirement is simplicity and reusability
in practice and opportunity of easy implementation
using standard packages/libraries for text mining and
visualzation (in
R
or Python). Hence we also do not
deal with explicit knowledge artifacts like ontologies
in the manner presented in (Ma et al., 2012).
2 METHODOLOGY
The key steps of our work are summarized in the out-
line in the next subsection. This approach is inspired
by the work (Trigo and Brazdil, 2014) and (Brazdil
et al., 2015) but it differs in the following two aspects:
• Domain – we are obtaining an affinity graph
where nodes are projects, since in (Trigo and
Brazdil, 2014) and (Brazdil et al., 2015) deal with
researchers,
• Using LSA – computation of similarity/affinity
among projects is improved by the latent seman-
tic analysis that provides a particular solution of a
problem of synonymy and a problem of similarity
of text snippets describing similar things by dif-
ferent words (i. e. with a low or zero number of
common words.
Feasibility of LSA – and text mining approaches
in general – for detecting similarity between patent
documents and scientific publications was discussed
in (Magerman et al., 2010). We would also point out
that these steps can be naturally embedded into a stan-
dard data mining methodologies such as CRISP-DM
(Wirth and Hipp, 2000).
Outline of Our Approach
1. Creating a corpus – collection of text documents
(“profiles of projects”) – and obtaining their vec-
tor representations
2. Computing the dissimilarity matrix using LSA
3. Discovering communities of similar projects
460
Víta, M..
Discovering Communities of Similar R&D Projects.
In Proceedings of the 7th International Joint Conference on Knowledge Discovery, Knowledge Engineering and Knowledge Management (IC3K 2015) - Volume 3: KMIS, pages 460-465
ISBN: 978-989-758-158-8
Copyright
c
2015 by SCITEPRESS – Science and Technology Publications, Lda. All rights reserved

4. Visualization of the similarity graph
5. Identifying important projects in the similarity
graph
2.1 Creating the Corporus
In our approach, each project is represented by its ti-
tle, keywords and its abstract (summarized aims of
the project etc.). Obviously, the process of gathering
these data depends on the used source. For extract-
ing mentioned fields from webpages, different tech-
niques of parsing html code can be employed (in
R
environment, the
XML
package can be usually success-
fully used, other approaches may use XSLT transfor-
mations etc.)
Textual data representing a single projects form
plaintext files, i. e. the set of considered projects is
1-1 mapped onto a collection of plaintext files. A se-
quence of standard preprocessing issues is performed
after tokenizations of these texts. It contains:
1. Transformation to lowercase
2. Punctuation removal
3. Numbers removal
4. Stopwords removal
5. Whitespace stripping
This sequence seems to be sufficient for English
textual data – probably the most typical case. In a case
of dealing with highly inflected fusional languages,
there is a need for application of standard NLP proce-
dures such as lemmatization or stemming.
The collection of preprocessed texts is turned into
a term-documentvector representation, i. e. we obtain
a term-document matrix (TDM). The tf-idf weighting
is used (Feldman and Sanger, 2007) and words shorter
than 3 characters are not taken into the account.
2.2 Computing the Dissimilarity Matrix
using LSA
Unlike the approach presented in (Brazdil et al.,
2015), the similarity among document is not com-
puted directly from the TDM using cosine similarity,
but at first, the TDM matrix is decomposed using la-
tent semantic analysis (LSA for short).
In TDM, rows represent unique words, columns
represent documents. LSA is a method for lower-
ing the rank of this matrix
1
– since TDM is usually
very sparse – based on a singular value decomposition
(SVD). SVD has a solid linear algebraic backgroud.
1
Using LSA in information retrieval context is some-
times called latent semantic indexing (LSI).
Having a term-document matrix M, the LSA process-
ing computes its rank-k approximation M
k
, where k
is a chosen number of factors, called latent seman-
tic dimensions. The value of k is usually between
100 and 300 and it is chosen empirically, (Rehurek,
2008). The number of dimensions have to be big-
ger than the number of documents involved. In this
contribution we omit the mathematical form, since
it is deeply studied and described in literature. We
point out only the basic idea: LSA is a technique that
maps documents into the space of latent semantic di-
mensions, whereas words that are semantically simi-
lar (measured by the ratio of co-occurances in docu-
ments) are mapped into same dimensions and words
semantically different into different dimensions. So,
instead of dealing with a matrix “word × document”
we have a matrix “concept × document”, where the
number of concepts is just the latent semantic dimen-
sion. For our purposes, LSA has two main – closely
related – advantages: it can handle synonymy and it
can be used for computing similarity of documents
that have similar content but low number of common
words.
The LSA decomposition of our TDM is computed
using standard packages that are available for all
major programming or data manipulation languages.
The dissimilarity matrix is obtained by cosine simi-
larity from matrices of LSA process (paricularly from
S
i
k
·V
T
k
, where M
k
= U
k
· S
k
·V
T
k
; for notation and detail
explanation see (Rehurek, 2008)).
From dissimilarity matrix we can find out the sim-
ilarity of all pairs of considered projects. Values are
truncated to two digits and those lower than a certain
threshold are considered as irrelevant and set to zero.
2.3 Discovering Communities of Similar
Projects
The dissimilarity matrix can be regarded as an ad-
jacency matrix of a (similarity) graph – undirected
graph with weighted edges. The main aim of our work
is the discovery of communities, i. e. groups of simi-
lar projects (unlike hard clustering where each entity
is assinged to just only one cluster, in communities we
admit a situation when an entity belongs to more than
one community). From a graph theory point of view,
community is a densely connected subgraph. Com-
munity discovery is a common task in social network
analysis (Combe et al., 2010).
We use the Walktrap algorithm (Pons and Lat-
apy, 2006) for detecting communities. This algo-
rithm is based on the idea that short random walks
tends to stay in the same community (see manpage to
igraph
). The length of the random walk k is a param-
Discovering Communities of Similar R&D Projects
461

eter of the algorithm – after experiments we have cho-
sen k = 4. Roughly said, shorter ones lead to “bigger
amount of communities consisting of smaller number
of nodes”, whereas longer paths lead to “a small num-
ber of big communities”. In
igraph
implementation
of Walktrap algorithm, k = 4 is set as a default value.
To each node (project) a set of idents of communi-
ties is assigned. Results of Walktrap algorithm can be
provided also in a form of a dendrogram.
2.4 Visualization of the Similarity
Graph
Visualization of graph-like data is a traditional task,
hence many tools are available for this purpose. In
our setting, we are going to visualize a graph repre-
sented by the adjacency (similarity) matrix. Nodes
correspond with projects and the thickness of the edge
connecting two nodes (projects) is proportional to the
similarity value. Communities are bounded by shapes
in the background.
2.5 Identifying Typical Projects in the
Given Set
For identifying important nodes in a social network
several measures of centrality, such as degree central-
ity, betweenness centrality or eigenvector centrality
have been introduced (Ruhnau, 2000). Since we deal
with graph structures, we can apply them also in our
setting.
In order to select typical projects of a given set
we use the eigenvector centrality. We are going to
demonstrate the idea behind this measure in the orig-
inal social network setting: the person is more central
if it is in relation with other persons that are them-
selves central, therefore the centrality of a given node
does not only depend on the number of its adjacent
nodes, but also on their value of centrality. Trans-
forming this idea into our “project-similarity environ-
ment”, projects with a high eigenvector centrality are
similar with a big number of projects that are them-
selves similar to many projects – hence we can treat
them as characteristic representatives of a given set.
From the opposite point of view, low values of be-
tweenness centrality indicate that a given project is an
outlier in the sense of similarity.
The computation of eigenvector centrality is based
on eigenvalues of the adjacency matrix and it can be
found in (Ruhnau, 2000) or (Bonacich, 1972). Again,
these computations are implemented in relevant pro-
gramming and data manipulation languages including
R
or Python.
3 EXAMPLES OF RESULTS AND
POSSIBLE INTERPRETATION
At this “proof-of-concept” stage, this methodology
was applied on a real-world data, particularly on the
data about research projects funded by public sources
of the Czech Republic. This choice was done because
of simplicity of obtaining the data in a suitable for-
mat. All research projects funded by any of public
providers in the Czech Republic have to be registered
in the ISVAV system (Information System of the Re-
search, Experimental Development and Inovations)
2
run by the Czech authorities. It gathers information
about all the R&D projects from the mid 90th and cur-
rently contains data about more than 42 000 projects.
This system providesa web interface for querying and
filtering by different criteria. Results can be easily ex-
ported in the form of zipped HTML files containing a
single HTML table with the considered items (data
and metadata of projects). For purposes of this paper
it is also an advantage that these data sets are probably
not known to a wide community, hence it constitutes
a good source for experiments in data explorations.
As an example we have chosen innovative and
research projects in the Informatics, Computer Sci-
ence branch being solved during the year 2014. This
dataset contains 157 projects. An example of content
of one plaintext file – project (ident: TA02010182,
title: “Inteligent library - INTLIB”) – is provided
below:
Intelligent Library - INTLIB / processing
of technical data - self-learning system -
ontologies - data semantics - Linked Data
/ The aim of the project is creation of a
certified methodology and a self-learning
system for processing of semantics of
technical documents and respective semantic
searching. In particular we will focus
on processing of legislative documents and
documents from the area of environment. We
will utilize and connect results from areas of
linguistics, data mining, databases, Linked
Data, user interfaces etc. and we will
create a SW that will have both theoretical
background and practical application.
3.1 Selected Features of the
Implementation
The implementation was done within the
R
environ-
ment. Widely known libraries
tm
,
lsa
and
igraph
2
http://www.isvav.cz
KITA 2015 - 1st International Workshop on the design, development and use of Knowledge IT Artifacts in professional communities and
aggregations
462
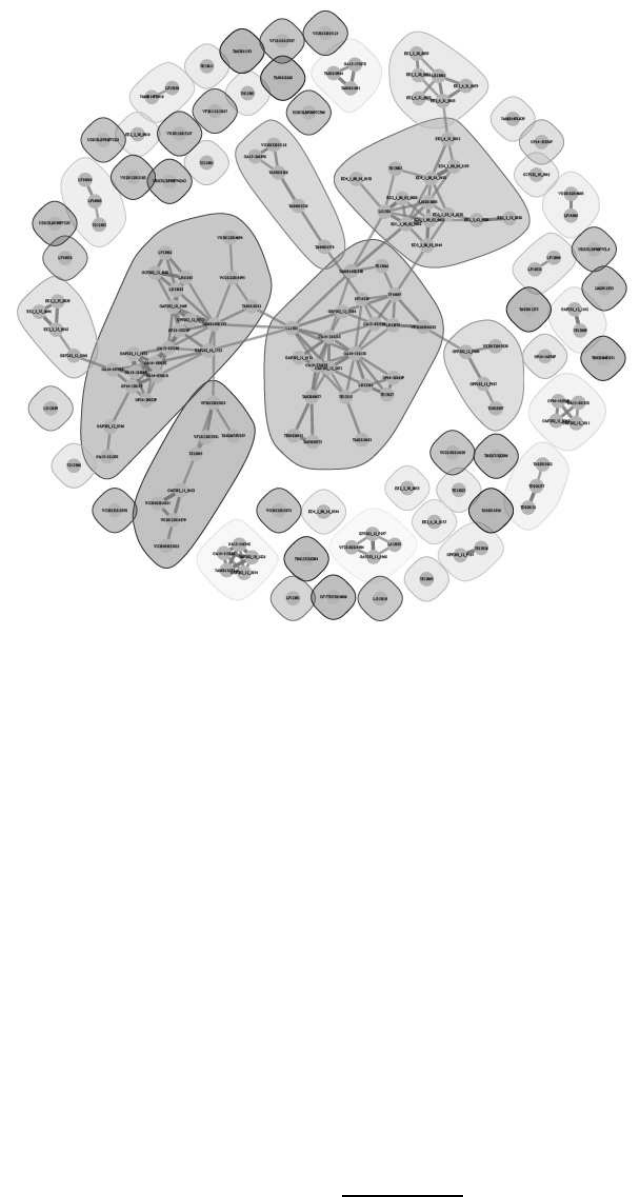
Figure 1: Overview of the projects space.
were used. The whole code without preprocessing
scripts contains less than 100 lines of code.
Key functions used are:
•
Corpus
– from package
tm
– for creating a corpus
from text files in a given directory
•
lsa
– from package
tm
– for constructing LSA
space
•
walktrap.community
– from package
igraph
–
for computing communities
•
evcent
– from package
igraph
– for obtaining
the eigenvector centrality of each node.
The overall result with marked communities can
be observed on Figure 1, due to high number of el-
ements it serves for getting the first impression and
in practice it is reasonable to manipulate with it in an
interactive way in colored mode. Marked communi-
ties correspond with different disciplines of informat-
ics/computer science/IT.
For instance, project TA02010182 belong to
a three element community containing project
TD020277 (title: “Public sector budgetary data in the
form of Open Data”, keywords: Public sector - Open
Data - Linked Open Data - public sector budgetary
data) and project TD020121 (title: “Publication of
statistical yearbook data as Open Data”, keywords:
Linked open data - public pension statistics - presen-
tation of data - predictive modelling - data transfor-
mation - public administration - Open Government)
3
.
Roughly said, this community can be described as
Linked Open Data group.
After obtaining the similarity graph, according to
our methodology, we have computed the eigenvector
similarities for each node (project) and selected top-5
of them. In our case, top five projects having the high-
est eigenvector similarities are focused on algorithms,
graphs and complexity (on figure they all belong to
the left big community):
1. GA14-10003S – Restricted computations: Algo-
rithms, models, complexity
2. GA13-03538S – Algorithms, Dynamics and Ge-
ometry of Numeration systems
3. GA14-03501S – Parameterized algorithms and
kernelization in the context of discrete mathemat-
3
The projects can be inspected using ISVAV:
http://www.isvav.cz/projectDetail.do?rowId=ABC, where
ABC stands for the ident of the project, e. g. TD020121
Discovering Communities of Similar R&D Projects
463
ics and logic
4. GA13-21988S – Enumeration in informatics and
optimization
5. GP14-13017P – Parameterized Algorithms for
Fundamental Network Problems Related to Con-
nectivity
According to the meaning of the experts, these
fields belong to priorities in computer science in the
Czech Republic.
4 CONCLUSION AND FURTHER
WORK
We have proposed a software tool for visualizing the
structure of collections of research projects with re-
spect to their content similarity. The approach is
based on the application of latent semantic analy-
sis and it can be easily implemented in
R
or Python
language. The results are easy-to-understand im-
ages/graphs that provide a quick overview of the con-
sidered set of projects. In future, this visualization
tool
Communities of similar projects can be subse-
quently elaborated: reports in the form of lists of in-
stitutions/researchers participating on projects in the
community can be also generated.
The plans of further work contain development of
evaluation methods and improvements that concern
mainly:
• Experimenting with Different Representations of
Projects: in this experiment we use only titles,
keywords and abstracts. We will investigate the
influence of taking more textual data – full pro-
posals, descriptions of project results (abstract of
papers assigned to the project etc.)
• Other Methods of Calculating Similarity: when a
big corpus of textual data is available, we will use
word2vec model (Mikolov et al., 2013) for simi-
larity computations
• Enriching the Visualization by Additional Data:
the size of node can be proportional to the budget
of the project, opacity of the node can represent a
value of a certain centrality measure in the graph,
a classification of a project (fundamental/applied
research etc.) can be represented by different col-
ors
• Employing External Data Sources: in our work,
the edges represent content similarity. We can
also add an additional layer where edges (in
different color) will represent other connections
among projects (e. g. an edge can link a pair of
projects having a common institution as a partici-
pant).
4.1 Other Possible Applications
Application of the proposed tool is not limited only
to projects domain. Analogously it can be used for
patent proposals grouping etc. In R&D environment,
other possible applications are:
• Exploration of the structure of research institu-
tions: each institution can be represented as a
plaintext file containing titles, keywords and ab-
stracts of projects in which has the institution par-
ticipated
• Project reviewer matching and/or expert search:
in our setting it is not necessary that all enti-
ties are of the same type. We can analogously
together represent researchers (by lists of titles
of their publications and keywords as in (Trigo
and Brazdil, 2014)) and calculate mutual sim-
ilarities of type “researcher-project (proposal)”.
Researchers that have the highest similarity to a
given project proposal can be considered as poten-
tial reviewers (after satisfying possible constraints
such as “independence of researcher on the re-
viewed project”). This principle can be also ap-
plied for searching experts for a newly prepared
project.
REFERENCES
Bonacich, P. (1972). Factoring and weighting approaches
to status scores and clique identification. Journal of
Mathematical Sociology, 2(1):113–120.
Brazdil, P., Trigo, L., Cordeiro, J., Sarmento, R., and Val-
izadeh, M. (2015). affinity mining of documents sets
via network analysis, keywords and summaries. Oslo
Studies in Language, 7(1).
Combe, D., Largeron, C., Egyed-Zsigmond, E., and G´ery,
M. (2010). A comparative study of social network
analysis tools. In International Workshop on Web In-
telligence and Virtual Enterprises, volume 2, page 1.
Feldman, R. and Sanger, J. (2007). The text mining hand-
book: advanced approaches in analyzing unstruc-
tured data. Cambridge University Press.
Ma, J., Xu, W., Sun, Y.-h., Turban, E., Wang, S., and Liu,
O. (2012). An ontology-based text-mining method to
cluster proposals for research project selection. Sys-
tems, Man and Cybernetics, Part A: Systems and Hu-
mans, IEEE Transactions on, 42(3):784–790.
Magerman, T., Van Looy, B., and Song, X. (2010). Ex-
ploring the feasibility and accuracy of latent semantic
KITA 2015 - 1st International Workshop on the design, development and use of Knowledge IT Artifacts in professional communities and
aggregations
464
analysis based text mining techniques to detect simi-
larity between patent documents and scientific publi-
cations. Scientometrics, 82(2):289–306.
Mikolov, T., Chen, K., Corrado, G., and Dean, J. (2013).
Efficient estimation of word representations in vector
space. arXiv preprint arXiv:1301.3781.
Pons, P. and Latapy, M. (2006). Computing communities in
large networks using random walks. J. Graph Algo-
rithms Appl., 10(2):191–218.
Rehurek, R. (2008). Semantic-based plagiarism detection.
Ruhnau, B. (2000). Eigenvector-centralitya node-
centrality? Social networks, 22(4):357–365.
Trigo, L. and Brazdil, P. (2014). Affinity analysis between
researchers using text mining and differential analysis
of graphs. ECML/PKDD 2014 PhD session Proceed-
ings, pages 169–176.
Wirth, R. and Hipp, J. (2000). Crisp-dm: Towards a stan-
dard process model for data mining. In Proceedings of
the 4th International Conference on the Practical Ap-
plications of Knowledge Discovery and Data Mining,
pages 29–39. Citeseer.
Discovering Communities of Similar R&D Projects
465
