Building a Tool for Analyzing Interactions in a Virtual Learning
Environment
Leticia Rocha Machado, Magali Longhi and Patricia Behar
Federal University of Rio Grande do Sul, Paulo Gama Avenue,
110 - Building 12105-3 floor room 401 Cep: 90040-060, Porto Alegre (RS), Brazil
Keywords: Interactions, Virtual Learning Environment, Social Map.
Abstract: This article presents the development of the framework Social Map, implemented in a virtual learning
environment (VLE). The tool aims at mapping the interactions of the participants of a course in the form of
graphs or sociograms. The methodology used was descriptive, theoretical, and practical and the graphs
generated from the interactions of two undergraduate classes and one continuing education course were
analyzed. Data from the Social Map, and a punctual analysis of the interactions and relationships, enabled
the teachers to rethink educational activities in VLEs. Based on the indicators obtained from the map, the
aim is to build more consistent teaching practices for activities in the virtual, especially concerning the
social aspects. It is also a way to highlight peculiarities hitherto little-discussed regarding distance
education.
1 INTRODUCTION
This article aims to present the development of the
framework Social Map, which shows, in graphs,
information concerning student interactions obtained
in a virtual learning environment (VLE) know as
ROODA.
The research has an interdisciplinary character as
it brings together the fields of Sociology,
Information Technology, and Education. Piaget’s
ideas (1973, 2005) laid the foundations for the study
of social interactions in Education and underlie the
VLE used in this research. The investigation also
relies on Behar’s studies (2009, 2013) to understand
the process of teaching and learning in Distance
Education (DE) and the construction of teaching
strategies applied in the virtual. Regarding
sociology, the research draws on Moreno’s theory
(1954) when dealing with sociometric analysis,
known as the mapping process of interactions and
presented as sociograms.
Data processing contributes to the investigation
with regard to the concepts addressed in graph
theory (Wasserman, Faust, 1994) and the study of
techniques for computational implementation.
In this sense, studies in different areas of
knowledge subsidize the proposal of a
computational solution that tries to ensure,
particularly in the field of distance education,
teaching and learning that allows the teacher to get
sociometric information about students, for it
considers that such information should be taken into
account in the process of distance teaching and
learning
The research question of this study refers to the
way the teacher can view the student(s) VLE social
behavior(s). It proposes the building of a feature that
maps and presents, in the form of graph, the
interactions established by a particular student or a
group.
Thus, the investigation followed two lines of
work: one focused on the social aspects of
theoretical character and another on the planning,
implementation and validation of the framework
Social Map in the VLE. The project dedicated to the
development of the Social Map feature began in
2013 with the SocialAffective Research Group
(http://www.ufrgs.br/gpsocioafeto/) at the Federal
University of Rio Grande do Sul (UFRGS), Brazil..
This feature collects data from interactions held in
the VLE communications features, and presents as
sociograms relations between the actors of the
discipline and/or course. Sociograms are viewed
from the GraphViz tool, free software to represent
information in graphs. These graphs are presented to
Machado, L., Longhi, M. and Behar, P..
Building a Tool for Analyzing Interactions in a Virtual Learning Environment.
In Proceedings of the 7th International Joint Conference on Knowledge Discovery, Knowledge Engineering and Knowledge Management (IC3K 2015) - Volume 3: KMIS, pages 287-291
ISBN: 978-989-758-158-8
Copyright
c
2015 by SCITEPRESS – Science and Technology Publications, Lda. All rights reserved
287
the teacher in PDF or image formats that can later be
saved on the computer.
As for the theory, the social characteristics which
could be the basis for the development of the
research and the improvement of the Social Map
feature were discussed. In order to do so, Moreno's
ideas (1972) and the literature referring to the
distance mode (Behar, 2013; 2009) were used as
resources to list the features.
The evaluation and the improvement of the
digital resource considered the observation and
analysis of the social mapping resulting from the
tool application in two undergraduate and one
continuing education course.
To understand the trajectory used in the
construction of the Social Map tool, this paper
presents, in section 2, the theoretical framework.
Section 3 presents the methodology used in the
investigation. Section 4 includes the process of
implementation, validation and the results of the
Social Map. Finally, in section 5, the final
considerations are made
2 THEORETICAL
BACKGROUND
In distance education, the main protagonist of the
teaching and learning process is the student (Behar,
2009). For Piaget (2005), mutual respect, autonomy,
and cooperation are characteristics of a socially and
morally developed subject. These elements are built
along the stages of life promoted by interactions
with others, with objects, and with the environment.
Etymologically the term interaction (inter +
action) includes the concepts of reciprocity, in which
at least two elements (they do not need to be of the
same nature) are involved; and contact, an encounter
that causes changes in the participating elements.
For Piaget (1973) it is in the interactions that the
subjects will build knowledge, for “social life is one
of the essential factors in the formation and growth
of knowledge” (Piaget, 1973, p.17).
Interaction may constitute intrapersonal or
interpersonal level. The practice of conversation
(and social relations formed from it) supported by
digital technologies can be mistaken for a message
flow where there is not necessarily a conversation or
social interaction (often referred to as interactivity).
It is understood that interactions in technological
spaces are based on a dialogue that modifies the
subject, the other, their messages and their
interrelations (Longhi, 2011).
According to Moreno (1972), sociometry is the
mathematical study of the psycho-sociological
properties of the population by putting into practice
an experimental technique based on quantitative
methods. According to the author, sociometry is a
strategy for understanding the structure of a group.
One of the techniques of Sociometry is the
application of sociometric tests that enable the
visualization of the similarities and differences
between individuals that make up a group.
Investigating interpersonal relationships in groups,
Moreno (1972) found that there are two main ones:
the relationships of attraction and repulsion. From
these are drawn many others. For example, the
investigated subjects express: a) their choices
regarding the colleagues that would like (or not)
help to perform a certain activity; b) the colleagues
that do better (or worse) at playing a certain role in
the group. Based on their choices, the mutual
relations of the subjects investigated are identified
and presented as a graph, known as sociogram,
which, according to Moreno, reveals even the
“invisible”.
The sociogram shows the position occupied by
the individual in the group and the core of
relationships that form around him or her. This core
of relations is the smallest social structure that
Moreno defines as social atom (Moreno, 1972).
While certain social atoms are limited to individuals
who participate in it, some of these individuals can
relate to parts of other social atoms, and so on,
forming complex chains of interrelations, which the
author calls sociometric networks.
Then, through a sociogram, which is a structured
visual representation of a network, the social
position of each participant in a learning community
and the relationship with the rest of the group can be
seen. Through the choices made, it is possible to
determine who in the social atom is the most
privileged and those who exert reciprocity; which
individuals are rejected for not fulfilling reciprocity;
and which are isolated for not showing their
preferences.
Sociograms are graphical representations, in the
form of a network, of the relationships in a group of
individuals. More than one method of presentation,
sociograms constitute a method of exploration, as
they enable the identification of sociometric facts
and the structural analysis of a group.
Moreno (1972) defined a set of symbols
(geometric shapes, such as circles, triangles with
single or duplicate edges, and straight lines with
continuous or broken lines, presenting or not arrows
in red or black), manually drawn representing the
KMIS 2015 - 7th International Conference on Knowledge Management and Information Sharing
288
genre of the subjects investigated, the role in the
group, the attractions and the repulses, indifference
and unilateral or bilateral relations.
In the 1960s, Moreno’s sociogram incorporated
formalisms of graph theory which gave it a
mathematical rigor (Wasserman and Faust, 1994)
and it started to be described by computer
algorithms with graphical display on various
devices. Currently, sociograms are recognized as
social networking diagrams.
The network (or graph) consists of a finite set of
nodes of the actors (individuals, groups, or
organizations) and edges (or arcs) indicating the
connections among them. When reading a graph, the
main focus of analysis is the pattern of the
connections regarding the distance and physical
location of the nodes. Thus, the analysis of
sociograms enables the verification of how
individuals relate, the choices they make and the
reciprocity among them. The distance and physical
position of the participants provide information
about the leaders, the isolated ones, and the
subgroups (or social atoms). In this study, these
definitions were termed as social characteristics. The
definition of the social features demanded the need
to know the peculiarities of each VLE interaction
feature. The aim was to identify how each clue could
support the mapping of social relations. This way,
the primary features outlined are: Collaboration,
Popularity, Isolation, Mediation, Subgroups, Social
Detachment, and Indifference.
3 METHODOLOGY
The investigation starts from the problem of how to
map the social interactions in a VLE so as to display
them in the form of graphs (sociograms). The
research is characterized as descriptive, theoretical,
and practical as it dedicates to the (re)construction of
ideas and improvement of theoretical principles,
mainly those related to studies of sociometric
aspects (Moreno, 1972).
Thus, in order to meet the proposed objectives,
the study was developed in four stages, which were
carried out in a recursive sequence:
1) construction of the theoretical framework on the
themes: social aspects (Primo, 2008; Piaget,
1979) Sociometry (Moreno, 1972), educational
(Piaget, 1973; 2005; Sacerdote, Fernandes,
2013; Lima, Meirinhos, 2011) and Distance
Education (Behar, 2009);
2) planning and implementation of the Social Map
feature, whose interactions analysis module was
built in its own environment and the GraphViz
library (http://www.graphviz.org) was
incorporated into the display module;
3) validation of the Social Map feature in
undergraduate and continuing education courses
offered at UFRGS;
4) consolidation of the social characteristics based
on the theoretical framework and on the results
obtained in the application analysis. Such a step
may require improvements in the implemented
feature.
The Data collection instruments used were three:
a) participant observation; b) data collected through
the productions in the features of the VLE, and c)
graphs of the interactions generated by the
framework Social Map.
4 TRAJECTORY AND RESULTS
Data from this project are presented in the form of
graphs generated by the framework Social Map
where it was possible to analyze the social
interactions of students in two undergraduate
courses and one continuing education course in
addition to validating the developed resource.
The Social Map implemented in the ROODA
VLE is a feature that allows, from the interactions of
users in communication tools in the VLE, the
generation of sociograms where links, influences
and preferences present in the social group formed
by disciplines and courses can be identified. Such
feature is accessible in the moment, only to the
teacher of the course
The ROODA VLE allows various forms of
interaction among participants: through exchanges
of messages on forums, chat, or e-mail; comments
on the inclusion of materials in the library and
comments on certain forums messages, lessons and
activities. All these interactions are captured,
analyzed, and extracted in a text format file and then
sent to the Graphviz to generate the graph, which
enables us to see how interactions among
participants in a class, for example, can be seen.
In computational terms, the sociogram
construction process begins in a PHP class where the
constructor method established settings to generate
the social map. To this end, the following settings
must be supplied by the user:
• Analysis period: sets the length of time that
teachers want to see the interactions carried out;
• Colors of the participants: the teacher can specify
colors for each user profile (monitor/tutor,
teacher, and student). By default, the color
Building a Tool for Analyzing Interactions in a Virtual Learning Environment
289
orange represents teachers, lilac represents the
students, and gray represents the monitors (or
tutors);
• Interaction method: defines the type of
visualization of the interactions (bonds of a
participant with the class/group, all the students,
students and teachers, students and monitors, all
participants);
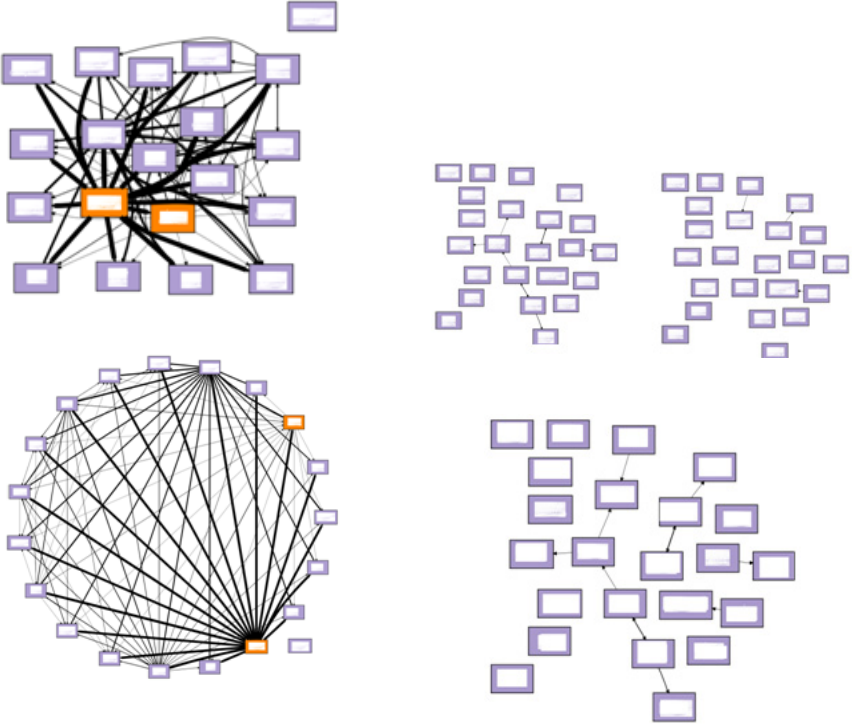
• Layout of the sociogram: depicts the format of
the sociogram. It has two types: graph showing
the interactions in a network (Figure 1) and
graph that shows the interactions in a circular
manner (Figure 2). The maps of Figures 1 and 2
were obtained from a distance course supported
by the ROODA VLE.
• Level of relevance: the teacher can assign
different levels of importance for each feature
analyzed. These important levels directly
influence the thickness of the edges that connect
the nodes. The levels range from “Not
applicable” to “extremely important”.
Figure 1: Layout of the Social Map in a network.
Figure 2: Layout of the Social Map in a circular shape.
For mapping the interactions, SQL queries to the
database where all the AVA information is stored in
physical tables are made. These SQL queries return
the data to the PHP class, which processes these data
and transforms them into information ready to be
displayed. Processing consists in counting the
interactions between users for features such as
forum, chat, contacts and comments on library
materials and webfolio. After this count, a text
description in DOT file is sent to GraphViz, which is
responsible for the generation of the graph,
according to the description.
The information analyzed always takes into
account the chosen class. Thus, the results in the
Social Map can be different for the same student,
when a different class is chosen.
Each tool analyzed receives an interaction
weight, which interferes with the thickness of the
lines connecting the nodes. In the case of a large
number of interactions, for example, the line width
is greater. This tells the teacher which students (and
monitors/tutors) had a greater number of interactions
during the selected period.
To improve the Social Map feature in the VLE,
the analysis of the interactions of two undergraduate
courses at UFRGS were used. One was offered in
the classroom mode (Figure 3) and the second in the
distance mode (Figure 4).
Figure 3: Classroom course.
Figure 4: Distance Course.
KMIS 2015 - 7th International Conference on Knowledge Management and Information Sharing
290
In Figures 3 and 4, nodes in orange represent the
students, the teachers are lilac and the
monitors/tutors are gray, for each discipline and/or
course.
In the Sociogram in Figure 3, taken from the
discipline taught in a classroom, the interactions are
directed to the classroom teacher, showing a lack of
interaction among students. In Figure 4, although
with a lower number of students, it is possible to
notice a larger number of interactions among
students themselves and between students and
teachers.
It should be noted that the evaluation of these
sociograms did not take into account the pedagogical
strategies undertaken by the course teachers, only
the graphical potential of the Social Map as a source
for teachers to examine and perhaps rethink their
courses. The extracted visual data suggest several
questions about the social interactions that take place
in VLEs.
Thus, the sociograms generated point to the need
for further investigations that include, in addition to
quantitative data, qualitative data in terms of social
relations in order to automatically display
possibilities for educational activities for teachers of
distance education. Therefore, new perspectives
suggest some improvements, as it will be presented.
5 FINAL CONSIDERATIONS
The present study showed the planning, the
development and the implementation of the Social
Map framework for the mapping of social
interactions. From the extracted data, the teacher can
analyze the possible social characteristics that are
present in interactions from the VLE communication
features.
For future research, the aim is to discuss and
develop, alongside the technological process,
pedagogical strategies that might help the teacher in
the pedagogical use of the Social Map. To improve
this framework, the following actions are being
taken: (1) building dynamic graphs in order to
improve the visualization of results; (2) inclusion of
new social features (or modifying existing ones) to
better understand the relationships that are formed in
a VLE; (3) studies to make available the maps for
the students; and (4) in computational terms,
performance and application studies in other
distance learning platforms;
The main contribution of this paper is to present
the Distance Education teacher information on some
social features that can be recognized in a virtual
learning environment. From the graphical view of
these characteristics, the pedagogical practices may
be redirected in order to individualize assistance to
students. The expansion of communication between
teacher and students is also envisaged as a
contribution.
REFERENCES
Almeida, L. 2011. Analisando Participação em Turmas de
Ensino a Distância Usando Análise de Redes Sociais,
Simpósios Nacionais de Tecnologia e Sociedade.
Bakharia, A., Dawson S. 2011. SNAPP: A Bird’s-Eye
View of Temporal Participant Interaction, Learning
Analytics and Knowledge.
Behar, P.A. 2009. Modelos Pedagógicos em Educação a
Distância, Porto Alegre, Artmed.
Behar, P.A. 2013. Competências na EAD, Porto Alegre,
Grupo A.
Gansner, E., Koutsofios, E., North, S. 2006. Drawing
graphs with GraphViz. Disponível em:
http://www.graphviz.org/Documentation/dotguide.pdf.
Lima, L., Meirinhos, M. 2011. Interacções em fóruns de
discussão com alunos do ensino secundário: uma
análise sociométrica. In: VII Conf. Internacional de
TIC na Educação.
Longhi, M. T.: 2011. Mapeamento de aspectos afetivos em
um ambiente virtual de aprendizagem, Doctoral thesis,
PPGIE/UFRGS, Porto Alegre, RS.
Moreno, J.L. 1972. Fundamentos de la Sociometria,
Buenos Aires, Paidós.
Piaget, J. 1973. Estudos Sociológicos, Rio de Janeiro,
Forense.
Piaget, J. 2005. Inteligencia y afectividad, Buenos Aires,
Aique Grupo Editor.
Primo A. (2008. Interação mediada por computador:
comunicação, cibercultura, cognição, Porto Alegre,
Sulina.
Rabbany, R., Takaffoli, M., Zaïane, 2011. Analyzing
participation of students in online courses using social
network analysis techniques, Proc. of Educational
Data Mining.
Romani, L. 2000. InterMap: Ferramenta para
Visualização da Interação em Ambientes de Educação
a Distância na Web, Masters dissertation,
IC/Unicamp.
Sacerdote, H.C.S., Fernandes, J.H.C. 2013. Investigando
as interações em um ambiente virtual de aprendizagem
por meio da análise de redes sociais, Inf. e Doc., v. 4,
n. 1.
Wasserman, S., Faust, K. 1994. Social network analysis:
methods and applications, Cambridge, Cambridge
University Press.
Willging, P.A. 2008. Técnicas para el análisis y
visualización de interacciones en ambientes virtuales,
REDES- Revista hispana para el análisis de redes
sociales, v.14,n.6.
Building a Tool for Analyzing Interactions in a Virtual Learning Environment
291
