Bayesian Logistic Regression using Vectorial Centroid for Interval
Type-2 Fuzzy Sets
Ku Muhammad Naim Ku Khalif and Alexander Gegov
School of Computing, University of Portsmouth, Portsmouth, PO1 3HE, U.K.
Keywords: Interval Type-2 Fuzzy Sets, Uncertainty, Defuzzification, Vectorial Centroid, Machine Learning, Bayesian
Logistic Regression, Human Intuition.
Abstract: It is necessary to represent the probabilities of fuzzy events based on a Bayesian knowledge. Inspired by
such real applications, in this research study, the theoretical foundations of Vectorial Centroid of interval
type-2 fuzzy sets with Bayesian logistic regression is introduced. This includes official models, elementary
operations, basic properties and advanced application. The Vectorial Centroid method for interval type-2
fuzzy set takes a broad view by exampled labelled by a classical Vectorial Centroid defuzzification method
for type-1 fuzzy sets. Rather than using type-1 fuzzy sets for implementing fuzzy events, type-2 fuzzy sets
are recommended based on the involvement of uncertainty quantity. It also highlights the incorporation of
fuzzy sets with Bayesian logistic regression allows the use of fuzzy attributes by considering the need of
human intuition in data analysis. It is worth adding here that this proposed methodology then applied for
BUPA liver-disorder dataset and validated theoretically and empirically.
1 INTRODUCTION
Uncertainty problems are frequently described in
complex systems. In dealing with uncertainty, a lot
of techniques have drawn the attentions of
researchers and applied scientists over last decade.
Decisions are made based on information given
which known as data. However, information about
decision is always uncertain. In real-world
phenomena, the uncertain information may consist
of randomness, vagueness and fuzziness. Machine
learning has always been considered as an integral
part of the field of artificial intelligence. In artificial
intelligence research area, the main problems that
always arise are: how to represent the uncertain
information precisely: and how to reason using
uncertain information (Tang et al., 2002). Machine
learning is certainly one of the most significant
subfields of modern artificial intelligence. In recent
years, machine learning systems have been adopted
standard framework to deal with imprecision in data
analysis.
In describing imprecise, type-1 fuzzy sets are
used as a tool to erase these imprecision properly.
Uncertainty is closely related with probability,
which establishes the formal framework in machine
learning systems. Uncertainty and fuzziness are
well-known phenomena in many application areas in
science and engineering, where are often not crisp
but there exist various degree of membership grade
that practical automatically occurs in machine
learning. Type-2 fuzzy sets are suitable for
uncertainty or approximate reasoning, especially for
the machine learning systems with a mathematical
model that is difficult to derive. Klir and Yuan
(1995) claim that type-1 fuzzy sets only describe
imprecise not uncertainty. On particular motivation
for the further interest in type-2 fuzzy sets that its’
provide a better scope for modelling uncertainty than
type-1 fuzzy sets (Wagner and Hagras, 2010).
In the literature of fuzzy sets, Zadeh (1965) was
introduced fuzzy set theory in representing
vagueness or imprecision in a mathematical
approach. In order to do so, the main motivation of
using fuzzy sets shows its ability in appropriately
dealing with imprecise numerical quantities and
subjective preferences of decision makers (Deng,
2013). According to Zimmermann (2000), he claims
that the fuzzy numbers are represented as possibility
distribution where most of the real-world
phenomena that exist in nature are fuzzy rather than
probabilistic or deterministic. Fuzzy set theory was
specifically designed to mathematically represent to
uncertainty and vagueness. It also provide
formalised tools for dealing with imprecision
Khalif, K. and Gegov, A..
Bayesian Logistic Regression using Vectorial Centroid for Interval Type-2 Fuzzy Sets.
In Proceedings of the 7th International Joint Conference on Computational Intelligence (IJCCI 2015) - Volume 2: FCTA, pages 69-79
ISBN: 978-989-758-157-1
Copyright
c
2015 by SCITEPRESS – Science and Technology Publications, Lda. All rights reserved
69
essential to many real problems nowadays.
Technologies nowadays have been developed in
fuzzy sets that have potential to support all of the
steps that encompass a process of model orientation
and knowledge discovery. In particular, fuzzy sets
theory can be used in data analysis to model vague
data in terms of fuzzy sets. There are some
contributions that fuzzy sets can make to machine
learning which are: 1) graduality; 2) granulity; 3)
interpretability; 4) robustness; 5) representation of
uncertainty; 6) incorporation of background
knowledge and; 7) aggregation, combination, and
information fusion (Hullermeier, 2011).
The concept of type-2 fuzzy set was introduced
by Zadeh (1975) as an extension of the type-1 fuzzy
set. According to Karnik and Mendel (2001), they
claim that type-2 fuzzy set can be characterised as
fuzzy membership function where the membership
value for each element in type-2 is a fuzzy set in
[0,1], unlike type-1 where the membership value is a
crisp value in [0,1]. The interval type-2 fuzzy sets
are widely used type-2 fuzzy sets in many practical
science and engineering areas (Mendel et al., 2006).
The involvement of higher level uncertainty of type-
2 fuzzy sets compared to type-1, provide additional
degrees of freedom to represent the uncertainty and
the fuzziness of real world problems. There are two
types of uncertainty which are inter and intra
personal uncertainties, in improvising the
representation of type-1 fuzzy sets in the literature of
fuzzy sets. This is also supported by Wallsten and
Budescu (1995) where there are supposedly two
kinds of uncertainties that are related to linguistic
characteristics namely intra-personal uncertainty and
inter-personal uncertainty. In particular, a lot of
experts have applied interval type-2 fuzzy sets in
machine learning systems analysis. Due to
implementing interval type-2 fuzzy sets in real
problems, the way to handle is different and much
more complex compared to type-1 fuzzy sets. The
contribution of centroid of type-2 fuzzy sets till now
commonly-used uncertainty measure for modelling
problems.
The implementation of defuzzification plays an
important role in the performance of fuzzy system’s
modelling techniques (Yager and Filev, 1994).
Defuzzification process is guided by the output
fuzzy subset that one value would be selected as a
single crisp value as the system output. There are
variety defuzzification methods have largely
developed, however they have difference
performances in difference applications and there is
a general method can satisfactory performance in all
conditions (Mogharreban and Dilalla, 2006). The
centroid defuzzification methods of fuzzy numbers
have been explored for the last decade that
commonly used and have been applied in various
discipline areas. The computation complexity of
type-2 fuzzy set is very difficult to handle into
practical applications because of characterised by
their footprint of uncertainty (Mendel, 2001). There
are two typical paths in computing type-2 fuzzy sets
which are: 1) type-reduction (Karnik and Mendel,
2001), (Mendel, 2001) (Liu, 2008) and; 2) direct
defuzzification (Gong et al., 2015). Most experts
applied type-reduction methods in handling the
complexity of type-2 fuzzy sets by finding
equivalent type-1 fuzzy sets. However, direct
defuzzification for type-2 fuzzy sets is still under
study.
The concept of possibility mean value for
interval fuzzy sets was introduced by Carlsson and
Fuller (2001) where the notations of lower
possibilistic and upper possibilistic mean values is
defined the interval-valued possibilistic mean. From
probabilistic viewpoint, the possibility mean value
of fuzzy sets can be represented as expected values
which is same function as direct defuzzification
method where it doesn’t need type-reduction stage to
get the outputs. Gong et al. (2015) extends the
concept of Carlsson and Fuller (2001) about
possibility mean value of type-1 fuzzy sets which
introduce the lower and upper possibility mean value
for interval type-2 fuzzy sets. In this paper, the
comparative simulation results and between the
proposed pf the extension of Vectorial Centroid (Ku
Khalif and Gegov, 2015) and possibility mean value
that proposed by Gong et al. (2015) for interval
type-2 fuzzy sets is discussed. There are some
limitations exist in implementing Gong et al. (2015)
method for interval type-2 fuzzy sets, where in some
cases it will give illogical results that not consistent
with human intuition. This method also can cater all
possible cases of interval type-2 fuzzy sets properly
since some of the results are dispersed far away from
the closed interval bounded by the expectations
calculated from its upper and lower distribution
functions.
Due to growths in computational capability and
technology development, data are being generated
for understanding details real world problems in
health nowadays that associated with clinical tests,
diseases, disorder, genetic cases and so forth (Chen
et al., 2011). However, with the availability of large
datasets become the essential challenges of a new
methods of statistical analysis and modelling.
Logistic regression model is one of machine learning
technique that used in handling these problems with
FCTA 2015 - 7th International Conference on Fuzzy Computation Theory and Applications
70
high-dimensional data. The dataset that represents
binary dependent attribute where it uses logit
transform to predict probabilities directly. Logistic
regression is a model-based approach to mapping
observers’ distribution. When applied within
Bayesian setting, logistic regression provides a
useful platform for integrating expert knowledge, in
the form of a prior, with empirical data (Choy,
2013). Probability is complete with parametric
models that let us characterize random uncertainty
(Mendel and Wu, 2006).
Issues with respects to representation capability
of fuzzy sets in machine learning systems on
uncertainty become one of the important problems in
decision making environments. The main objective
of the present paper is to illustrate the extension of
Vectorial Centroid (Ku Khalif and Alex, 2015)
method for interval type-2 fuzzy sets that consider
the illustration of Bayesian algorithm about the
parameters of a logistic regression model. Aiming at
the problems pointed out above, new centroid
defuzzification for interval type-2 fuzzy sets is
proposed that easy to understand, more flexible and
more intelligent compared to existing methods. The
proposed method also considers the need of human
intuition and gives logical results while dealing with
machine learning systems. In this research study,
classification dataset with binary dependent attribute
is used. The observations in this dataset, we will
work on “BUPA liver-disorder” that were sampled
by BUPA Medical Research Ltd. There are 7
attributes that consist of six independent attributes
and one binary dependent attribute. The BUPA
liver-disorder dataset represents blood tests
indicating a property of liver disorders that may
increase from excessive alcohol consumption.
The remainder of this paper is organised as
follows: Section II introduces the concepts of type-2
fuzzy set, interval type-2 fuzzy set, centroid method
that proposed by Gong et al. (2015) and Bayesian
logistic regression. Section III views the proposed
new centroid method for interval type-2 fuzzy sets
using Vectorial Centroid method. Section IV
illustrates the implementation of proposed method
with Bayesian logistic regression in BUPA liver-
disorder and compares the results with Gong et al.
(2015) method. Section V summarises the main
results and draws conclusion.
2 PRELIMINARIES
In this section, we briefly review some concepts of
interval type-2 fuzzy sets (IT2 FSs), Bayesian
logistic regression and interval-value possibility
mean
2.1 Interval Type-2 Fuzzy Sets
Definition 1: A type-2 fuzzy set (T2 FS)
≈
A
in the
universe of discourse X represented by the type-2
membership function
μ
. If all 1),( =
≈
ux
A
μ
, then
≈
A
is called an interval type-2 fuzzy sets (IT2 FSs). An
IT2 FS can be considered as a special case T2 FS,
denoted as follows (Deng, 2013):
∈∈
≈
=
XxJu
x
uxA ),/(1
(1)
where
[]
1,0⊆
x
J .
Definition 2: The upper and lower membership
function of an IT2 FS are type-1 fuzzy sets (T1 FSs)
membership functions, respectively. A trapezoidal
interval type-2 fuzzy sets can be represented by
,()),
~
(
~
),
~
(;,,,(()
~
,
~
(
1
2
14321
L
i
L
i
U
i
U
i
U
i
U
i
U
i
L
i
U
i
i
aAHAHaaaaAAA ==
≈
)))
~
(),
~
(;,,
21432
L
i
L
i
L
i
L
i
L
i
AHAHaaa where can be shown in
Figure 1 (Gong et al., 2015). The
U
i
A
~
and
L
i
A
~
are T1
FSs,
L
i
L
i
L
i
U
i
U
i
U
i
U
i
aaaaaaa
3214321
,,,,,,
and
L
i
a
4
are the
reference points of the IT2 FS
≈
A
, )
~
(
U
ij
AH denote
the membership value of the element
U
ji
a
)1( +
in the
upper trapezoidal membership function
U
i
A
~
,
21 ≤≤ j , )
~
(
L
ij
AH denotes the membership value of
the element
L
ji
a
)1( +
in the lower trapezoidal
membership function
L
i
A
~
, 21 ≤≤ j , and for
]1,0[)
~
(
1
∈
U
i
AH , ]1,0[)
~
(
2
∈
U
i
AH , ]1,0[)
~
(
1
∈
L
i
AH ,
]1,0[)
~
(
2
∈
L
i
AH
and ni ≤≤1 ,
]1,0[)
~
(
2
∈
U
i
AH
(Deng,
2013).
Definition 3: The arithmetic additional operation
between the trapezoidal IT2 FSs
,()),
~
(),
~
(;,,,(()
~
,
~
(
11121114131211111
LUUUUUULU
aAHAHaaaaAAA ==
≈
)))
~
(),
~
(;,
12111412
LLLL
AHAHaa and ,(()
~
,
~
(
21222
ULU
aAAA ==
≈
LLUUUULLLU
aaAHAHaaAHaaa
22212221242321242322
,()),
~
(),
~
(;,),
~
(;,,
)))
~
(
22
L
AH is defined as follows (Lee and Chen,
2008):
Bayesian Logistic Regression using Vectorial Centroid for Interval Type-2 Fuzzy Sets
71

)
~
,
~
()
~
,
~
(
2211
21
LULU
AAAAAA +=+
≈≈
;,,,((
2414231322122111
UUUUUUUU
aaaaaaaa ++++=
)),
~
((),
~
(min()),
~
((),
~
(min(
22122111
UUUU
AHAHAHAH
;,,,((
2414231322122111
LLLLLLLL
aaaaaaaa ++++=
)))
~
((),
~
(min()),
~
((),
~
(min(
22122111
LLLL
AHAHAHAH
(2)
Definition 4: The arithmetic substraction operation
between the trapezoidal IT2 FSs
,()),
~
(),
~
(;,,,(()
~
,
~
(
11121114131211111
LUUUUUULU
aAHAHaaaaAAA ==
≈
)))
~
(),
~
(;,
12111412
LLLL
AHAHaa and ,(()
~
,
~
(
21222
ULU
aAAA ==
≈
LLUUUULLLU
aaAHAHaaAHaaa
22212221242321242322
,()),
~
(),
~
(;,),
~
(;,,
)))
~
(
22
L
AH
is defined as follows (Lee and Chen,
2008):
)
~
,
~
()
~
,
~
(
2211
21
LULU
AAAAAA −=−
≈≈
;,,,((
2414231322122111
UUUUUUUU
aaaaaaaa −−−−=
)),
~
((),
~
(min()),
~
((),
~
(min(
22122111
UUUU
AHAHAHAH
;,,,((
2414231322122111
LLLLLLLL
aaaaaaaa −−−−=
)))
~
((),
~
(min()),
~
((),
~
(min(
22122111
LLLL
AHAHAHAH
(3)
Definition 5: The arithmetic multiplication
operation between the trapezoidal IT2 FSs
,()),
~
(),
~
(;,,,(()
~
,
~
(
11121114131211111
LUUUUUULU
aAHAHaaaaAAA ==
≈
)))
~
(),
~
(;,
12111412
LLLL
AHAHaa and ,(()
~
,
~
(
21222
ULU
aAAA ==
≈
LLUUUULLLU
aaAHAHaaAHaaa
22212221242321242322
,()),
~
(),
~
(;,),
~
(;,,
)))
~
(
22
L
AH
is defined as follows (Lee and Chen,
2008):
)
~
,
~
()
~
,
~
(
2211
21
LULU
AAAAAA ×=×
≈≈
;,,,((
2414231322122111
UUUUUUUU
aaaaaaaa ××××=
)),
~
((),
~
(min()),
~
((),
~
(min(
22122111
UUUU
AHAHAHAH
;,,,((
2414231322122111
LLLLLLLL
aaaaaaaa ××××=
)))
~
((),
~
(min()),
~
((),
~
(min(
22122111
LLLL
AHAHAHAH
(4)
Definition .6: The arithmetic operation between the
trapezoidal IT2 FSs
,,,(()
~
,
~
(
131211111
UUULU
aaaAAA ==
≈
)))
~
(),
~
(;,,()),
~
(),
~
(;
1211141211121114
LLLLLUUU
AHAHaaaAHAHa
and the crisp constant value k is defined as follows
(Lee and Chen, 2008):
))),
~
((),
~
(;,,,(
221114131211
LLLLLL
AHAHakakakak ××××
)),
~
((),
~
(;
1
,
1
,
1
,
1
((
221114131211
1
UUUUUU
AHAHa
k
a
k
a
k
a
kk
A
××××=
≈
)))
~
((),
~
(;
1
,
1
,
1
,
1
(
221114131211
LLLLLL
AHAHa
k
a
k
a
k
a
k
××××
(5)
where
0>k .
Figure 1: The upper trapezoidal membership function
U
i
A
~
and lower trapezoidal membership function
L
i
A
~
of
IT2 FSs.
2.2 Bayesian Logistic Regression
The principal of Bayesian inference for logistic
regression analyses follows the typical pattern for
Bayesian analysis (Joseph, 2015):
1. Write down the likelihood function of the data
2. Form a prior distribution over all unidentified
parameters
3. Find posterior distribution using Bayes theorem
over all parameters
Likelihood function: the likelihood contribution from
the
th
i subject is binomial
)))(1()(
1(
ii
y
i
y
ii
xxlikelihood
−
−=
ππ
(6)
where
)(
i
x
π
represents the probability of the event
for subject i, which has covariate vector
i
x and
i
y
specifies the liver-disorder
1=
i
y , or liver-normal
2=
i
y of the event for the subject. Logistic
regression is denoted as
ppi
ppi
XX
XX
e
e
x
βββ
βββ
π
+++
+++
+
=
...
...
10
10
1
)(
(7)
So the likelihood from the
th
i subject is
)1(
...
...
...1
...
110
110
10
110
1
1
1
i
ippi
ippi
i
ippi
ippi
y
XX
XX
y
XX
XX
i
e
e
e
e
likelihood
−
+++
+++
+++
+++
+
−
+
=
βββ
βββ
βββ
βββ
∏
=
−
+++
+++
+++
+++
+
−
+
=
n
i
y
XX
XX
y
XX
XX
i
i
ippi
ippi
i
ippi
ippi
e
e
e
e
likelihood
1
)1(
...1
...
...1
...
10
110
10
110
1
1
1
βββ
βββ
βββ
βββ
(8)
FCTA 2015 - 7th International Conference on Fuzzy Computation Theory and Applications
72

Prior distribution: in general, any prior distribution
can be used, depending on the available prior
information.
),(~
2
jjj
cNormal
σβ
(9)
The most common choice for c is zero, and
σ
is
usually chosen to be large enough to be considered
as non-informative in the range from
10=
σ
to
100=
σ
.
Posterior distribution via Bayes theorem: the
posterior distribution is divided by multiplying the
prior distribution over all parameter by the full
likelihood function, so that
∏
=
−
+++
+++
+++
+++
+
−
+
=
n
i
y
XX
XX
y
XX
XX
i
ippi
ippi
i
ippi
ippi
e
e
e
e
Posterior
1
)1(
...1
...
...1
...
10
110
10
110
1
1
1
βββ
βββ
βββ
βββ
p
j
j
jj
j
c
0
2
2
1
exp
2
1
=
−
−×
σ
β
πσ
(10)
The latter part of the above expression being
recognised as normal distribution for the
β
parameters. For liver-disorder classification
problem,
)1(
pp
xyp
β
= , will be an estimate of the
probability that the pth document belongs to the
category. The decision of whether to assign the
category can be based on comparing the probability
estimate with a threshold or by computing which
decision gives optimal expected utility.
2.3 Interval-Valued Possibility Mean
Value
The concept of interval-valued possibility mean
value are divided into two parts which are lower and
upper possibility mean value. The lower
)(
≈
AM and
upper
)(
≈
AM possibility mean value for interval
type-2 fuzzy sets are denoted as follow (Gong et al.,
2015):
−
++
−
+=
≈
LU
h
L
LL
L
h
u
UU
U
d
h
aa
ad
h
aa
aAM
0
12
1
0
12
1
)(
βββααα
(11)
−
++
−
+=
≈
LU
h
L
LL
L
h
u
UU
U
d
h
aa
ad
h
aa
aAM
0
43
4
0
43
4
)(
βββααα
(12)
For crisp value, we can compute by using the
average of lower and upper possibility mean value
above that denoted as follows
2
)(
MM
AM
+
=
≈
(13)
In this paper, the numerical analysis for proposed
methodology is compared with interval-valued
possibility mean value that proposed by Gong et al.
(2015).
3 PROPOSED METHOD
As noted in the introduction, the useful of interval
type-2 fuzzy sets nowadays are widely applied in
many research areas in dealing with uncertainty in
data analysis which consistent with human intuition.
Most of researchers attempt to eliminate the need of
human intuition in data analysis processes. Human
intuition is strictly can’t be eliminated because it can
lead us towards uncertainty problems.
This study simplify the concept of attributes to
]1,0[∈
≈A
μ
for fuzzy events. The values of attributes
correspond to interval type-2 fuzzy sets. This study
proposed a new centroid defuzzification
methodology for Bayesian logistic regression
algorithm. The methodology consist of two stages
here namely:
A. Stage one
The development of an extension of the Vectorial
Centroid defuzzification [29] for interval type-2
fuzzy sets.
B. Stage two
The implementation of Vectorial Centroid in
Bayesian logistic regression.
Full description for both stages are as follow:
A. Stage one
Let consider by
,,(()
~
,
~
(
21
U
i
U
i
L
i
U
i
i
aaAAA ==
≈
)))
~
(),
~
(;,,,()),
~
(
~
),
~
(;,
214321
2
143
L
i
L
i
L
i
L
i
L
i
L
i
L
i
U
i
U
i
U
i
AHAHaaaaAHAHaa
as the interval type-2 fuzzy sets. The complete
method process of Vectorial Centroid is signified as
follow
Step 1: Find the centroids of the three parts of
,
α
β
and
γ
in interval type-2 fuzzy set representation as
shown in Figure 2.
++++= )(
6
1
),
2
1
(
3
1
)
2
1
(
3
1
),(
2121
,
LULLUU
hhaaaayx
αα
α
(14)
++++= )(
4
1
),(
4
1
),(
3232
,
LULLUU
hhaaaayx
ββ
β
(15)
Bayesian Logistic Regression using Vectorial Centroid for Interval Type-2 Fuzzy Sets
73

Figure. 2: Vectorial Centroid plane representation.
++++= )(
6
1
),
2
1
(
3
1
)
2
1
(
3
1
),(
4343
,
LULLUU
hhaaaayx
γγ
γ
(16)
ep 2: Connect all vertices centroids points of
,
α
β
and
γ
each other, where it will create another
triangular plane inside of trapezoid plane.
Step 3: The centroid index of Vectorial Centroid of
)
~
,
~
( yx
with vertices
,
α
β
and
γ
can be calculated
as
++
=
≈
,
3
),(),(),(
)
~
,
~
(
,,,
yxyxyx
yxVC
A
γγββαα
γβα
−
+
+ ),(
2
),(),(
3
2
),(
,
,,
,
yx
yxyx
yx
ββ
γγαα
ββ
β
γα
β
(17)
Vectorial Centroid can be summarised as
++++++=
≈
)(
4
7
)(
4
5
9
1
)
~
,
~
(
332211
LULULU
A
aaaaaayxVC
+
+ )(
36
11
,)(
2
1
44
LULU
hhaa (18)
where
α
: the centroid coordinate of first triangle plane
β
: the centroid coordinate of rectangle plane
γ
: the centroid coordinate of second triangle plane
)
~
,
~
( yx : the centroid coordinate of fuzzy number
≈
A
Centroid index of Vectorial Centroid can be
generated using Euclidean distance by Cheng
(1998):
22
~~
)( yxAR +=
≈
(19)
B. Stage two
Integrating fuzzy sets with Bayesian logistic
regression in fuzzy states of nature, where if there is
fuzzy dataset, defuzzification process is needed in
converting into crisp values where at the same time
the fuzzy nature is not lost. Reinterpretation of
degree
]1,0[∈
≈
A
μ
using Vectorial Centroid to the
)1(
pp
XyP
β
=
is developed as follows:
Step 1: Lift the reintergration of the fuzzy values
membership function using trapezoidal interval type-
2 fuzzy sets. Vectorial Centroid formulation are
applied for trapezoidal interval type-2 fuzzy set rule
formula. The
≈
A
μ
represents as
,()),
~
(),
~
(;,,,(()
~
,
~
(
11121114131211111
LUUUUUULU
aAHAHaaaaAAA ==
≈
)))
~
(),
~
(;,
12111412
LLLL
AHAHaa in calculation to avoid
cluttering. Suppose that
ii
x
β
μ
are fuzzy events for
attribute alkaline phosphatase, aspartate
aminotransferase, gamma-glutamyl transpeptidase
and alamine aminotransferase in BUPA liver-
disorder dataset.
Step 2: The centroid index of Vectorial
Centroid,
)(
≈
AR
is inserted into Bayesian logistic
regression rule as
)(
~~
)(
22
≈≈
=+= AyxAR
μ
The computational process of likelihood and
posterior distribution of fuzzy Bayesian logistic
regression using Vectorial Centroid are denoted as
∏
=
−
+++
+++
+++
+++
+
−
+
=
≈≈
≈≈
≈≈
≈≈
n
i
y
AA
AA
y
AA
AA
i
i
ippi
ippi
i
ippi
ippi
e
e
e
e
likelihood
1
)1(
)(...)(
)(...)(
)(...)(
)(...)(
110
110
110
110
1
1
1
μβμββ
μβμββ
μβμββ
μβμββ
(20)
∏
=
−
+++
+++
+++
+++
+
−
+
=
≈≈
≈≈
≈≈
≈≈
n
i
y
AA
AA
y
AA
AA
i
ippi
ippi
i
ippi
ippi
e
e
e
e
Posterior
1
)1(
)(...)(
)(...)(
)(...)(
)(...)(
110
110
110
110
1
1
1
μβμββ
μβμββ
μβμββ
μβμββ
p
j
j
jj
j
c
0
2
2
1
exp
2
1
=
−
−×
σ
β
πσ
(21)
4 EXPERIMENTAL SETTINGS
In this section, we describe the required parameters
to conduct the experiments. The experiment is
conducted using 10-fold cross validation on BUPA
liver-disorder dataset from UCI machine learning
repository (Forsyth, 2015) is used where donated by
FCTA 2015 - 7th International Conference on Fuzzy Computation Theory and Applications
74

BUPA Medical Research Ltd. This liver-disorder
classification dataset has 345 examples, 7 attributes
and binary classes for dependent attribute. The first
5 attributes are measurements taken by blood tests
that are thought to be sensitive to liver-disorders and
might arise from excessive alcohol consumption.
The sixth attribute is a sort of selector attribute
where the subjects are single male individuals. The
seventh attribute shows a selector on the dataset
which being used to split into two categories that
indicating the class identity. The attributes include:
a. Mean corpuscular volume,
b. Alkaline phosphatase,
c. Aspartate aminotransferase,
d. Gamma-glutamyl transpeptidase,
e. Alamine aminotransferase,
f. Number if half-pint equivalents of
alcoholic beverage drunk per day, and
g. Output attributes either liver disorder or
liver normal
Among all the people, there are 145 belonging to the
liver-disorder group and 200 belonging to the liver-
normal group. These attributes are selected with the
aid of experts. The original dataset are fuzzified
randomly in interval type-2 fuzzy sets form in
operating centroid methods. Below depicts the
example of interval type-2 fuzzy sets are used in this
research study:
Example 1: If the trapezoidal interval type-2 fuzzy
set
20.51;1),.68,18.06,((15.35,16)
~
,
~
( ==
≈
L
i
U
i
i
AAA
19;0.9))(16,17,18,
, then the centre points are
computed using proposed (Vectorial Centroid) and
established method (Interval-valued possibility mean
value) formulation respectively as follows:
Vectorial Centroid:
3678.17)( =xVC
and
58056.0)( =yVC
Index Vectorial Centroid,
3775.17)( =
≈
RVC
Interval-Valued Possibility Mean Value:
[]
8633.16,8683.14)(),()( =
=
≈
∗
≈
∗
≈
AMAMAM
Crisp possibility mean value,
8658.15)( =
≈
AM
5 SIMULATION RESULTS
This section illustrates the validation process that are
divided into two parts which are theoretically and
empirically. Therefore, the theoretical of Vectorial
Centroid validation process are as follow:
A. Stage one
The relevant properties considered for justifying the
applicability of centroid for interval type-2 fuzzy
sets, where they depend on the practicality within
the area of research however, they are not
considered as complete. Therefore, without loss of
generality, the relevant properties of the centroid are
as follow:
Let
≈
A
and
≈
B
are be trapezoidal and triangular
interval type-2 fuzzy sets respectively, while
)
~
,
~
( yxMC
A
≈
and
)
~
,
~
( yxMC
B
≈
be centroid points for
≈
A
and
≈
B
respectively. Centroid index of Vectorial
Centroid, (R) shows the crisp value of centroid point
that is denoted as
22
~~
)( yxAR +=
≈
.
Property 1: If
≈
A
and
≈
B
are embedded and
symmetry, then
)()(
≈≈
> BRAR
.
Proof:
Since
≈
A
and
≈
B
are embedded and symmetry, hence
from equation (19) we have
2222
~~~~
≈≈≈≈
+>+
BBAA
yxyx
.
Therefore,
)()(
≈≈
> BRAR
.
Property 2: If
≈
A
and
≈
B
are embedded with
≈≈
>
B
LU
A
LU
hhhh ),(),(
, then
)
~
()
~
( BRAR >
.
Proof:
Since
≈
A
and
≈
B
are embedded and
with
≈≈
B
LU
A
LU
hhhh ),(),(
, hence we know that
B
A
yy
~~
~
~
> .
Then, from equation (19) we
have
2222
~~~~
≈≈≈≈
+>+
BBAA
yxyx
. Therefore,
)()(
≈≈
> BRAR
.
Property 3: If
≈
A
is singleton fuzzy number, then
22
~~
)(
≈≈
+=
≈
AA
yxAR
.
Proof:
For any crisp (real) interval type-2 fuzzy set, we
know that
≈
========
A
LLLLUUUU
xaaaaaaaa
~
43214321
which are equivalent to equation (18).
Bayesian Logistic Regression using Vectorial Centroid for Interval Type-2 Fuzzy Sets
75
Therefore,
22
~~
)(
≈≈
+=
≈
AA
yxAR
.
Property 4: If
≈
A
is any symmetrical or asymmetrical
interval type-2 fuzzy number, then
UU
aARa
41
)( <<
≈
Proof:
Since any symmetrical or asymmetrical interval
type-2 fuzzy set has
UUUU
aaaa
4321
≤≤≤
, hence
U
A
U
ayxMCa
41
)
~
,
~
( <<
≈
. Therefore,
UU
aARa
41
)( <<
≈
.
B Stage two
In this stage, the empirical validation is implemented
where the BUPA liver-disorder data set is used in
conducting Bayesian Logistic Regression
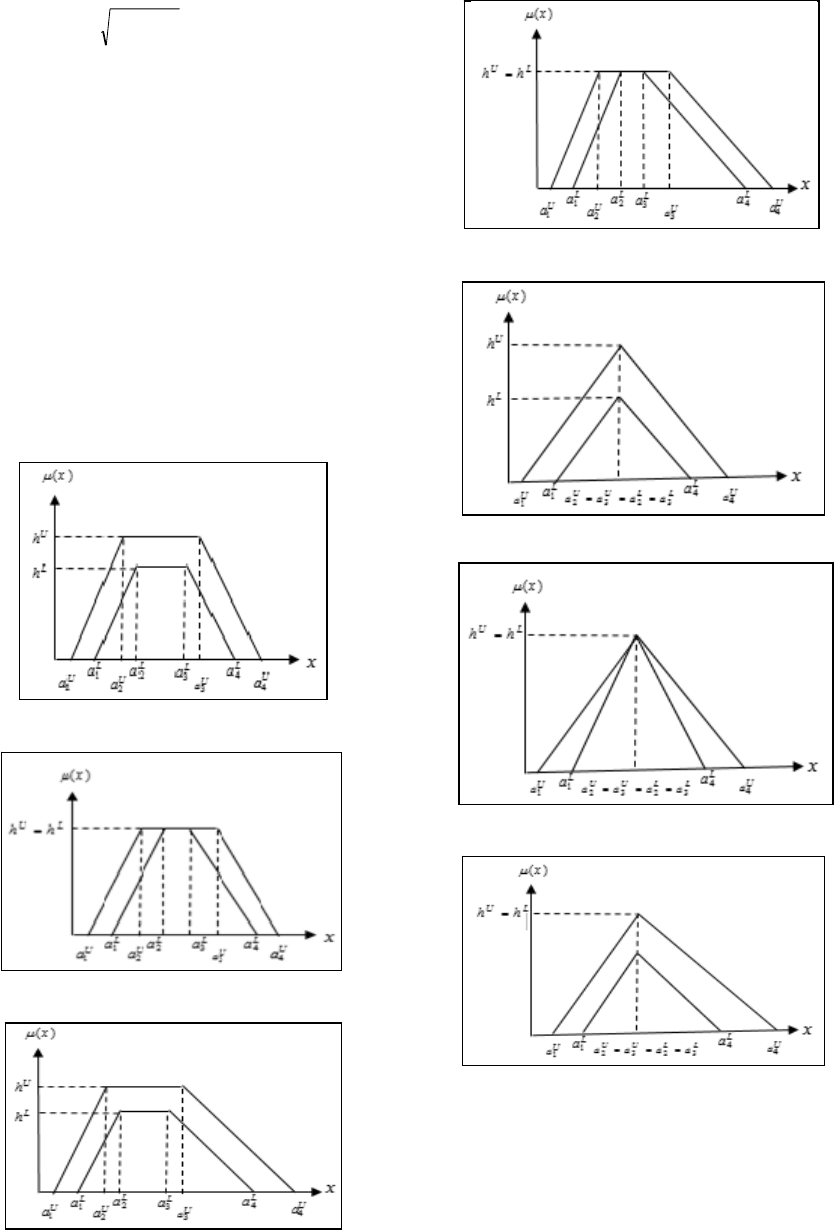
Note that this study is considered all type of possible
interval type-2 fuzzy sets for attributes randomly as
figures follow:
Figure 3: Trapezoidal Non-Normal Symmetry.
Figure 4: Trapezoidal Normal Symmetry.
Figure 5: Trapezoidal Non-Normal Asymmetry.
Fig. 6: Trapezoidal Normal Asymmetry.
Figure 7: Triangular Non-Normal Symmetry.
Figure 8: Triangular Normal Symmetry.
Figure 9: Triangular Non-Normal Asymmetry.
Table I presents a comparative results between
classical Bayesian logistic regression (BLR-Classic),
Bayesian logistic regression using possibility mean
value (Gong et al., 2015) method (BLR-PMV), and
Bayesian logistic regression using proposed Vectorial
Centroid (BLR-VC). The comparison results are
FCTA 2015 - 7th International Conference on Fuzzy Computation Theory and Applications
76
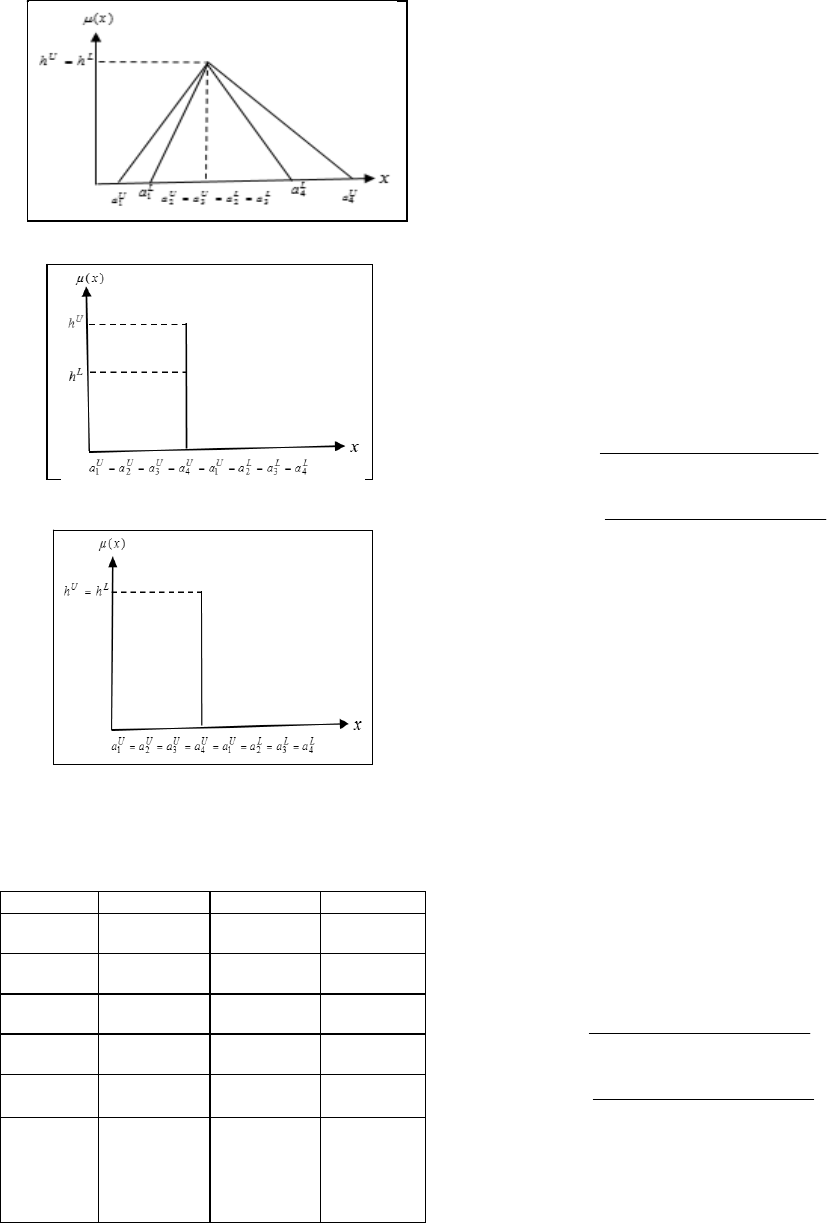
Figure 10: Triangular Normal Asymmetry.
Figure 11: Singleton Non-Normal.
Figure 12: Singleton Normal.
Table 1: Accuracy, precision, sensitivity, specificity, kappa
statistic and errors results.
Method BLR-Classic BLR-PMV BLR-VC
Accuracy
67.2464% 58.5507% 68.1159%
Precision
17.67% 1.4% 30.34%
Sensitivity
82% 66.67% 83.02%
Specificity
64.75% 58.41% 65.41%
Kappa
Statistic
0.2613 0.0203 0.2832
Errors:
MAE
RMSE
RAE
RRSE
0.3275
0.5723
67.2025%
115.9404%
0.4145
0.6438
85.0438%
130.4259%
0.3188
0.5647
65.4183%
114.391%
Centroid (BLR-VC). The comparison results are
based on accuracy precision, sensitivity, specificity,
kappa statistic, and some error terms which are Mean
Absolute Error (MAE), Root Mean Square Error
(RMSE), Relative Absolute Error (RAE) and Root
Relative Square Error (RRSE).
The accuracy and precision of a measurement
system plays significant role in quantifying the actual
measure value. It is commonly used as metric for
evaluation of machine learning systems. The
precision is dependent of accuracy where the model
can be very precise but inaccurate. The higher the
value of accuracy and precision, the better
classification prediction is made. In this research
study, Table 1 shows the classification accuracy
results that show the correctness of a model classifies
the dataset in each class. Below show the formulation
of accuracy and precision:
NegativePositive
iveTotalNegativeTotalPosit
Accuracy
+
+
: (22)
iveFalseNegativeTotalPosit
iveTotalPosit
ecision
+
:Pr (23)
The classification accuracy results of BLR-Classic,
BLR-PMV and BLR-VC are 67.2464%, 58.5508%
and 68.1159% respectively. It shows that the
proposed methodology is significantly more accurate
compared to others. The highest precision in this case
study is BLR-VC with 30.34%, followed by BLR-
Classic with 17.67% and BLR-PMV with 1.4%.
Precision discusses the closeness of two or more
measurements to each other.
The sensitivity test refers to the ability of the test
to correctly identify those observers with positive
predictive value. A high sensitivity is clearly
imperative where the test is used to identify the
correct class. But, specificity test is inversely
proportional to sensitivity where it has the ability of
the test to correctly identify those observers with
negative predictive value (Lalkhen and McCluskey,
2015). Below are formulation to calculate sensitivity
and specificity:
iveFalseNegativeTotalPosit
iveTotalPosit
ySensitivit
+
: (24)
iveTotalNegativeFalsePosit
iveTotalNegat
ySpecificit
+
: (25)
The proposed method, BLR-VC produces the highest
sensitivity and specificity value with 83.02% and
65.41% respectively. The results for BLR-PMV
shows the lowest results for sensitivity and
specificity with 66.67% and 58.41% respectively. It
Bayesian Logistic Regression using Vectorial Centroid for Interval Type-2 Fuzzy Sets
77

depicts that the goodness of prediction of both tests
for BLR-PMV is lesser than BLR-Classic and BLR-
VC.
Kappa statistic technique is used to measure the
agreement of two classifiers and estimate the
probability of two classifiers agree simply by chance
(Jeong et al., 2010). Known as chance-corrected
measure of agreement between classification and the
true classes, it is an evaluation metric which is based
on the difference between the actual agreement in the
error matrix and the chance agreement. The values
for Kappa range from 0 to 1 and the higher the value
of kappa statistic, the stronger the strength of
agreement between two classifiers by chance.
e
eo
p
pp
kKappaStat
−
−
=
1
,
(26)
where
o
p is relative observed agreement among
raters, and
e
p
is the hypothetical probability of
chance agreement.
Referring Table 1, BLR-VC shows the highest
value of kappa statistic with 0.2832 followed by
BLR-Classic and BLR-PMV with 0.2613 and 0.0203
respectively.
The last part in Table I depicts the errors for the
experiment carried out. The errors are computed by
using Mean Absolute Error (MAE), Root Mean
Square Error (RMSE), Relative Absolute Error
(RAE) and Root Relative Square Error (RRSE). All
the statistic errors compare true values to theirs
estimates, but do it in a slightly different way. Below
depict the formulation in calculating MAE, RMSE,
RAE and RRSE:
=
−=
N
i
ii
N
MAE
1
ˆ
1
θθ
(27)
=
−=
N
i
ii
N
RMSE
1
2
)
ˆ
(
1
θθ
(28)
=
=
−
−
=
N
i
ii
N
i
ii
RAE
1
1
ˆ
θθ
θθ
(29)
=
=
−
−
=
N
i
ii
N
i
ii
RRSE
1
2
1
2
)(
)
ˆ
(
θθ
θθ
(30)
These error terms show how disperse away the
estimated values from the true value of
θ
. MAE and
RMSE calculate the average difference between
those two values. In RAE and RRSE, we divide those
differences by the variation of
θ
where they have a
scale from 0 to 1, then we would multiply those
value by 100 to get the similarity in 0-100 scale. In
this case study, the proposed methodology, BLR-MC
performs better results in error terms where all of
these errors are less than BLR-Classic and BLR-
PMV.
6 CONCLUSION
This study has brought out an extension based
Vectorial Centroid (Ku Khalif and Gegov, 2015) for
interval type-2 fuzzy sets with Bayesian logistic
regression. Bayesian logistic regression algorithm
that takes into account the need of fuzzy events in
attributes. This work suggests Vectorial Centroid
defuzzification on interval type-2 fuzzy sets method
for Bayesian logistic regression which consist of two
stages which are: The development of Vectorial
Centroid defuzzification method for interval type-2
fuzzy sets: and the implementation of Vectorial
Centroid in Bayesian logistic regression. For the first
stage, the development of new centroid method can
cater all the possible cases of interval type-2 fuzzy
sets precisely that matching for human intuition. The
implementation in Bayesian logistic regression using
proposed methodology on stage two is easily
capable constructed and handled in data analysis
when dealing with fuzzy data sets.
Several limitations may exist in this research
study. First, the proposed classification model for
interval type-2 fuzzy numbers was developed and
tested on BUPA liver-disorder dataset from WEKA
software. The useful of interval type-2 fuzzy sets are
randomly applied. Second, the scope of this research
study is focused to be automated diagnosis liver-
disorder. Still, more experimental work should be
enthusiastic to obtain a medical classification model
with a better ability of generalization under fuzzy
environment. The proposed Vectorial Centroid only
applied in one machine learning which is Bayesian
logistic regression. It should be applied and
compared with more machine learning systems in
the future work that would make research much
more convincing.
Furthermore, this study can be valuable
alternatively in the set of existing Bayesian logistic
regression algorithms for numerous problems in
machine learning such as inference, classification,
FCTA 2015 - 7th International Conference on Fuzzy Computation Theory and Applications
78
clustering, regression and so forth. There are four
relevant properties for centroid development are
constructed and well proved in theoretical
validation, where corresponding with all possible
interval type-2 fuzzy sets representation. Several
tests for validation have been done and the results
have been studied in-depth using BUPA liver-
disorder classification dataset from UCI machine
learning repository. The validation results show the
proposed research study more effective in dealing
with fuzzy events empirically. Finally, it can be
concluded that the main focus of this research study
can be proceeded in order to make some
contributions by considering real case study drawn
for diverse fields crossing ecology, health, genetics,
finance and so forth.
REFERENCES
Carlsson, C., Fuller, R. 2001. On possibilistic mean value
and variance of fuzzy numbers, Fuzzy Sets and
Systems, vol. 122.
Chen, C.C.M., Schwender, H., Keith, J., Nunkesser, R.,
Mengersen, K., Macrossan, P. 2011. Method of
identifying SNP interactions: A review on variations of
logic regression, random forest and Bayesian logistic
regression, IEEE/ ACM Transactions on
Computational Biology and Bioinformatics, vol. 8. a
Cheng, C.H. 1998. A new approach for ranking fuzzy
numbers by distance method, Fuzzy Sets and Systems,
vol. 95.
Choy, S.L. 2013. Priors: Silent or active partners of
Bayesian inference?, Case Studies in Bayesian
Statistical Modelling and Analysis, John Wiley &
Sons Ltd, Sussex.
Deng, H. 2013. Comparing and ranking fuzzy numbers
using ideal solutions, Applied Mathematics
Modelling, vol. 38.
Forsyth, R.S. 2015. Liver disorder data set, UCI Machine
Learning Repository: Internet Source:
https://archive.ics.uci.edu/ml/datasets/Liver+Disorders
[Feb. 1, 2015].
Gong, Y., Hu, N., Zhang, J., Liu. G., Deng. J. 2015. Multi-
attribute group decision making method based on
geometric Bonferroni mean operator of trapezoidal
interval type-2 fuzzy numbers, Computer and
Industrial Engineering, vol. 81.
Hullermeier, E. 2011. Fuzzy sets in machine learning and
data mining, Applied Soft Computing, vol. 11.
Jeong, D., Kang, D., Won, S. 2010. Feature selection for
steel defects classification, International Conference
on Control, Automation and Systems.
Joseph. 2015. Bayesian inference for logistic regression
parameters. Internet Source: http://www.medicine.
mcgill.ca/epidemiology/joseph/courses/EPIB-621/
bayeslogit.pdf [March, 15, 2015].
Karnik, N.N., Mendel, J.M. 2001. Centroid of type-2 fuzzy
set, Information Sciences, vol. 132.
Klir, G., Yuan, B. 1995. Fuzzy sets and fuzzy logic:
Theory and applications, Prentice Hall, Upper Saddle
River.
Ku Khalif, K.M.N., Gegov, A. 2015. Generalised fuzzy
Bayesian network with adaptive Vectorial Centroid,
16
th
World Congress of the International Fuzzy
Systems Association (IFSA) and 9
th
Conference of
European Society for Fuzzy Logic and Technology
(EUSFLAT).
Lalkhen, A.G., McCluskey, A. 2015. Clinical test
sensitivity and specificity, Internet Source:
http://ceaccp.oxfordjournals.org/content/8/6/221.full
[March, 16, 2015].
Lee, L.W., Chen, S.M. 2008. Fuzzy multiple attributes
group decision-making based on the extension of
TOPSIS method and interval type-2 fuzzy sets, 7
th
IEEE International Conference on Machine Learning
and Cybernatics.
Liu. F. 2008. An efficient centroid type-reduction strategy
for general type-2 fuzzy logic system, Information
Sciences, vol. 178.
Mendel, J.M. 2001. Uncertain rule-based fuzzy logic
systems: Introduction and new directions, Prentice-
Hall, Upper Saddle River, New Jersey.
Mendel, J.M., John, R.I., Liu, F.L. 2006. Interval type-2
fuzzy logical systems made simple, IEEE Transactions
on Fuzzy Systems, vol. 14.
Mendel, J.M., Wu, H.W. 2006. Type-2 fuzzistic for
symmetric interval type-2 fuzzy sets: Part 1, forward
problems, IEEE Transactions on Fuzzy Systems, vol.
14.
Mogharreban, N., Dilalla, L.F. 2006. Comparison of
defuzzification techniques for analysis of non-interval
data, Fuzzy Information Processing Society.
Tang, Y., Pan, H., Xu, Y. 2002. Fuzzy naïve Bayes
classifier based on fuzzy clustering, Systems, Man and
Cybernatics, IEEE International Conference, vol. 5.
Wagner, C., Hagras, H. 2010. Uncertainty and type-2
fuzzy sets systems, IEEE UK Workshop on
Computational Intelligent (UKCI).
Wallsten, T.S., Budescu, D.V. 1995. A review of human
linguistic probability processing general principles
and empirical evidences, The Knowledge Engineering
Review, vol.10 (a).
Yager, R.R., Filev, D.P. 1994. Essential of fuzzy modelling
and control, Wiley, New York.
Zadeh, L.A. 1965. Fuzzy sets, Information and Control,
vol. 8.
Zadeh, L.A., 1975. The concept of a linguistic variable
and its application to approximate reasoning,
Information Sciences, vol. 8.
Zimmermann, H.J. 2000. An application – oriented view
of modelling uncertainty, European Journal of
Operational Research, vol 122.
Bayesian Logistic Regression using Vectorial Centroid for Interval Type-2 Fuzzy Sets
79
