Neuronal Activity Visualization using Biologically Accurately Placed
Neurons in WebGL
Andoni Mujika, Peter Leškovský, Gorka Epelde, Roberto Alvarez and David Oyarzun
Vicomtech-ik4, Mikeletegi Pasealekua, Donostia-San Sebastián, Spain
Keywords: Neuronal Activity Visualization, WebGL, C. elegans.
Abstract: This paper describes the design and development of a web interface used for an analysis of neural activities
of the Caenorhabditis elegans (C. elegans) nematode, within the framework of the Si elegans project. The Si
elegans project develops a platform, where the neural system of C. elegans is emulated in hardware and the
physical worm together with the external environment is simulated in software. This platform allows for
virtual execution of a variety of behavioural experiments of C. elegans. We use the herein described web
interface to post-experimentally visualize the neural activity as well as the worm’s behaviour and allow for
its deeper analysis. The web-page joins a 3D virtual environment with the 2D GUI in order to realistically
visualize the worm and the emulated neural processes, along with additional configuration information. In
the virtual environment, the locomotion of the worm is shown, including the motion of neurons. Visualizing
the location of the neurons, the user can understand signal transmission among the neurons in a more
intuitive way. In the 2D part, additional information about the neurons is displayed. Mainly, a grid of
buttons that shows the actual spiking process of the neurons by colour changes and neuron specific voltage
graphs following the potential evolution of selected neurons. We believe that this approach suits the
exploration of small neuronal circuits, like is the ones of C. elegans.
1 INTRODUCTION
In recent years, several methods to present neuronal
activity of living organisms have been proposed.
Their main challenge is to display the brain activity
at neuronal level and to let the user interact with the
system in a friendly way. Nevertheless, not all
studied living organisms have so many neurons as
the human brain and this can change the challenges
completely.
Indeed, one of the most studied animals in the
world has only 959 cells and 302 neurons, and it is
believed that small subsets of those neurons take
part in each function of the worm. It is a round
worm and is called Caenorhabditis elegans (C.
elegans) and despite its low number of cells, its
genome is up to 35% similar to the human one.
Therefore, it may be a perfect medium for starting
genetic studies of human related diseases. Moreover,
it combines a simple neuronal structure with a rich
behavioural repertoire (mating, feeding, risk
avoiding...), what makes it valuable for neuroscience
assays.
In this context, the Si Elegans project aims to
create a tool that will be helpful for those scientists
that are studying the C. elegans worm (Blau et al.,
2014). The project aims to emulate the neuronal
system of the animal using one Field Programmable
Gate Array (FPGA) per neuron and connecting them
following the connectome of the real worm. The
behaviour that emerges from this emulation will be
translated to a physics engine where the muscles of
the worm will react to the signals that come from the
neurons. Finally, all the results will be presented in a
web page, where the user will be able to visualize
the emerged locomotion of the nematode and
explore all the data generated by the emulation
system.
In this paper, we focus in the software part of the
project, showing how we represent the activity that
has been processed in the FPGA network, how we
couple the simulation of the physics engine with a
virtual environment and how we render it using
WebGL and a user-friendly Graphic User Interface
(GUI).
Section 2 reviews the state of art on the
visualization of neuronal activity. Section 3
describes how the user interacts with the web page
Mujika, A., Leškovský, P., Epelde, G., Alvarez, R. and Oyarzun, D..
Neuronal Activity Visualization using Biologically Accurately Placed Neurons in WebGL.
In Proceedings of the 3rd International Congress on Neurotechnology, Electronics and Informatics (NEUROTECHNIX 2015), pages 91-96
ISBN: 978-989-758-161-8
Copyright
c
2015 by SCITEPRESS – Science and Technology Publications, Lda. All rights reserved
91
in order to obtain neuronal information generated in
the Si elegans system. Afterwards, section 4
provides implementation details and section 5 draws
conclusions and discusses the future work.
2 RELATED WORK
Advanced tools for exploring brain activity are an
active research field. For example, (Matsumoto et
al., 2010) present a Bayes algorithm to reduce the
dimension and cluster the data that come from
neuronal activity and show them in a more
comprehensible way. (Mulas and Massobrio, 2013)
included 2D tools to present whether the neurons are
inhibitory or excitatory, and display their potentials,
their links, spiking rate, etc.
Some works use three dimensions to visualize
the neuronal activity. (Hernando et al., 2013) present
an algorithm for parallel rendering of thousands of
neurons. Transparencies are used to let the user
explore all the neurons and different levels of details
are used to plot neurons at different distances.
(Sousa and Aguiar, 2014) also render thousands of
neurons, placing spheres in a 3D environment, each
one representing a neuron. The colour of the neuron
represents its potential. Our approach has similar
features to this one, but we think that the use of
colours is more adequate for small circuits, as the
ones that are studied in experiments with C. elegans.
Regarding the adaptation of web pages for
neuron activity visualization, (Jianu et al., 2012)
applied methods used for geography to make two-
dimensional maps of brain connectivity that can be
visualized in a web page. (Guo et al., 2013)
proposed two prototypes that adapt automatically to
the interaction of the user.
Beyond web-based tools, more advanced systems
exist, where the users interact with the neural
network of the brain using their hands (via different
motion capture systems) and an immersive Head-
Mounted Display (Betella et al., 2014).
Considering the specific case of a visualization
of the neuronal activity of the C. elegans, there have
been several approaches in recent years. (Bhatla,
2015) presented a 2D graph tool, for the connectome
exploration, where the user can select a neuron of
the nematode which is then shown in the middle of a
circle formed by the neurons that are related, or
connected, to it.
One of the most active projects that work in the
modelling and visualization of the behaviour of C.
elegans worm, the OpenWorm initiative, has
different approaches to the visualization of the
neuronal activity. The first one, named as the
(OpenWorm Browser n.d.), shows the complete
anatomy of the worm in a WebGL based web page.
The user can highlight different parts of the worm
(including neurons), in order to investigate on the
anatomy and the connectome, nevertheless, currently
there is no neuronal activity represented which could
be linked to the behaviour of the worm. In another
approach (Tabacof et al., 2013), the OpenWorm uses
hive plots for the connectome visualisation, i.e. plots
where neurons are grouped on radially distributed
linear axes and relations are drawn as curved links.
The last approach is embedded in the main
platform of the OpenWorm project, (Geppetto,
2015). In this platform, neurons can be visualized as
spheres and additional information about their
voltages can be displayed in adjacent menus. This
visualization tool is similar to the one described in
this paper, but in the case of Geppetto the neurons
do not follow the locomotion of the worm and there
is no menu to follow the spiking of all neurons
together.
3 VISUALIZATION WEB
In the Si elegans web interface, the user will have
several pages to control the Si elegans system. Two
pages will be for the definition of the assays that will
be simulated/executed/run in the system. In the first
one, by means of a timeline, the user will set the
stimuli that the worm will receive during the
experiment (touch, temperature changes, chemical
attractants or repellents, ...) and with additional
menus, he will set the characteristics of the
environment (shape of the plate, environment
substances...) and worm related aspects (initial
position, feeding status...). In the second one, the
user will define the neuron models that will be used
in the FPGA network, their connections and will
mark which data he wants to be tracked for future
exploration.
After the definition, the experiment will be run in
the server that contains the physics engine and
controls the FPGA network. Once the experiment is
finished and all the required data collected, the user
can explore what happened in the experiment in the
results visualization web page.
In this web page there are three different parts
(see Figure 1): (i) the 3D window, where the
behaviour of the C. elegans that has been computed
in the system will be shown as a virtual reproduction
of the worm; (ii) the selection window, where the
neurons that were tracked during the experiment in
NEUROTECHNIX 2015 - International Congress on Neurotechnology, Electronics and Informatics
92
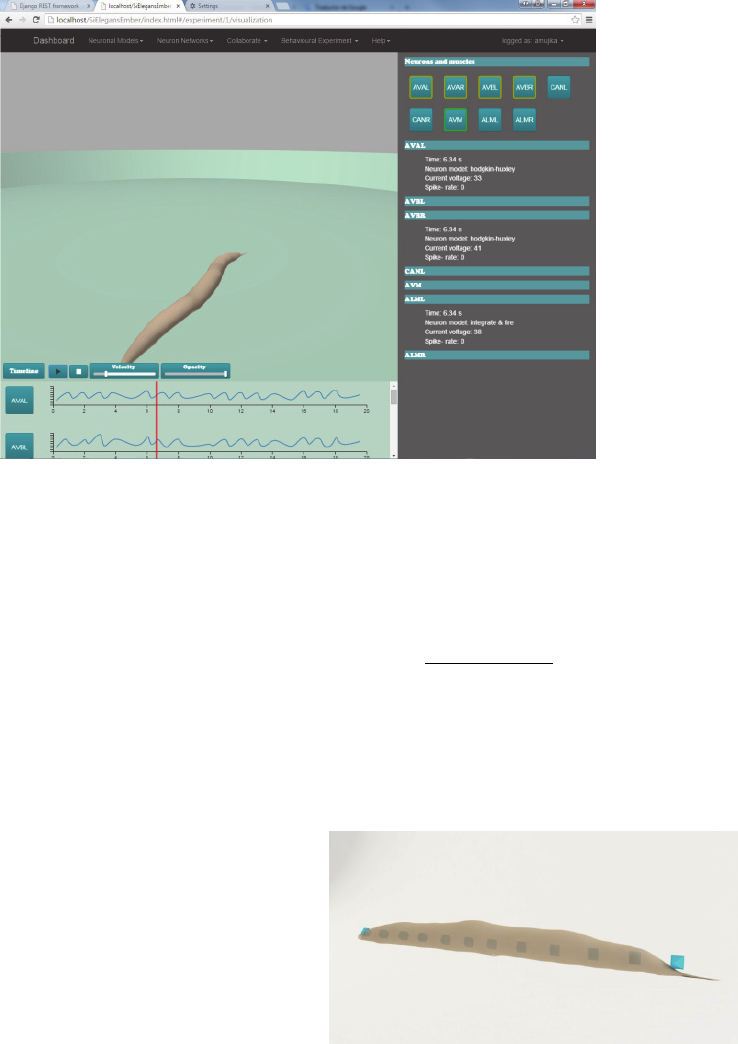
Figure 1: Worm visualization interface. Virtual worm visualization in the centre, neuron activity at the bottom and neuron
information on the right hand side.
the FPGAs are displayed and where the user will
select the neurons (out of those that were tracked) he
wants to watch their results; (iii) and the timeline
window, where the user will be able to observe the
action potential graphs of the selected neurons.
3.1 3D Environment
The lower number of neurons that are studied in
assays with C. elegans permits to implement
different approaches to those presented in section 2.
Mainly, we can provide a representation of neurons
in the 3D environment with their authentic shape,
placement and connectivity.
The 3D window shows a 3D reproduction of the
worm including its cuticle (skin) and the neurons
that have been selected by the user in definition web
pages. The virtual worm is placed in a plate at its
initial position and orientation (both also previously
defined).
The model of the physics engine is composed of
96 muscles divided in four rows (Mujika et al.,
2014). The information of the position of those
muscles has to be transferred to the web page to be
rendered in WebGL, but the amount of data has to
be minimized for performance reasons. Hence, only
12 animation bones have been set along the body of
the virtual worm (see Figure 2), which are
synchronized with the motion of the muscles in the
physics engine. The row of animation bones is
placed in the middle of the 4 muscle rows (ventral
left, ventral right, dorsal left and dorsal right) and
one bone is placed between every two muscles.
Specifically, the bones are transformed according to
the following formula:
,
,
2
0,1, … ,11
Where
is the position of the animation bone in the
web site;
,
is the th mass point in the ventral
left row and
,
is the th mass point in the dorsal,
right row of the the worm model being used in the
physical engine.
Figure 2: Animation bones, highlighted in blue, placed in
the virtual body of C. elegans. These bones will transform
making the virtual body transform accordingly.
To control the visualization of the simulation, the
user can use the usual play, pause and stop buttons.
Since the spiking of the neurons and their
consequences occur very fast, it is important to be
able to slow down the visualization of the simulation
Neuronal Activity Visualization using Biologically Accurately Placed Neurons in WebGL
93
results. A slider is used for the control of the
velocity of the simulation. Moreover, using the
timeline window, specifically by dragging the line
that represents the current time of the simulation, the
user can place the simulation at the moment he
desires.
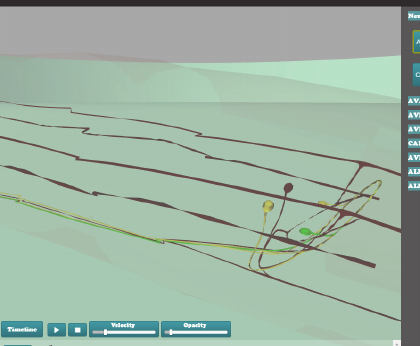
Neurons are not simple spheres. Indeed, in the
case of C. elegans, neurons can have very different
shapes, including very elongated shapes. Besides,
most of the neurons of this nematode are crowded in
its head. Thus, exploring those neurons in a 3D
environment can be a tricky task. To solve this, the
web page offers the possibility to select a neuron
using the selection window. Then, the selected
neuron will be highlighted in green and its related
neurons will be highlighted in yellow (see Figure 3).
Figure 3: 3D environment showing worms cuticle (almost
transparent), a selected neuron (in green), two related
neurons (in yellow) and all remaining neurons in dark red.
Moreover, this selection focuses the camera of
the virtual scene on the selected neuron. From that
point on, until the camera is changed by the user, the
camera will follow this neuron. In the case when no
neuron is selected, the camera controls are the usual
controls defined for controlling the visualization of a
3D scene: translate, pan and zoom.
To have the neurons realistically reproduced,
placed and moving in the 3D environment is very
important when exploring the neuronal response of
the worm. For instance, in mechanosensation
experiments, the user will be able to observe where
exactly the worm is being touched, which neurons
are located in that zone and which neurons were
activated. This way, he can focus on the correct
neurons during the simulation results visualization.
Nevertheless, in some assays, the user may want to
visualize the behaviour of the worm as a whole. For
those cases, the user can use the opacity slider to
make the cuticle of the worm completely opaque and
make the simulation results analysis easier.
In a near future, the activity of the muscles will
also be tracked and all the visualization features that
are used for neurons will be applied also for
muscles. Similarly to the visualization of the neuron
positions and neural relationships, in this case, the
3D representation of muscles will let the user to
follow how the muscles contract and relax and how
these contractions make the worm move forward or
backward.
3.2 Neuron Exploration
Both the selection window and the timeline window
are used to explore the neuronal activity of the
emulation system of Si elegans project. However,
they are also used to control some aspects of the 3D
visualization window.
The selection window is designed to visualize
the activity of the neurons that were tracked in the
FPGA experiment at a glance. A grid of buttons,
each one representing a neuron, is displayed (see
Figure 4). The number of buttons (neurons) that are
shown depends on the selection made by the user in
a previous “Experiment Definition Web”. All the
buttons are coloured in blue, but when the neuron
corresponding neuron spikes, it becomes red. This
way, the user can follow the spiking sequence of a
neuronal circuit easily. The modulation of the
darkness of each button to represent the potential of
the neuron has been considered, but it has been
discarded due to information overload.
With this approach, we pretend to join the
advantages of other methods presented in section 2.
Placing the neurons in three dimensions helps the
user to understand their specific local behaviour and
the utilization of a grid of coloured buttons in two
dimensions makes easier the exploration of the
neuronal circuit as a whole.
As stated before, the selection window is also
used to control other windows in the web page. On
the one hand, the buttons of the grid are used to
select the neurons that will be highlighted and
focused in the 3D window. The colours (green for
the selected one and yellow for related ones) are also
used to highlight the buttons (see Figure 1).
On the other hand, with these buttons, the user
can select some neurons to show more detailed
information. In the selection window itself
additional information will be displayed. At the
moment, current time, current potential, neuron
model and spike-rate are shown, but it is expected
NEUROTECHNIX 2015 - International Congress on Neurotechnology, Electronics and Informatics
94
that more information will be shown at the end of
the project (e.g. information about the FPGA where
the neuron model is implemented).
Figure 4: Selection window showing two neurons spiking.
In the timeline window, the evolution of the
potentials of the selected neurons is shown (see
Figure 5). This way, the user can analyse the state of
the whole circuit at an exact moment by looking at
the selection window and he can analyse the
evolution of a single neuron during the whole
experiment by looking at the timeline window.
Furthermore, the user can switch the timeline
window to show the events (e.g. touching the head
of the worm with a hard instrument) he defined in
the previous steps of the assay set-up in the timeline.
This way, he can see in which exact moment the
event happens and what its consequences in the
neuronal network are. As stated before, the line that
indicates the exact moment of the simulation process
being visualized can be used to move the simulation
results analysis to another time of the simulation.
Figure 5: Two potential graphs shown in the timeline
window.
4 IMPLEMENTATION
The trend in recent years is to remove the need to
install any plugin for web pages. Si elegans follows
this tendency and uses several available javascript
libraries to implement the features that we described
earlier.
In the 3D window, for the rendering of the
virtual worm in WebGL, we use (Three.js, 2015). It
offers the necessary interfaces needed to load and
animate the 3D models, control the camera, to
highlight different parts of the worm, handle
transparencies, etc. A little module has been
developed to convert the information that comes
from the physics engine to the animation bones of
Three.js.
The 3D model of the worm that is being used for
the visualization of the simulation is the one
developed in the (Virtual Worm Project, 2015).
Without losing too much detail in the shapes of the
neurons, the number of polygons has been reduced
from 1664120 to 354401 polygons (and from
831273 vertices to 277954).
Based on the features offered by each library for
different tasks, (vis.js, 2015) has been chosen for the
event visualization in the timeline window and (dc.js
2015) for the potential graphs.
Finally, (ember.js, 2015), a framework based on
the model-view-controller software architectural
pattern, has been used. This way, the transitions and
changes that happen in the web page are controlled
in an easy way and without changing the url.
Besides, (Bootstrap, 2015) has been used for the
styling of the whole web page and all its parts
(buttons, menus, etc.) resulting in an elegant and
intuitive web page.
5 CONCLUSIONS
In this paper, we have described the web-based
application that has been developed in the
framework of the Si elegans project for the
exploration of neuronal activity of C. elegans
nematode. We take advantage of the fact that the
animal has only 302 neurons and that they are
divided in smaller circuits for different
functionalities (motor neurons, mechanosensation,
chemosensation…).
We combine a 3D virtual environment that
shows the location, the shape and the motion of each
neuron and a grid of buttons in 2D that encodes the
spiking state of the neurons in the colour of the
Neuronal Activity Visualization using Biologically Accurately Placed Neurons in WebGL
95
buttons. This way, the location of the neuron (shown
in 3D) during the experiment can explain its local
behaviour and the (2D) grid gives an overview of the
activity of the whole circuit.
We believe that our approach combines the
advantages of other works described in section 2 by
the following means:
We use colours to show the potential of the
neurons, like in (Sousa and Aguiar, 2014) but our
2D approach presents them more clearly;
Potential graphs of the neuronal models are used,
like in (Geppetto, 2015);
In both the 2D representation and the 3D
representation the selected neuron and its related
ones are highlighted, like in (Bhatla, 2015);
Similar to (Geppetto, 2015), we place the
neurons biologically accurately, but in our case,
the neurons move with the body of the worm
what makes sensory events and their neuronal
consequences easier to understand.
Regarding future work, the next step of the project
with respect to visualization will be to make
physical aspects of the simulation (touching events,
changes in temperature, different substance
spread...) visible and perceivable for the user.
Moreover, exploration of muscular activity will also
be offered.
ACKNOWLEDGEMENTS
The Si Elegans project is funded by the 7th
Framework Programme (FP7) of the European
Union under FET Proactive, call ICT-2011.9.11:
Neuro-Bio-Inspired Systems (NBIS).
REFERENCES
Betella, A. et al., 2014. Understanding large network
datasets through embodied interaction in virtual
reality. pp. 1-7.
Bhatla, T., 2015. C. elegans neural network. [Online]
Available at: http://wormweb.org/neuralnet [Accessed
June 2015].
Blau, A. et al., 2014. Exploring neural principles with si
elegans, a neuromimetic representation of the
nematode caenorhabditis elegans. SCITEPRESS -
Science and Technology Publications, pp. 189-194.
Bootstrap, 2015. Bootstrap. [Online] Available at:
http://getbootstrap.com/ [Accessed June 2015].
dc.js, 2015. dc.js. [Online] Available at: http://dc-
js.github.io/dc.js/ [Accessed June 2015].
ember.js, 2015. ember.js. [Online] Available at:
http://emberjs.com/ [Accessed June 2015].
Geppetto, 2015. Geppetto. [Online] Available at:
http://www.geppetto.org/ [Accessed June 2015].
Guo, H. et al., 2013. Toward a visual interface for brain
connectivity analysis. pp. 1761-1766.
Hernando, J. et al., 2013. Practical parallel rendering of
detailed neuron simulations. Eurographics
Association, pp. 49-56.
Jianu, R., Demiralp, Ç. & D. H, L., 2012. Exploring brain
connectivity with two-dimensional neural maps.
Visualization and Computer Graphics, IEEE
Transactions, vol 18, no. 6, pp. 978-987.
Matsumoto, N., Akaho, S., Sugase-Miyamoto, Y. &
Okada, M., 2010. Visualization of multi-neuron
activity by simultaneous optimization of clustering and
dimension reduction. pp. 743-751.
Mujika, A. et al., 2014. A physically-based simulation of a
caenorhabditis elegans. 22nd International Conference
in Central Europe on Computer Graphics,
Visualization and Computer Vision.
Mulas, M. & Massobrio, P., 2012. Neuvision: A novel
simulation environment to model spontaneous and
stimulus-evoked activity of large-scale neuronal
networks. Neurocomputing, vol. 122, no. 0, pp. 441-
457.
OpenWorm, 2015. OpenWorm Browser. [Online]
Available at: browser.openworm.org [Accessed June
2015].
Project, V. W., 2015. Virtual Worm Project. [Online]
Available at: http://caltech.wormbase.org/virtualworm/
[Accessed June 2015].
Sousa, M. & Aguiar, P., 2014. Building, simulating and
visualizing large spiking neural networks with
neuralsyns. Neurocomputing, vol. 123, no. 0, pp. 372-
380.
Tabacof, P., Busbice, T. & Larson, S., 2013. Beyond the
connectome hairball: Rational visualizations and
analysis of the c. elegans connectome as a network
graph using hive plots. Frontiers in Neuroinformatics,
Volume 32.
Three.js, 2015. Three.js.
[Online] Available at:
http://threejs.org/ [Accessed June 2015].
vis.js, 2015. vis.js. [Online] Available at: http://visjs.org/
[Accessed June 2015].
NEUROTECHNIX 2015 - International Congress on Neurotechnology, Electronics and Informatics
96
