Fuzzy Modeling of Development of Sheets Number in Different
Irrigation Levels of Irrigated Lettuce with Magnetically
Treated Water
Fernando F. Putti
1,2
, Luís Roberto A. G. Filho
1,2
, Camila P. Cremasco
1,2
and Antonio E. Klar
2
1
FCA, UNESP – Univ. Estadual Paulista, Botucatu,
Rua Doutor José Barbosa de Barros, 1780, CEP 18610-307, Botucatu – SP, Brazil
2
CET, UNESP – Univ. Estadual Paulista, Campus of Tupa,
Avenida Domingos da Costa Lopes, 780, CEP 17602-496, Tupa-SP, Brazil
Keywords: Growth, Water Stress, Foggy, Uncertain, Precision, Curves.
Abstract: In the wake of the worldwide water supply crisis, several methods are being used to optimize the use of water,
mainly in agriculture, which is the main consuming factor. Magnetically treated water for agriculture is
beneficent due to an increase in quality and productivity. Current assay evaluates the effects of magnetically
treated water in lettuce cultivations throughout its cycle and determines the intermediate rates by fuzzy models
submitted at different reposition rates and assessed throughout the cycles. The assay was conducted in
randomized blocks with a 4 x 5 factor scheme, with 5 reposition laminas and 4 dates after transplant.
Development was evaluated by fuzzy mathematical modeling and by multiple polynomial regressions. Results
were compared with data collected on the field. The highest development occurred for treatments irrigated
with magnetically treated water, featuring a greater green aerial phytomass and number of leaves throughout
the cycle. The fuzzy model provided a more exact adjustment when compared with results from statistical
models.
1 INTRODUCTION
The lettuce culture is the most consumed vegetables
in Brazil. It is highlighted its economic and social
importance because it is grown by small and medium
producers. Its consumption has increased by its
extensive use in fast-food (Hirata et al, 2014; Sala and
Costa, 2008) and by presenting low calories and being
a source of vitamins and minerals (Figueiredo et al,
2012.; Oshe et al., 2001).
Recently, studies have shown that satisfactory
results are those that use magnetically treated water
for irrigation. Several researches indicate the
significant increase in productivity, as well as the
qualitative issue. Can be highlighted research
involving the celery crop, bean and pea (Maheshwari
and Grewal, 2009), wheat (Hozayn and Qados, 2010),
jatropha (LOPES et al., 2007), corn (AODA; Fattah
2011).
However, often the inaccuracy of the model
makes the response does not play indeed what was
found. Buckley (2006) found that this inaccuracy
could be reduced across the application of fuzzy
logic, in which responses were more accurate.
Statistical analyzes for proving trials, as would
naturally be the proposal for the analysis of the above
aspects have been improved by the use of
computational methods capable of predicting with
greater accuracy the estimates values.
Furthermore, in general, the greater the
complexity of the phenomenon, the lower the
accuracy of the model that describes it. Ross (2010)
infers that the more imprecise or inaccurate
information are we to characterize the fuzzy model,
the greater the precision degree will be output.
In recent years, for inaccuracy, nebulae situations
in various areas have been explained with application
of fuzzy logic, which has sections in applications such
as, for example, expert systems seeking specific
knowledge extraction and translated into an
algorithm. Also the application is to automate
processes, known as fuzzy controllers. And the fuzzy
modeling seeks to explain certain cases through a
system based on fuzzy rules.
162
Putti, F., Filho, L., Cremasco, C. and Klar, A..
Fuzzy Modeling of Development of Sheets Number in Different Irrigation Levels of Irrigated Lettuce with Magnetically Treated Water.
In Proceedings of the 7th International Joint Conference on Computational Intelligence (IJCCI 2015) - Volume 2: FCTA, pages 162-169
ISBN: 978-989-758-157-1
Copyright
c
2015 by SCITEPRESS – Science and Technology Publications, Lda. All rights reserved
The objective of this study was to develop a fuzzy
modeling to estimate the values of the biometric
variables of lettuce in all intermediate values between
the minimum and maximum rates of water
replacement levels adopted and days after
transplanting. It was also developed a specific
methodology for modeling of realized experiment in
proposed fuzzy system.
The model proposed in this work aims to use
fuzzy rule based system to also model the response
curves, but seeking a higher precision than traditional
regression analysis commonly used in agronomic
sciences.
However, it should be noted that the use of models
based on fuzzy rules has been of great importance in
various areas (social, exact, agrarian) to explain facts
which classical mathematics cannot. So the fuzzy
rule-based systems feature a range of applications to
solve these facts even before not explained.
Be advised that papers in a technically unsuitable
form will be returned for retyping. After returned the
manuscript must be appropriately modified.
2 MATERIAL AND METHODS
Was analyzed previously in all datasets considered in
this study, the data normality test was conducted by
Anderson-Darling test and found to homocedasticity
to analyze the constant variance of the errors of the
data with testing the equation of variance (or Bartlett
test) (Pagano and Gauvreau, 2012). Developed a
prediction model using known data of independent
variable (
,
,
,…,
) and estimate the value of
the dependent variable () (HAIR et al, 2006;
ZAVALA, 2007), in which the general model may be
given by the equation:
=
+
+
+
+
where
is the linear coefficient,
is the type of
water treatment (
=0 for conventional treatment
and
=1 for magnetic treatment),
is a level
percent of irrigation,
∈[25;125%].
The fuzzy mathematical modeling proposed in
this work sought to explain the agronomic production
characteristics of the lettuce due to irrigation
management in the use of magnetic treatment water
in the intermediate intervals the levels of agronomical
factors experiment performed, namely
]25%,25(+1)%;1≤≤4[. In levels
25%,1≤≤4, being evaluations also the cycle
long (14, 21, 28 and 35 days after transplanting) , was
held in one que modeling way analogous paragraph
each cycle . if considering hum agronomic
characteristics model, thus have- se :ℝ
→ℝ
, with
=(̅), wherein ℝ is the set of real numbers; in que
=
(
,
)
is defined by por
=fluid replacement
rate (% of ETc ) and
= days after transplanting,
with
∈{14,35} ;and =(
,….,
) is defined
by the mean values of biometric characteristics ,
namely
=
.
This system is based on fuzzy rules function is the
:
[
14,35
]
×
[
25,125
]
→ℝ
,
(
,
)
=
(
,
)
,
(
,
)
,
(
,
)
,
(
,
)
,
(
,
)
, where the
Cartesian product that represents the reviews of field
over the cycle ( 14 a 35 days after transplanting ) and
levels irrigation (25 to 125% , etc.) wherein
codomain ℝ
response variable is evaluated in the
experiment.
For the input variable " Irrigation Blades " , they
considered five fuzzy sets denoted by
,=
1,2,3,4,5. This definition is due to the fact that the
agronomic experiment , there were five dimensioned
irrigation water according to the Etc levels , namely
(
25
)
%,=1,2,3,4,5. Membership functions were
adopted ( trapezoidal ) of
sets because according
Yet (2009), because it is a set that features a
continuous variable , the trapezoidal model fits better
in the model answer. With this, such functions are set
so that each ratio (% of Etc) has degree of
membership equal to 1 when its corresponding fuzzy
set
(
25%
)
=1and
(
)
<1para≠
25.
The output variables were chosen electing the
variables of biometric analysis , observed that no
significant differences (p < 0.001) , according to Putti
(2013 ) .
Results are presented in two surfaces responses ,
one for each type of water, and for each cycle as
follows:
Group 1 - graphs of functions
:
[
14,35
]
×
[
25;125
]
→ℝ,
(
0,
)
=
(0,) , wherein the
codomain of
E on the number of sheets ;
:
[
14,35
]
×
[
25;125
]
→ℝ,
(
0,
)
=
(1,) ,
wherein the codomain of
1is on the number of
sheets ;
The rule base of the fuzzy system developed
shows how the results are modeled. Assuming the
fuzzy rule that :
- If " premise ( antecedent ) " " conclusion
(consequent ) "
it was possible to calculate the model inputs , from
the combination of the factors set as outputs.
From the input variables , it was possible to create
twenty pairs of rules ( ×
) and associated with
Fuzzy Modeling of Development of Sheets Number in Different Irrigation Levels of Irrigated Lettuce with Magnetically Treated Water
163

five output variables. The basic rules created for the
proposed fuzzy model was created using the
methodology proposed in Cremasco et al . (2010 ) and
Gabriel Filho et al. (2011), in which, after the
construction of fuzzy sets output , the highest degree
of relevance of each median of the treatments were
calculated by linking the input variables to the output.
The calculated values of the output variables with
membership degree 1 were determined by
associations with the fuzzy sets of the output
variables. Accordingly , from the necessity of
calculating the delimiters 19 , as performed in the
method for preparing the fuzzy sets output , it was
determined percentile leve l 0 % ( minimum) and
5,36., with i = 1,2 , ..., 18,19 the data of output.
variables , enabling the subsequent classification
of the output variable of the points with membership
degree 1 , characterized the rule base of fuzzy
systems:
- If ≤(5,26%) then é“1”;
- If
(
10,52%
)
≤≤(15,78%) then é2;
- If
(
21,04%
)
≤≤(26,3%) then é3;
- If
(
31,56%
)
≤≤(36,82%) then é4;
- If
(
42,08%
)
≤≤(47,34%) then é5;
- If
(
52,6%
)
≤≤(57,86%) then é6;
- If
(
63,12%
)
≤≤(68,38%) then é7;
- If
(
73,64%
)
≤≤(78,9%) then é8;
- If
(
84,16%
)
≤≤(89,42%) then é9;
- If ≥
(
94,68%
)
then é10,
For preparing the system based on fuzzy rules and
multiple regression equations, it was possible to
analyze the degree of association intensity, being held
the analysis of the data collected in fields with SBRF
and the regression equations, using the following
tests:
1. Mean square error:
=
(
−
)²
2. Pearson Correlation (r):
=
∑
(
−
)(
−
)
∑
−
−
/
3. Index the Willmott et al. (1985):
=1−
∑
−
²
∑
−+
|
−
|
where, y is the average of the observed values; y is
the data observed in the field; x is the average of data
modeled former is given modeled.
The closer to 1 the better r² value is the model fit. For
the analysis of Willmott index, the closer to 1 the "d"
the greater the accuracy of the model.
So this methodology sets up a way to compare
ways of curve fitting that in this work were
established by fuzzy system and regression analyzes.
So this methodology sets up a way to compare ways
of curve fitting that in this work were established by
fuzzy system and regression analyzes. After the
implementation in Matlab software, it was possible to
develop a program in Toolbox Fuzzy Logic
environment to simulate different scenarios of
discrete fuzzy rule -based system within the
predetermined intervals in the input sets.
3 RESULTS AND DISCUSSION
From the verification of the assumptions of normality
and homoscedasticity, where were accepted, there
was the need for data transformation. Thus, it was
possible to determine the adjustment equations to
model the response variable as a function of irrigation
depths and evaluations throughout the cycle. Table 1
shows the setting equations of the model in which one
can observe that the adjustment occurs by means of
3rd degree equation (Table 1).
The construction methodology of the model
membership functions output can be seen in Figure 1.
The development was made possible by the
determination of the percentiles of each output
variable , so we can see the shape of fuzzy sets for
biometric variables in their respective cycle in
appendix tables enabling the determination of the
vertices of the graphs below .
Defined the membership functions, the fuzzy sets
of biometric variables were developed, combining the
highest degree of membership for each assessment
carried out for the lettuce crop when submitted to
irrigation with ATM and AC, similarly for each cycle.
The fuzzy models developed intermediate
situations allowed to check more accurately, when
compared with the curves generated from the multiple
polynomial regression models for the development of
the culture of lettuce subject at different water depths,
they were separately analyzed types of water and
cycles. From the implementation of Matlab
computational environment, it was possible to
perform simulations of intermediate levels of
irrigation and also for intermediate levels of
evaluations. The simulations were implemented using
the evalfis function. Thus enable the preparation of
surfaces for answers to the biometric evaluations.
In the analysis of leaf number was verified that the
treatments irrigated with ATM showed higher
development compared to irrigated with AC (Figure1).
FCTA 2015 - 7th International Conference on Fuzzy Computation Theory and Applications
164
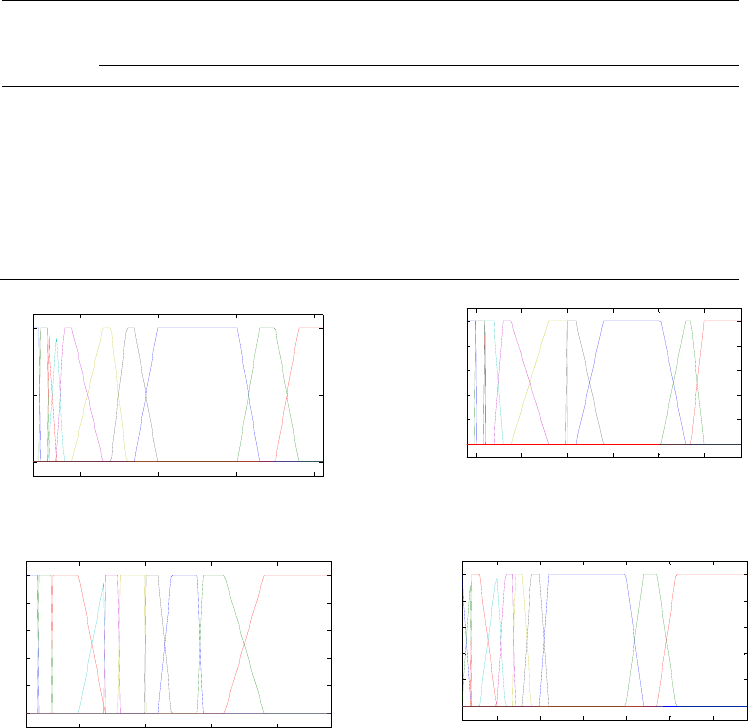
Table 1: Coefficients of regression and determination of the multiple polynomial equations for growing lettuce submitted in
different irrigation evaluated over the cycle.
=
+
NF -1ºCycle NF -2ºCycle
WM WP WM WP
30,33* -23,71* 30,4* -43,23*
-0,184* 0,47* - 0,224* 6,86*
0,002* 0,0074* 0,0027* 0,12
- 0,000006 - 0,000033* - 0,0000009 - 0,31
- 0,184* 4,92* - 2,75* - 0,002*
0,1* - 0,19* 0,1* 0,005*
0,00068 0,0027* - 0,00059 0,000001*
R² 0,98* 0,89* 0,94* 0,94*
1º Cycle – NF - WM 2º Cycle – NF - WP
2º Cycle – NF - WM 2º Cycle – NF - WM
Figure 1: Membership functions of fuzzy sets for the output variables of the lettuce crop under irrigation levels and ATM,
over the cycle to the 1st cycle.
In general for the 1st cycle, the greater the number
of leaves accumulation occurred when irrigated with
ATM, which treatments for the replacement rates of
75% and 100% etc. The development has occurred in
a milder way. When comparing with other blades, the
more abrupt development for the past few weeks was
observed (Figure 2a), reaching maximum production
around 35 sheets.
By analyzing the treatments irrigated with AC, it
was noted the less marked development over the
cycle, but arriving to accumulate 32 sheets at the end
of the cycle (Figure 2c).
In the 2nd cycle, it is very similar to the 1st cycle
behavior when subjected to irrigation with ATM, in
which there was less pronounced in development rate
of 75% etc and the other, occurring more protruding
shape (Figure 2b), reaching a maximum 33 sheets.
But when used with irrigation AC noted, in
general, held the mildest development throughout the
cycle, and produced a maximum of 26 sheets when
subjected to irrigation 125% ETC
With fuzzy model developed and the multiple
polynomial regression equations, it was possible to
verify the degree of association intensity of the
models with the data collected in the field, which
were used as parameters analyzes the Pearson
correlation (r), mean square error (EQM) and the
index " d " Willmott. Given our results, it can be
10 20 30 40
0
0.5
1
NF
Degree of membership
C1C2
C3C4C5C6
C7
C8
C9 C10
5 10 15 20 25 30
0
0.2
0.4
0.6
0.8
1
NF
Degree of membership
C1C2C3C4 C5
C6C7 C8 C9 C10
10 15 20 25
0
0.2
0.4
0.6
0.8
1
NF
Degree of membership
C1C2
C3
C4
C5
C6C7 C8 C9 C10
10 15 20 25 30 35
0
0.2
0.4
0.6
0.8
1
NF
Degree of membership
C1
C2
C3
C4
C5C6C7 C8 C9 C10
Fuzzy Modeling of Development of Sheets Number in Different Irrigation Levels of Irrigated Lettuce with Magnetically Treated Water
165
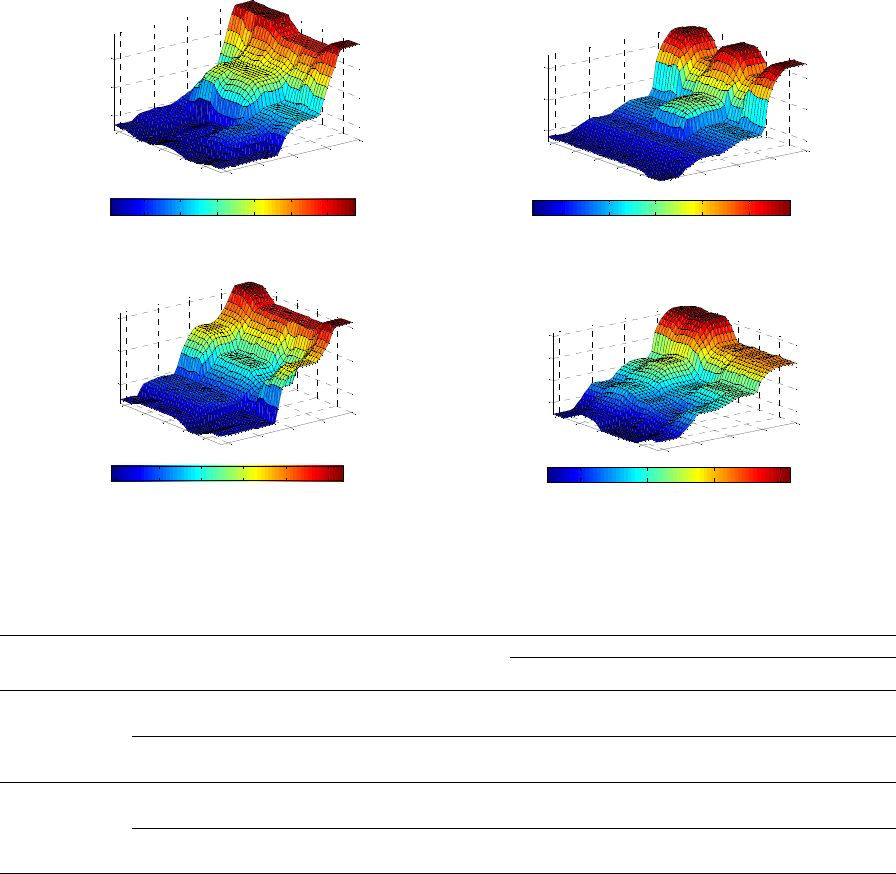
a) 1º Cycle – NF - WM b) 2º Cycle – NF - WP
c) 2º Cycle – NF - WM d) 2º ciclo - AC
Figure 2: Number of lettuce leaves under different irrigation levels and types of water being evaluated throughout the cycle.
Table 2: Association intensity analysis of fuzzy models and regression to the data collected in the field, to biometric variables
of lettuce, under different irrigation levels and assessed throughout the cycle for each type of water.
Variable Model
1º cycle
Cycle MSE r d
1
ATM
fuzzy 1,20 0,99* 0,986
regressão 1,46 0,98* 0,773
AC
fuzzy 4,44 0,98* 0,947
regressão 5,61 0,83* 0,932
2
ATM
fuzzy 1,86 0,96* 0,999
regressão 2,15 0,94* 0,998
AC
fuzzy 7,53 0,95* 0,998
regressão 50,67 0,73* 0,978
Legend: NF: number of leaf ; FVA : air green fitomasa; FSA: air dry mass; FVR: Green root biomass; FSR: dry mass of roots and " d "
Willmott, * significant at =5%.
inferred that the fuzzy models were more accurate
(Table 2).
From the response surface method, it was possible
to draw up contour maps for better visualization of
development (Figure 3).
In the 1st cycle, submitted to irrigation with ATM
there was a greater number of leaves at 35 DAT in the
region A (Figure 3a) and being higher than the
production in the region B. In the region, noted the
range of irrigation between 80 to 125% of ETc,
producing the same amount. Thus, it can be inferred
that as reduction in the volume of water applied by
irrigation, as well as a reduction in the days of the
cycle.
Irrigation using AC, the region had the highest
number of leaves compared to the region B, which
produced 32 leaves (Figure 3a and c).
For the 2nd cycle, it was found that when the
irrigation ATM have much production close to 35
DAT. By analyzing the highlighted spots it turns out
that the region had the highest production A very
close and also the region B, demanding higher
volume of water. It should be noted that most
production was reached before 35 DAT; thereby there
is a possibility of an earlier harvest (Figure 3a and b).
15
20
25
30
35
40
60
80
100
120
10
20
30
DAT
Lâmina
NF
10 15 20 25 30 35
15
20
25
30
35
40
60
80
100
120
10
20
30
DAT
Lâmina
NF
10 15 20 25 30
15
20
25
30
35
40
60
80
100
120
10
20
30
DATLâmina
NF
5 10 15 20 25 30
15
20
25
30
35
40
60
80
100
120
10
15
20
25
DAT
Lâmina
NF
10 15 20 25
FCTA 2015 - 7th International Conference on Fuzzy Computation Theory and Applications
166
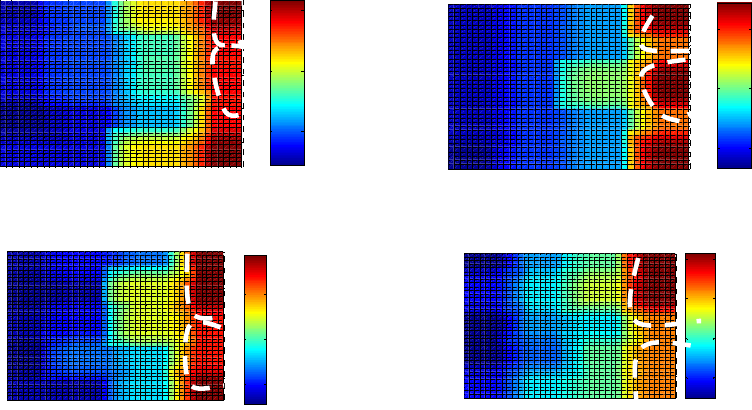
a) 1º Cycle – NF - WM b) 2º Cycle – NF - WM2º
c) 2º Cycle – NF - WP d) Cyclo - AC
Figure 3: Contour map for the development of the number of sheets subjected to the culture of different irrigation lettuce.
In the 2nd cycle when irrigated with AC, it was
found that the region A showed higher accumulation
of the number of sheets occurring close to 35 DAT
compared with the region B. It should be noted that
the region between 90 to reset Etc was 125% of the
largest number of sheet, thus the optimum range for
maximum yield of the number of sheets contained in
the region A.
By analyzing the behavior of water in contact with
magnetic fields, it was found that changes occur in
their properties, and the main research has been
observed in the adsorption of water on surfaces
(Ozeki et al., 1996), solubility of some minerals
(Bogatin et al., 1999; Gehr et al, 1995;. Hasson et al,
1985; Herzog et al, 1989), surface tension (Joshi et al
1966) and crystallization and precipitation of salts
(Katsuki et al... 1996; Kronenberg, 1985).
Bogatin et al. (1999) observed that by subjecting
the water to the magnetic field degassing occurred,
resulting in an increase in soil permeability, which
leads to increased irrigation efficiency. Khoshravesh
et al. (2011) to submit the ATM, they found that there
was greater soil moisture, compared to AC. Such
changes in soil moisture provided by irrigation with
ATM favored the absorption of macro and
micronutrients by the culture of lettuce.
The changes cause the biggest development in
lettuce, which found the same production value with
lower irrigation volume of ATM compared with AC
irrigation, reducing the total volume of water applied.
Furthermore, it was found that there was the
possibility of reducing the cycle, because the
treatments irrigated with ATM have reached the same
air green matter irrigated with water from the
conventional DAT 35 before completing even 35
DAT (Table 2).
The fuzzy models showed a higher degree of
association with the data collected in the field than the
multiple polynomial regression, being that it was
possible to verify these results from the statistical
tests applied, which proved such a setting. For the
value of the mean square error, it was noted that for
both types of water, as in the two cycles, the lowest
value occurred.
The correlation coefficient was value closer to 1,
therefore, closer to the collected data and the value of
the model's accuracy by calculating the value of "d"
of "Wilmott" also showed the highest values. P value
was also determined to verify the significance of the
models. In all cases analyzed, it was found value p
<0.005.
Carozzi et al. (2013) used the fuzzy model for the
determination of producing maize response occurred
and found that the lowest error when compared with
the regression analysis. Zhang et al. (2013) inferred
fuzzy model that achieved the most accurate results
in determining the uptake of phosphorus by plants.
Polat et al. (2015) found that the application of fuzzy
logic enabled determining more precisely the areas
with contamination risks. Weber et al. (2014)
observed that the fuzzy model for the determination
15 20 25 30 35
40
60
80
100
120
DAT
Lâmina
10
20
30
15 20 25 30 35
40
60
80
100
120
DAT
Lâmina
10
20
30
15 20 25 30 35
40
60
80
100
120
DA
T
Lâmina
10
15
20
25
A
B
A
B
15 20 25 30 35
40
60
80
100
120
DAT
Lâmina
10
20
30
B
A
B
A
Fuzzy Modeling of Development of Sheets Number in Different Irrigation Levels of Irrigated Lettuce with Magnetically Treated Water
167
of the hardness of maize showed more accurate
results.
4 CONCLUSIONS
From the statistical models we found that irrigation,
using ATM, showed higher development for the
number of sheets. Was the possible reduction in the
volume of wastewater to achieve the same production
when subjected to the AC supply. Thus, the
technology enables increased food productivity, and
optimizing water resource without bringing any harm
to health or the environment.
The fuzzy model developed showed a better fit
when compared to the strength of the association
results of the statistical models of multiple
polynomial regression with the data collected in the
field, it has been observed that reducing the MSE and
the increase in value of re "d" of Wilmott .
So it turns out that the fuzzy modeling provides
less error adjustment curves, presenting as a behavior
analysis modeling of the variables tested
experimentally in the field of agricultural sciences.
Was the possible reduction in the volume of waste
water to achieve the same production when subjected
the irrigation with AC. Thus, this technology enables
increased productivity of food.
The method developed in this work is aimed at
preparing the system based on fuzzy rules, without
the presence of espcialista. Thus, such a method is
innovative in the area of experiments assessments.
REFERENCES
Aoda, M. I; Fattah, M. A. (2011). The Interactive Effects of
Water Magnetic Treatment and Deficit Irrigation on
Plant Productivity and Water Use Efficiency of Corn
(Zea Mays L.). The Iraqi Journal of Agricultural
Sciences, 42, 164-179.
Bogatin, J., Bondarenko, N. P., Gak, E. Z., Rokhinson, E.
E., & Ananyev, I. P. (1999). Magnetic treatment of
irrigation water: experimental results and application
conditions. Environmental science & technology,
33(8), 1280-1285.
Buckley, J. J. 2006. Fuzzy Probability and Statistics.
Studies in Fuzziness and Soft Computing. 1. ed. vol.196.
New York: Springer, 270 p.
Carozzi, M., Bregaglio, S., Scaglia, B., Bernardoni, E.,
Acutis, M., & Confalonieri, R. (2013). The
development of a methodology using fuzzy logic to
assess the performance of cropping systems based on a
case study of maize in the Po Valley. Soil Use and
Management, 29(4), 576-585.
Cremasco, C. P., Gabriel Filho, L. R. A., & Cataneo, A.
(2010). Metodologia de determinação de funções de
pertinência de controla-dores fuzzy para a avaliação
energética de empresas de avicultura de postura.
Energia na agricultura, 25(1), 21-39.
Figueiredo, C. C., Ramos, M. L. G., McManus, C. M., & de
Menezes, A. M. (2012). Mineralização de esterco de
ovinos e sua influência na produção de alface.
Horticultura Brasileira, 30(1), 175-179.
Gabriel Filho, L. R., Cremasco, C. P., Putti, F. F., & Chacur,
M. G. (2011). Application of fuzzy logic for the
evaluation of livestock slaughtering. Engenharia
Agrícola, 31(4), 813-825.
Gehr, R., Zhai, Z. A., Finch, J. A., & Rao, S. R. (1995).
Reduction of soluble mineral concentrations in CaSO 4
saturated water using a magnetic field. Water Research,
29(3), 933-940.
Hair, J. F. Anderson, R. E.; Black, W.C.; Tatham, R.L.
2005. Análise Multivariada de Dados. Porto Alegre:
Bookman, 5
th
. edition
Hasson, D., & Bramson, D. (1985). Effectiveness of
magnetic water treatment in suppressing calcium
carbonate scale deposition. Industrial & Engineering
Chemistry Process Design and Development, 24(3),
588-592.
Herzog, R. E., Shi, Q., Patil, J. N., & Katz, J. L. (1989).
Magnetic water treatment: the effect of iron on calcium
carbonate nucleation and growth. Langmuir, 5(3), 861-
867.
Hirata, A. C. S., Hirata, E. K., Guimarães, E. C., Rós, A. B.,
& Monquero, P. A. (2014). Plantio direto de alface
americana sobre plantas de cobertura dessecadas ou
roçadas. Bragantia, 73(2), 178-183.
Hozayn, M., & Qados, A. M. S. A. (2010). Irrigation with
magnetized water enhances growth, chemical
constituent and yield of chickpea (Cicer arietinum L.).
Agriculture and Biology Journal of North America,
1(4), 671-676.
Joshi, K. M., & Kamat, P. V. (1966). Effect of magnetic
field on the physical properties of water. J. Ind. Chem.
Soc, 43, 620-622.
Katsuki, A., Tokunaga, R., Watanabe, S. I., & Tanimoto, Y.
(1996). The Effect of High Magnetic Field on the
Crystal Growth of Benzophenone. Chemistry Letters,
(8), 607-608.
Khoshravesh, M., MostafazadehFard, B., Mousavi, S. F.,
& Kiani, A. R. (2011). Effects of magnetized water on
the distribution pattern of soil water with respect to time
in trickle irrigation. Soil Use and Management, 27(4),
515-522.
Kronenberg, K. J. (1985). Experimental evidence for
effects of magnetic fields on moving water. Magnetics,
IEEE Transactions on, 21(5), 2059-2061.
Lopes, G. N., Kroetz, V. J., Alves, J. M. A., & Smiderle, O.
J. (2010). Irrigação Magnética. Revista Agro@ mbiente
On-line, 1(1), 1-8.
Maheshwari, B. L., & Grewal, H. S. (2009). Magnetic
treatment of irrigation water: Its effects on vegetable
crop yield and water productivity. Agricultural water
management, 96(8), 1229-1236.
FCTA 2015 - 7th International Conference on Fuzzy Computation Theory and Applications
168
Mamdani, E. H., & Assilian, S. (1975). An experiment in
linguistic synthesis with a fuzzy logic controller.
International journal of man-machine studies, 7(1), 1-
13.
Ohse, S., Dourado-Neto, D., Manfron, P. A., & Santos, O.
S. D. (2001). Qualidade de cultivares de alface
produzidos em hidroponia. Scientia Agrícola, 58(1),
181-185.
Ozeki, S., Miyamoto, J., Ono, S., Wakai, C., & Watanabe,
T. (1996). Water-solid interactions under steady
magnetic fields: Magnetic-field-induced adsorption and
desorption of water. The Journal of Physical Chemistry,
100(10), 4205-4212.
Pagano, M.; Gauvreau, K. 2012. Princípios de
Bioestatística. São Paulo: Pioneira Thomson Learning.
Polat, S., Aksoy, A., & Unlu, K. (2015). A Fuzzy Rule
Based Remedial Priority Ranking System for
Contaminated Sites. Groundwater, 53(2), 317-327.
Ross, T. J. (2009). Fuzzy logic with engineering
applications. John Wiley & Sons.
Sala, F. C., & Costa, C. P. D. (2008). Gloriosa': cultivar de
alface americana tropicalizada. Horticultura Brasileira,
26(3), 409-410.
Weber, C., Dai Pra, A. L., Passoni, L. I., Rabal, H. J., Trivi,
M., & Poggio Aguerre, G. J. (2014). Determination of
maize hardness by biospeckle and fuzzy granularity.
Food science & nutrition, 2(5), 557-564.
Yeh, C. T. (2009). Weighted trapezoidal and triangular
approximations of fuzzy numbers. Fuzzy Sets and
Systems, 160(21), 3059-3079.
Zavala, A. A., Bolfarine, H., & de Castro, M. (2007).
Consistent estimation and testing in heteroscedastic
polynomial errors-in-variables models. Annals of the
Institute of Statistical Mathematics, 59(3), 515-530.
Zhang, T., Page, T., Heathwaite, L., Beven, K., Oliver, D.
M., & Haygarth, P. M. (2013). Estimating phosphorus
delivery with its mitigation measures from soil to
stream using fuzzy rules. Soil Use and Management,
29(s1), 187-198.
Fuzzy Modeling of Development of Sheets Number in Different Irrigation Levels of Irrigated Lettuce with Magnetically Treated Water
169
