Examining the Impact of Neutral Theory on Genetic Algorithm
Population Evolution
Seamus Hill and Colm O’Riordan
College of Engineering & Informatics, National University of Ireland Galway, Ireland
Keywords:
Neutral Theory, Genetic Drift, Neutrality, Genotype, Phenotype, Genetic Algorithms.
Abstract:
This paper examines the introduction of neutrality as proposed by Kimura (Kimura, 1968) into the genotype-
phenotype mapping of a Genetic Algorithm (GA). The paper looks at the evolution of both a simple GA (SGA)
and a multi-layered GA (MGA) incorporating a layered genotype-phenotype mapping based on the biological
concepts of Transcription and Translation. Previous research in comparing GAs often use performance statis-
tics; in this paper an analysis of population dynamics is used for comparison. Results illustrate that the MGA
population’s evolution trajectory is quite different to that of the SGA population over dynamic landscapes
and that the introduction of neutrality implicitly maintains genetic diversity within the population primarily
through genetic drift in association with selection.
1 INTRODUCTION
Neutral theory as proposed by Kimura (Kimura,
1968), offered an alternative to the Darwinian view;
stating that the mutations involved in the evolutionary
process are neither advantageous nor disadvantageous
to the survival of an individual and that most muta-
tions are causednot by selection, but rather byrandom
genetic drift. However, in (Kimura, 1983), Kimura
pointed out that although natural selection does play a
role in adaptiveevolution, only a tiny fraction of DNA
changes are adaptive. The vast bulk of mutations are
phenotypically silent.
By adopting the principal of Darwinism, simple
genetic algorithms (SGA), can be viewed as imple-
menting the process of evolution without containing
any explicit neutral mutations. In other words, each
mutation is either an advantage or a disadvantage
to the individual in terms of fitness, with selection
then propagating the fitter individuals. As the search
progresses, the exploration and exploitation ratio de-
creases as the population converges. If we are to im-
plement a genetic algorithm (GA) based on the prin-
ciples of neutral theory then neutrality needs to be
introduced. Neutrality can be viewed as a situation
where a number of different genotypes can represent
the same phenotype. Traditionally, GAs are evaluated
and compared in relation to performance measures.
In this paper, in addition to considering performance,
the authors examine the population dynamics associ-
ated with a SGA and a multi-layered GA (MGA). The
motivation is to develop a tunable, synonymous, non-
trivial GA representation which incorporates neutral-
ity, in order to gain an understanding of the effects of
neutrality on population dynamics. The contributions
are as follows: an analysis of the impact of neutrality
on population evolution; an examination of the im-
pact of neutrality on population variation; and finally
an illustration of the impact of neutrality on pheno-
typic variability.
The paper is laid out as follows: Section 2 gives a
brief background to Neutral theory and the use ofneu-
trality in GAs. Section 3 outlines the MGA used in
the paper, while Section 4 describes the experiments
undertaken. Section 5 outlines and analyses the re-
sults, Section 6 concludes and Section 7 outlines fu-
ture work.
2 BACKGROUND
Neutral Theory as discussed by Kimura (Kimura,
1968), argues that mutation, not selection, is the main
force in evolution. He describes how a mutation from
one gene to another can be viewed as being neutral
if it does not affect the phenotype, as the number of
different genotypes which store genetic information
is far greater than the number of phenotypes. This
implies that the representation from genotype to phe-
notype must incorporate an element of redundancy
196
Hill, S. and O’Riordan, C..
Examining the Impact of Neutral Theory on Genetic Algorithm Population Evolution.
In Proceedings of the 7th International Joint Conference on Computational Intelligence (IJCCI 2015) - Volume 1: ECTA, pages 196-203
ISBN: 978-989-758-157-1
Copyright
c
2015 by SCITEPRESS – Science and Technology Publications, Lda. All rights reser ved
and neutral mutations are possible. Mutations can
be viewed as neutral if they change the genotype but
don’t impact on the phenotype.
Generally, neutrality can be viewed as a situation
where the size of the search space is increased, with-
out an equivalent increase in the solution space. This
results in a situation where a mutated individual, at
the genotypic level, can still represent the same phe-
notype. Neutrality should be beneficial when neutral-
ity changes the search bias in order to improve the
probability of locating the global optimum.
Although originally viewed as being anti-
Darwinian, Kimura (Kimura, 1983) stated that al-
though natural selection is important in evolution, the
number of DNA changes which are adapted in evo-
lution are small, with the vast majority of mutations
being phenotypically silent. Following Kimura, work
by King and Dukes (King and Dukes, 1969) describes
how much of the evolution of proteins is down to neu-
tral mutations and genetic drift. A number of studies
focused on neutral theory (Schuster et al., 1994; Huy-
nen et al., 1996; Huynen, 1996; Schuster, 1997) etc.
and illustrated that by introducing redundant repre-
sentation and thus, neutral mutation, the connectivity
in fitness landscapes can be altered. In other words,
when a number of genotypes represent the same phe-
notype, they can be viewed as a neutral set and in turn
alter the way in which a population explore the search
space.
Previous work on GA genotype-phenotype map-
pings which introduce neutrality, has produced results
indicating the neutrality may prove useful in chang-
ing environments and over more difficult landscapes.
Ebner et al. (Ebner et al., 2001) outlined how high
levels of mutation could be sustained by having neu-
tral networks present. They also identified that neutral
networks assist in maintaining diversity in the popula-
tion, which may be advantageous in a changing envi-
ronment. Similar findings were found in (Grefenstette
and Cobb, 1993). Toussaint and Igel (Toussaint and
Igel, 2002) argued that approaches to self-adaption in
evolutionary algorithms can be viewed as an example
of the benefits of neutrality, because with non-trivial
neutrality, different genotypes which are part of the
same neutral set may have different phenotypic distri-
butions.
3 MULTI-LAYERED GENETIC
ALGORITHM (MGA)
The concepts of Variation and Variability need to be
differentiated. Variation can be described as the dif-
ference between individuals in a population and can
be seen as relating to a collection. Variability, on
the other hand, can be described as the leaning to
vary and the “variability of a phenotypic trait de-
scribes the way in which it changes in response to
environmental and genetic influences” (Wagner and
Altenberg, 1996). When exploring the phenotypic
space, it is critical to gain an understanding of the
variational topology in trying to determine the shape
of the landscape (Toussaint, 2003b). Many evolu-
tionary algorithms are created using a fixed variation
topology, in other words you don’t need to track the
neutrality to explain the evolution trajectory. How-
ever, in nature, phenotypic variation landscapes are
not fixed. These non-fixed phenotypic variation land-
scapes can be referred to as non-trivial in terms of
their genotype-phenotype map (Toussaint, 2003b). A
non-trivial genotype-phenotype map can be viewed
as having the following characteristics: firstly, a phe-
notype can be encoded by many genotypes and sec-
ondly, the phenotypic variability of a number of phe-
notypes will depend on their genotypes (Toussaint,
2003a).
The primary inspiration for the multi-layered GA
can be found in the biological processes of transcrip-
tion and translation. At a very basic level, the bio-
logical process of transcription involves the copying
of information stored in DNA into an RNA molecule,
which is complementary to one strand of the DNA.
The process of translation then converts the RNA, us-
ing a predefined translation table, to manufacture pro-
teins by joining amino acids. These proteins can be
viewed as a manifestation of the genetic code con-
tained within DNA and act as organic catalysts in
anatomy. The MGA includes a layered genotype-
phenotype map which adopts a basic interpretation
of the transcription and translation processes and al-
lows for the implementation of a missense mutation
operator. The genotype search space is represented
by Φ
g
where Φ
g
= {0, 1}
l
and l is the genotype
length. The transcription phase of the MGA maps
the binary genotype to the DNA search space Φ
d
,
where Φ
d
= {A,C, G,T}
l/2
, with the following map-
pings: 00 → A; 01 → C; 10 → G and 11 → T. Fol-
lowing this, a bijective mapping takes place, map-
ping the DNA space to an RNA space Φ
r
, where
Φ
r
= {A,C,G,U}
l/2
. U is included for biological
plausibility and has no impact on the evolution un-
less we include operators at this level. Following tran-
scription, the translation phase takes place, mapping
Φ
r
→ Φ
p
, where Φ
p
represents the phenotype space
and Φ
p
= {0,1}
l/c
, where c is the cardinality chosen
at initialisation to create a translation table. The level
of redundancy is determined by c and in this paper
c = 6 (see Figure 1), and implies |Φ
g
| > |Φ
p
| where
Examining the Impact of Neutral Theory on Genetic Algorithm Population Evolution
197
c > 1. Missense mutation in nature is carried out at the
RNA level. In relation to the MGA, the Missense mu-
tation mapping is as follows: A → U, C → G, G → A
and U → C. To summarise the variation operators,
one-point crossover and single-point mutation occur
at the genotype level prior to transcription and mis-
sense mutation takes place before translation.
The MGA introduces a tunable multi-layered GP-
map, which allows a haploid GA to exhibit, some of
the characteristics normally associated with a diploid.
That is a mechanism for allowing alleles or combina-
tions of alleles which proved useful in previous gen-
erations (Goldberg and Smith, 1987) and thus, main-
taining a form of long term memory without the need
to develop a dominance scheme. The MGA popu-
lation consists of a population of haploid individu-
als, which allows for the use of traditional crossover
and mutation variation operators on the genotype.
This differs from the approach used by diploid GAs
(DGAs) i.e. (Yang, 2006), where each individual
has two chromosomes and crossover is divided into
two steps and mutation is viewed as being neutral.
Another difference between the MGA mapping and
that of a DGA, is that in the DGA, a phenotype al-
lele is made up from a single genotype allele which
is expressed. In the MGA, a single phenotype al-
lele is made from the cardinality incorporated in the
genotype, in this paper we use 6-bits. Although the
MGA’s GP-map is non-deterministic, the approach
differs from that of real-coded binary representation,
which incorporate a gene-strength adjustment mech-
anism (Kubalik, 2005). Real-coded binary represen-
tations can use standard crossover operators, but mu-
tation is implicit due to the gene-strength adjustment
mechanism (Kubalik, 2005).
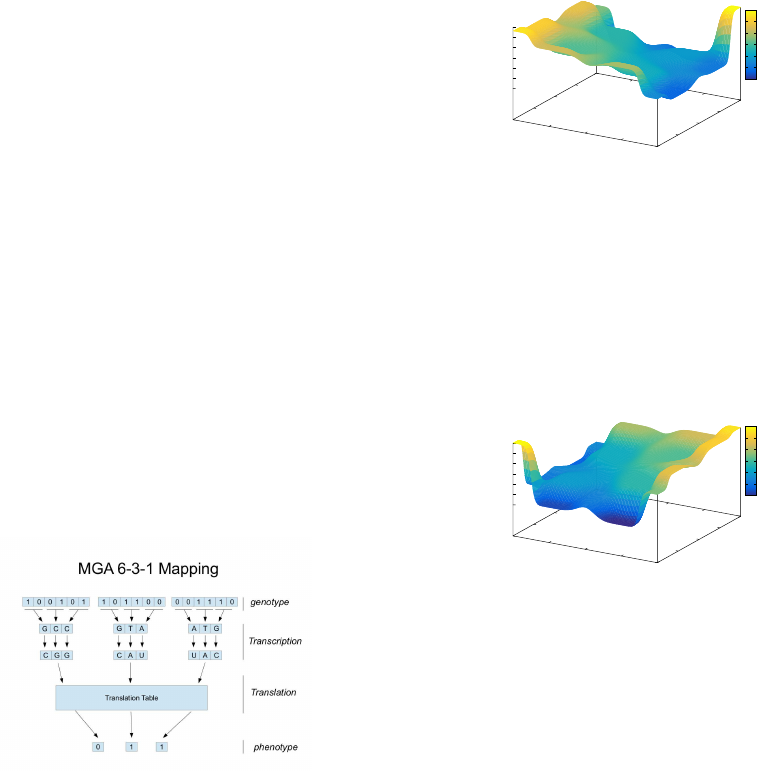
Figure 1: 6-bit MGA Representation Mapping.
4 EXPERIMENTATION
Deception is often used in testing GAs and im-
plies that the search strategy can be misled (Whitley,
1991a). As noted in (Morrison and DeJong, 2002),
diversity is critical for GAs, particularly when the
landscape is evolving as recombining a homogeneous
population will not enable the GA to locate the new
optimum. Hamming difference is used as a measure
of diversity both for the genotypic and phenotypic
diversity. In order to examine the population evo-
lution for both the SGA and the MGA, experiments
were conducted over a 4-bit fully deceptive landscape
(Whitley, 1991b) which is reversed after generation
50, allowing the local optimum to become the global
optimum.
-2
-1
0
1
2
-2
-1
0
1
2
0
5
10
15
20
25
30
Fitness
4-bit Deceptive Landscape
X
Y
Fitness
0
5
10
15
20
25
30
Figure 2: 4-bit Deceptive Landscape.
Figure 2 graphically illustrates the landscape of the
4-bit deceptive problem (Whitley, 1991b), with the x
and y co-ordinates indicating the location on the grid.
To analyse the adaptive qualities of both GAs, the
landscape reverses after generation 50, Figure 3, illus-
trates the landscape after the change, where the global
optimum becomes the local optimum and visa-versa.
-2
-1
0
1
2
-2
-1
0
1
2
0
5
10
15
20
25
30
Fitness
Reversed 4-bit Deceptive Landscape
X
Y
Fitness
0
5
10
15
20
25
30
Figure 3: Reversed 4-bit Deceptive Landscape.
5 RESULTS
The analysis that follows is broken into three parts:
the impact of neutrality on population evolution; the
impact of neutrality on variation and the impact of
neutrality on phenotypic variability. However, the re-
sults begin by comparing both GAs in a conventional
manner based on performance. Figure 4, illustrates
the off-line (averaged best fitness) and on-line (av-
eraged fitness) performance for both the SGA and
the MGA. The results indicate that the changing 4-
bit deceptive landscape initially proved equally easy
for both the SGA and the MGA. However, after the
landscape changes, the SGA becomes trapped on the
local optimum, while the MGA succeeds in locating
ECTA 2015 - 7th International Conference on Evolutionary Computation Theory and Applications
198
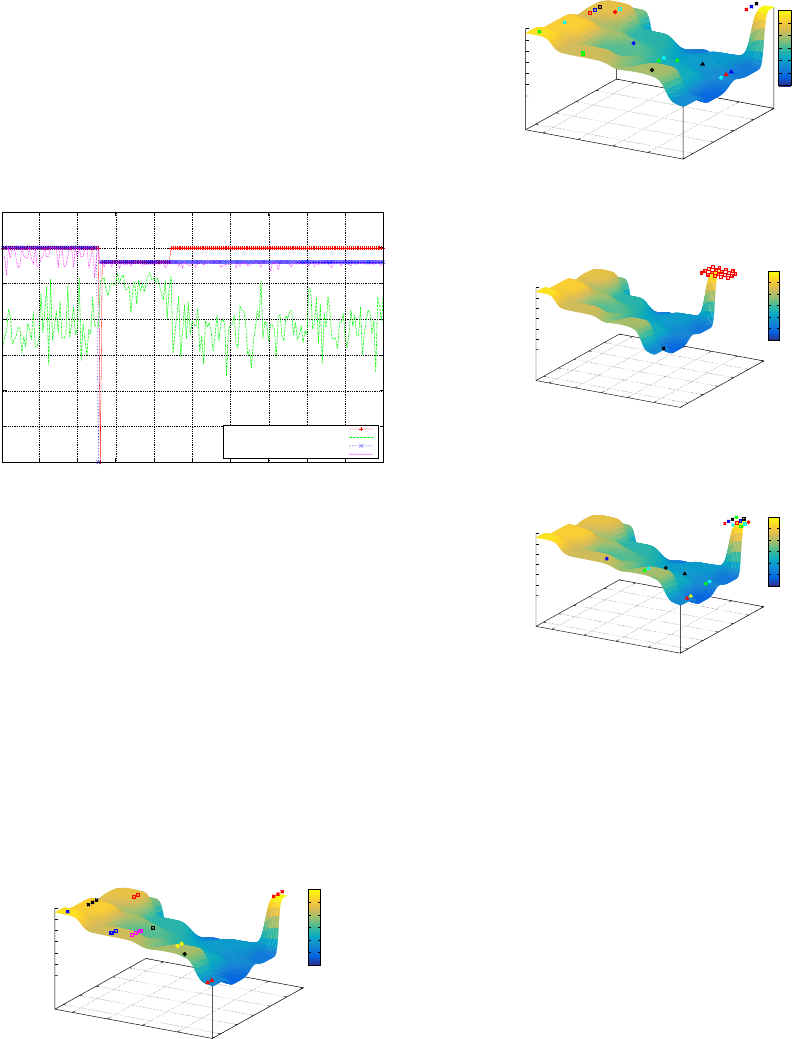
the global optimum. A Wilcoxon Rank sum test in-
dicates that the results shown in Figure 4, that is both
the off-line and on-line comparison between the SGA
and MGA, were statistically significant. The remain-
ing analysis examines the evolution of both popula-
tions, in an attempt to gain a better understanding of
the impact on neutrality on population dynamics over
the course of an evolutionary time period and to illus-
trate the performance of both population in a dynamic
environment.
0
5
10
15
20
25
30
35
20 40 60 80 100 120 140 160 180 200
Fitness
Generations
SGA & MGA 4-bit Deceptive Problem - Online/Offline Performance Analysis
MGA Off-line Performance
MGA On-line Performance
SGA Off-line Performance
SGA On-line Performance
Figure 4: SGA & MGA On-line/Off-line Performance.
5.1 Neutrality & Population Evolution
5.1.1 Analysis Before the Landscape Change
In relation to the evolution of the SGA’s population,
Figure 5 gives an overview of the population distri-
bution over the landscape at generation 0, with the
initial population of 20 individuals randomly spread
over the landscape. Figure 6 shows the MGA popu-
lation distribution over the problem landscape. The
initial randomly generated population distribution for
the MGA is quite similar to that of the SGA.
-2
-1
0
1
2
-2
-1
0
1
2
3
0
5
10
15
20
25
30
Fitness
4-bit Reversed Deceptive Landscape SGA Population Generation 0
X
Y
Fitness
0
5
10
15
20
25
30
Figure 5: SGA - Fitness Landscape Generation 0.
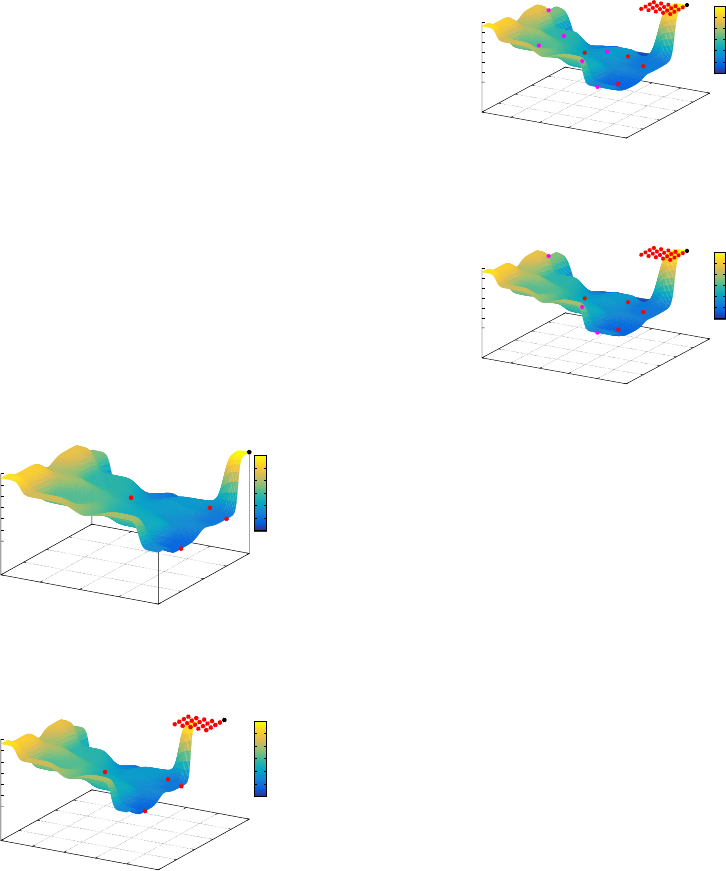
Examining the populations for both GAs at gen-
eration 50, which is the last generation before the
landscape changes, we see that the SGA’s popula-
tion has converged, apart from the impact of mutation
(Figure 7). The MGA’s population has also located
-2
-1
0
1
2
-2
-1
0
1
2
0
5
10
15
20
25
30
Fitness
4-bit Deceptive Landscape MGA Population Generation 0
X
Y
Fitness
0
5
10
15
20
25
30
Figure 6: MGA - Fitness Landscape Generation 0.
-2
-1
0
1
2
3
-2
-1
0
1
2
3
0
5
10
15
20
25
30
Fitness
4-bit Deceptive Landscape SGA Population Generation 50
X
Y
Fitness
0
5
10
15
20
25
30
Figure 7: SGA - Fitness Landscape Generation 50.
-2
-1
0
1
2
-2
-1
0
1
2
3
0
5
10
15
20
25
30
Fitness
4-bit Deceptive Landscape MGA Population Generation 50
X
Y
Fitness
0
5
10
15
20
25
30
Figure 8: MGA - Fitness Landscape Generation 50.
the global optimum. However, due to the genotype-
phenotype mapping, the population doesn’t converge
as much as the SGA. Figure 8, shows the many-to-one
representation present in the population, with differ-
ent genotypes having the same fitness represented by
different colours and shapes.
The MGA population’s evolutionary trajectory
differs considerably by not converging on the global
optimum. Therefore the population consists of a num-
ber of neutral networks, which is a result of gene flow
due to the presence of neutrality.
5.1.2 Analysis After the Landscape Change
Figure 9, illustrates the SGA population distribution
when the landscape changes at generation 51 and
shows the population, which now converges on the
local optimum as the landscape has reversed in rela-
tion to the fitness function. It also indicates all but
one member of the population are located on the local
optimum.
The MGA population can be seen distributed on
Examining the Impact of Neutral Theory on Genetic Algorithm Population Evolution
199
-2
-1
0
1
2
3
-2
-1
0
1
2
3
0
5
10
15
20
25
30
Fitness
4-bit Reversed Deceptive Landscape SGA Population Generation 51
X
Y
Fitness
0
5
10
15
20
25
30
Figure 9: SGA - Fitness Landscape Generation 51.
-2
-1
0
1
2
3
-2
-1
0
1
2
3
0
5
10
15
20
25
30
Fitness
4-bit Reversed Deceptive Landscape MGA Population Generation 51
X
Y
Fitness
0
5
10
15
20
25
30
Figure 10: MGA - Fitness Landscape Generation 51.
the problem landscape in Figure 10, with the bulk of
the population located on the local optimum. The fig-
ure also indicates that due to the presence of neutrality
in the representation, the population is dispersed over
a wider number of fitness plateaus.
Examining the population evolution through to
generation 200 for both GAs. The SGA population
remains trapped on the local optimum (see Figure 11),
while the MGA population remains clustered around
the global optimum, see Figure 12. This appears to in-
dicate that the MGA, through the genotype-phenotype
mapping, implicitly maintains a level of genetic di-
versity within the population and is resistant to con-
vergence, thereby offering the ability to adapt in a dy-
namic environment. The impact of neutrality on pop-
ulation evolution is described in Sub-section 5.1 and
illustrated the population distribution for the SGA and
MGA, both before and after the landscape changed.
5.2 Neutrality & Variation
As a traditional SGA maps directly from the genotype
to the phenotype, both the genotypic search space
and the phenotypic search space are identical. With
the MGA mapping, neutrality increases the geno-
typic search space in comparison to the phenotypic
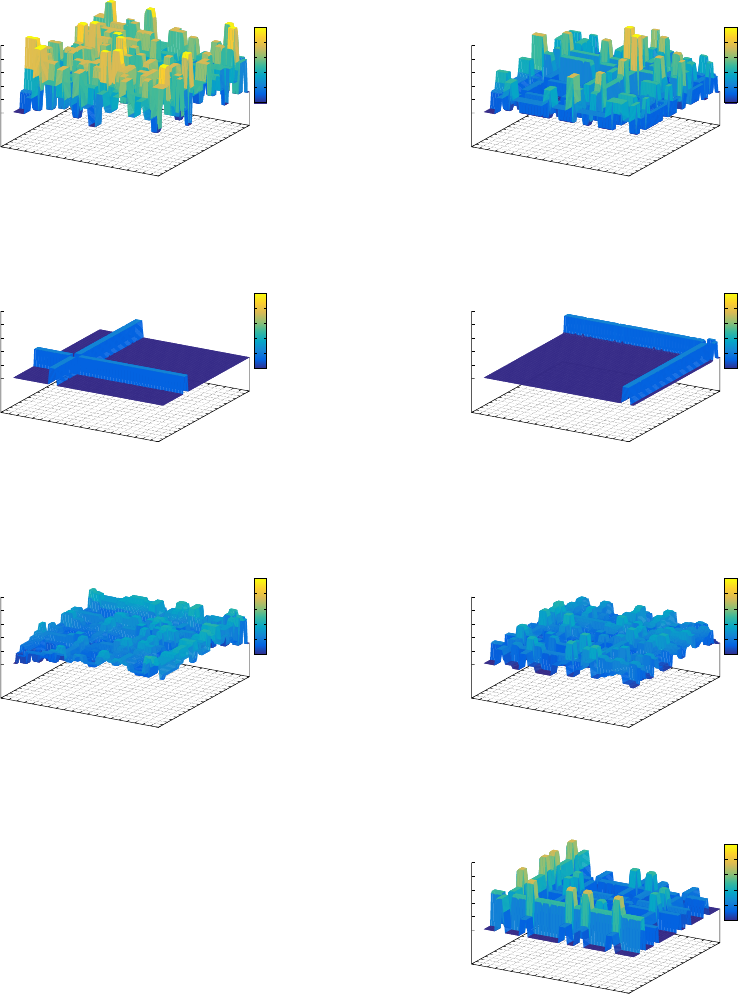
search space. Using normalised Hamming distances
between individuals, Figure 13 and Figure 14, il-
lustrates the population diversity for both the SGA
search spaces and the MGA genotypic search spaces,
respectively, at generation 0. From the figures, it ap-
pears that at generation 0, there is quite a large level
-2
-1
0
1
2
3
-2
-1
0
1
2
3
0
5
10
15
20
25
30
Fitness
4-bit Reversed Deceptive Landscape SGA Population Generation 200
X
Y
Fitness
0
5
10
15
20
25
30
Figure 11: SGA - Fitness Landscape Generation 200.
-2
-1
0
1
2
-2
-1
0
1
2
0
5
10
15
20
25
30
Fitness
4-bit Reversed Deceptive Landscape MGA Population Generation 200
X
Y
Fitness
0
5
10
15
20
25
30
Figure 12: MGA - Fitness Landscape Generation 200.
0
1
2
3
4
5
6
7
8
9
10
11
12
13
14
15
16
17
18
19
20
0
1
2
3
4
5
6
7
8
9
10
11
12
13
14
15
16
17
18
19
20
0
0.2
0.4
0.6
0.8
1
Hamming Distance
SGA Generation 0 - Population Hamming Distance
Genotypes/Phenotypes
Genotypes/Phenotypes
Hamming Distance
0
0.2
0.4
0.6
0.8
1
Figure 13: SGA Genotypic/Phenotypic Diversity Genera-
tion 0.
0
1
2
3
4
5
6
7
8
9
10
11
12
13
14
15
16
17
18
19
20
0
1
2
3
4
5
6
7
8
9
10
11
12
13
14
15
16
17
18
19
20
0
0.2
0.4
0.6
0.8
1
Hamming Distance
MGA Generation 0 - Genotype Population Hamming Distance
Genotypes
Genotypes
Hamming Distance
0
0.2
0.4
0.6
0.8
1
Figure 14: MGA Genotypic Diversity - Generation 0.
of diversity present in both populations. This can
be explained as evolution has not yet begun and the
populations have been randomly generated. Also, as
neutrality is introduced the MGA’s genotypic search
space increases, while the MGA’s phenotypic space
(Figure 15) is quite similar to that of the SGA.
As the populations evolve to generation 50, con-
vergence has occurred in the SGA (apart from the in-
fluence of mutation) and the population is shown in
ECTA 2015 - 7th International Conference on Evolutionary Computation Theory and Applications
200
0
1
2
3
4
5
6
7
8
9
10
11
12
13
14
15
16
17
18
19
20
0
1
2
3
4
5
6
7
8
9
10
11
12
13
14
15
16
17
18
19
20
0
0.2
0.4
0.6
0.8
1
Hamming Distance
MGA Generation 0 - Phenotype Population Hamming Distance
Phenotypes
Phenotypes
Hamming Distance
0
0.2
0.4
0.6
0.8
1
Figure 15: MGA Phenotypic Diversity - Generation 0.
0
1
2
3
4
5
6
7
8
9
10
11
12
13
14
15
16
17
18
19
20
0
1
2
3
4
5
6
7
8
9
10
11
12
13
14
15
16
17
18
19
20
0
0.2
0.4
0.6
0.8
1
Hamming Distance
SGA Generation 50 - Population Hamming Distance
Genotypes/Phenotypes
Genotypes/Phenotypes
Hamming Distance
0
0.2
0.4
0.6
0.8
1
Figure 16: SGA Genotypic/Phenotypic Diversity Genera-
tion 50.
0
1
2
3
4
5
6
7
8
9
10
11
12
13
14
15
16
17
18
19
20
0
1
2
3
4
5
6
7
8
9
10
11
12
13
14
15
16
17
18
19
20
0
0.2
0.4
0.6
0.8
1
Hamming Distance
MGA Generation 50 - Genotype Population Hamming Distance
Genotypes
Genotypes
Hamming Distance
0
0.2
0.4
0.6
0.8
1
Figure 17: MGA Genotypic Diversity - Generation 50.
Figure 16. With the MGA population, genetic diver-
sity is maintained within the genotypic search space,
see Figure 17. The MGA phenotypic search space
(Figure 18) illustrates the diversity at a phenotypic
level.
At generation 200, the SGA population remains
on the local optimum and contains little diversity to
allow it to escape. This situation is shown in Fig-
ure 19, reflecting the lack of diversity within the pop-
ulation when viewed as a function of Hamming dis-
tance.
The MGA genotypic population diversity at gen-
eration 200, is shown in Figure 20 and the pheno-
typic diversity is illustrated in Figure 21. The level of
phenotypic diversity present, relates to the many-to-
one genotype-phenotype mapping and to individuals
of the population being part of other neutral networks.
0
1
2
3
4
5
6
7
8
9
10
11
12
13
14
15
16
17
18
19
20
0
1
2
3
4
5
6
7
8
9
10
11
12
13
14
15
16
17
18
19
20
0
0.2
0.4
0.6
0.8
1
Hamming Distance
MGA Generation 50 - Phenotype Population Hamming Distance
Phenotypes
Phenotypes
Hamming Distance
0
0.2
0.4
0.6
0.8
1
Figure 18: MGA Phenotypic Diversity - Generation 50.
0
1
2
3
4
5
6
7
8
9
10
11
12
13
14
15
16
17
18
19
20
0
1
2
3
4
5
6
7
8
9
10
11
12
13
14
15
16
17
18
19
20
0
0.2
0.4
0.6
0.8
1
Hamming Distance
SGA Generation 200 - Population Hamming Distance
Genotypes/Phenotypes
Genotypes/Phenotypes
Hamming Distance
0
0.2
0.4
0.6
0.8
1
Figure 19: SGA Genotypic/Phenotypic Diversity Genera-
tion 200.
0
1
2
3
4
5
6
7
8
9
10
11
12
13
14
15
16
17
18
19
20
0
1
2
3
4
5
6
7
8
9
10
11
12
13
14
15
16
17
18
19
20
0
0.2
0.4
0.6
0.8
1
Hamming Distance
MGA Generation 200 - Genotype Population Hamming Distance
Genotypes
Genotypes
Hamming Distance
0
0.2
0.4
0.6
0.8
1
Figure 20: MGA Genotypic Diversity - Generation 200.
0
1
2
3
4
5
6
7
8
9
10
11
12
13
14
15
16
17
18
19
20
0
1
2
3
4
5
6
7
8
9
10
11
12
13
14
15
16
17
18
19
20
0
0.2
0.4
0.6
0.8
1
Hamming Distance
MGA Generation 200 - Phenotype Population Hamming Distance
Phenotypes
Phenotypes
Hamming Distance
0
0.2
0.4
0.6
0.8
1
Figure 21: MGA Phenotypic Diversity - Generation 200.
5.3 Neutrality & Phenotypic Variability
The final examination of the effects of neutrality on
the evolutionary trajectory of the MGA population re-
lates to the impact of mutation. In order to examine
the effect of single-bit mutation and missense muta-
tion, we randomly selected an individual from both
Examining the Impact of Neutral Theory on Genetic Algorithm Population Evolution
201
the SGA and MGA populations from various gen-
erations. We then flipped all of the bits, one at a
time, in sequence and measured the impact on fitness.
The aim of this approach is to examine how the pres-
ence of neutrality impacts on mutation in GAs which
have synonymous representations. A representation
is viewed as synonymously redundant if the geno-
types representing the same phenotype have the same
properties and are next to one another in the muta-
tion space. With the MGA population, a genotype,
when mutated, can produce either a silent or an adap-
tive single-bit mutation and a silent or adaptive mis-
sense mutation.
Figure 22 shows the impact of mutation in an SGA
population. Figure 23 visualises the impact of single-
bit mutation on an individual from the MGA popu-
lation. The phenotypic distribution for both GAs is
similar as the neutrality associated with the MGA rep-
resentation is synonymous.
-2
-1
0
1
2
-2
-1
0
1
2
0
5
10
15
20
25
30
Fitness
Genotype 2 - 1111 - One Bit Mutation Neighbours - Generation 0
Y
Y
Fitness
0
5
10
15
20
25
30
Figure 22: SGA 1-Point Mutated Individual.
-2
-1
0
1
2
3
-2
-1
0
1
2
3
0
5
10
15
20
25
30
Fitness
MGA Genotype 3 - 001100101000110110001000 - One Bit Mutation Neighbours - Generation 50
X
Y
Fitness
0
5
10
15
20
25
30
Figure 23: MGA 1-Point Mutated Individual.
The MGA representation includes missense muta-
tion which operates within the layers of the genotype-
phenotype mapping and allows the phenotypic vari-
ability to differ for individuals having the same level
of fitness. Figure 24 illustrates the phenotypic distri-
bution for individual 010000011000010000111000,
showing that the phenotypic distribution for the MGA
is greater than that of the SGA, as individuals are
occupying more fitness plateaus. Figure 25, il-
lustrates the phenotypic distribution for individual
100010011110010000001010, which resides on the
same neutral network with a fitness level of 30. They
-2
-1
0
1
2
3
-2
-1
0
1
2
3
0
5
10
15
20
25
30
Fitness
MGA Genotype - 010000011000010000111000 - Fitness 30 - Bit Mutation & Missense Mutation
X
Y
Fitness
0
5
10
15
20
25
30
Figure 24: MGA 1-Point & Missense Mutated Individual.
-2
-1
0
1
2
3
-2
-1
0
1
2
3
0
5
10
15
20
25
30
Fitness
MGA Genotype - 100010011110010000001010 - Fitness 30 - Bit Mutation & Missense Mutation
X
Y
Fitness
0
5
10
15
20
25
30
Figure 25: MGA 1-Point & Missense Mutated Individual.
show that the MGA population allows individuals re-
siding on the same fitness plateau, have different phe-
notypic distributions. This section highlighted the ef-
fect of mutation, with results illustrating that the SGA
can only access local plateaus, while the MGA, which
can be phenotypically silent, has greater variability.
6 CONCLUSION
A population’s ability to survive in dynamic environ-
ments often depends on a level of diversity to be main-
tained within the population. As a GA search involves
a mapping between the genotype and the phenotype,
a SGA, through it’s one-to-one genotype-phenotype
mapping, quickly eliminates diversity from the popu-
lation through its selection policy and low mutation
rates. The results presented, illustrate that through
the implementation of Neutral theory, as proposed
by Kimura (Kimura, 1968), the genotype-phenotype
mapping of the MGA allows for a tunable, non-trivial,
many-to-one relationship. The contribution of this
form of mapping is the implicit maintenance of re-
lated genetic diversity within the population, which
allows the occupation by the population, of a greater
number of fitness plateaus. By adopting this approach
convergence at a phenotypic level can be achieved,
but genetic diversity is maintained at a genotypic
level. Neutral theory (Kimura, 1968), would suggest
that where genetic changes spread across a popula-
tion, changes may or may not alter the phenotype and
are a result of genetic drift. The results indicated
that neutrality, as introduced by the MGA mapping,
ECTA 2015 - 7th International Conference on Evolutionary Computation Theory and Applications
202
impacts on the search space by increasing its size
and population variation. Finally, the results showed
that adaptive mutations operate in a similar manner to
SGA mutations, but allow a greater number of fitness
plateaus to be reached. Silent mutations, on the other
hand, offer the ability to search the landscape without
impacting on fitness. This increases the size of the
genetic pool and impacts on gene flow.
7 FUTURE WORK
Future work includes comparing the performance of
the MGA with that of other diversity maintenance
techniques over a number of problem landscapes.
REFERENCES
Ebner, M., Langguth, P., Albert, J., Shackleton, M., and
Shipman, R. (2001). On neutral networks and evolv-
ability. In IEEE Congress on Evolutionary Computa-
tion (CEC). IEEE Press.
Goldberg, D. E. and Smith, R. E. (1987). Nonstationary
function optimization using genetic algorithm with
dominance and diploidy. In Proceedings of the Sec-
ond International Conference on Genetic Algorithms
on Genetic Algorithms and Their Application, pages
59–68, Hillsdale, NJ, USA. L. Erlbaum Associates
Inc.
Grefenstette, J. J. and Cobb, H. G. (1993). Genetic algo-
rithms for tracking changing environments. In Proc.
of the 5th Int. Conf. on Genetic Algorithms and their
Applications, pages 523–530. Morgan Kaufmann.
Huynen, M. (1996). Exploring phenotype space through
neutral evolution. Mol Evol, 43:165–169.
Huynen, M., Stadler, P. F., and Fontana, W. (1996). Smooth-
ness within ruggedness: the role of neutrality in adap-
tation. Proc Natl Acad Sci U S A., 93(1):397–401.
Kimura, M. (1968). Evolutionary Rate at the Molecular
Level. Nature, 217(1):624–626.
Kimura, M. (1983). The Neutral Theory of Molecular Evo-
lution. Cambridge University Press.
King, J. L. and Dukes, T. H. (1969). Non-Darwinian Evo-
lution. Science, 164:788–798.
Kubalik, J. (2005). Using genetic algorithms with real-
coded binary representation for solving non-stationary
problems. In Ribeiro, B., Albrecht, R. F., Dobnikar,
A., Pearson, D. W., and Steele, N., editors, Adaptive
and Natural Computing Algorithms, pages 222–225.
Springer Vienna.
Morrison, R. W. and DeJong, K. A. (2002). Measurement
of population diversity. In In 5th International Con-
ference EA, 2001, volume 2310 of Incs. Springer.
Schuster, P. (1997). Genotypes with Phenotypes: adven-
tutes in an RNA toy world. Biophys Chem, 66(2):75–
110.
Schuster, P., Fontana, W., Stadler, P. F., and Hofacker, I. L.
(1994). From sequences to shapes and back: a case
study in RNA secondary structures. Proc R Soc Lond
B Biol Sci, 255(1344):279–284.
Toussaint, M. (2003a). Demonstrating the evolution of
complex genetic representations: An evolution of ar-
tificial plants. In In Proceedings of the 2003 Genetic
and Evolutionary Computation Conference (GECCO
2003), pages 86–97. Springer-Verlag.
Toussaint, M. (2003b). On the evolution of phenotypic ex-
ploration distributions. In DeJong, K. A., Poli, R., and
Rowe, J., editors, Foundations of Genetic Algorithms
7 (FOGA VII), pages 169–182. Morgan Kaufmann.
Toussaint, M. and Igel, C. (2002). Neutrality: A neces-
sity for self-adaptation. In In Proceedings of the IEEE
Congress on Evolutionary Computation (CEC 2002),
pages 1354–1359.
Wagner, G. P. and Altenberg, L. (1996). Complex adap-
tations and the evolution of evolvability. Evolution,
50(3):967–976.
Whitley, L. D. (1991a). Fundamental principles of decep-
tion in genetic search. In Rawlins, G. J., editor, Foun-
dations of genetic algorithms, pages 221–241. Mor-
gan Kaufmann, San Mateo, CA.
Whitley, L. D. (1991b). Fundamental principles of decep-
tion in genetic search. In Foundations of Genetic Al-
gorithms, pages 221–241. Morgan Kaufmann.
Yang, S. (2006). On the design of diploid genetic algorithms
for problem optimization in dynamic environments.
In Evolutionary Computation, 2006. CEC 2006. IEEE
Congress on, pages 1362–1369.
Examining the Impact of Neutral Theory on Genetic Algorithm Population Evolution
203
