Managing Knowledge in Enterprises
Evidences from China
Maria Obeso
1
and Maria J. Luengo-Valderrey
2
1
Department of Business Administration, University of Cantabria, Avda. Los Castros, 56, Santander, Spain
2
Department of Management Evaluation and Business Innovation, University of the Basque Country, Bilbao, Spain
Keywords: Knowledge Management, Km Strategy, Knowledge Sharing, Knowledge Creation, China.
Abstract: Knowledge management is an essential key in order to obtain competitive advantages in organizations. In
this scenario, an interesting study about the first global power, China, is presented. The paper analyzes how
Chinese enterprises manage their knowledge using variables linked to knowledge sharing and knowledge
creation. Data were extracted by World Bank between December 2011 and February 2013, and the analysis
has two parts. First the percentage of innovative enterprises within China is identified and then, a
descriptive analysis about the situation of Chinese innovative firms is realized. In addition ANOVA
technique is used. Results show that almost the half of Chinese enterprises (around 47 per cent) is
considered as innovative, and these innovative firms make decisions focused on active measures related to
knowledge management. Then they realize an active used of new technologies in order to communicate
with people related to the organization (sharing knowledge) and also to develop new ideas within the
organization (creation knowledge). Chinese Government could use our paper in order to know how their
enterprises manage their knowledge and, accordingly, they could motivate non-innovative enterprises to
incorporate actively knowledge management process.
1 INTRODUCTION
In today´s society, knowledge is considered as an
essential resource for organizations in order to
achieve competitive advantages (Nonaka and
Takeuchi, 1995). Its popularity as an excellent
management tool has increased rapidly as can be
demonstrated by the growing number of research in
the area (Edvardsson, 2009).
In this scenario an original analysis located in
one of the most interesting countries around the
world is presented: China. China has had an
extraordinary growth in the last years transforming
the first global power. From this point, the aim of
this paper is to identify what innovative enterprises
in the first global power are doing related to
knowledge management. First, the degree of
innovation from Chinese is identified firms
analyzing what percentage of them is considered as
innovative. Then we set out if there are any
differences in innovation results within the
innovative firms based on industries. Finally, the
Chinese situation is explained in order to contribute
to the literature explaining what innovative
enterprises in the first global power are doing
managing their knowledge.
2 THEORETICAL FRAMEWORK
2.1 Knowledge Management
Nowadays, we are in society known as “knowledge
society”, concept introduced by Taichi Sakaiya in
1991 bringing to light the relevance of knowledge
for people in general and organizations in particular.
Accordingly, knowledge is considered a key
resource and knowledge management is considered
an essential tool in order to achieve competitive
advantages (Zyngier and Venkitachalam, 2011)
because it cannot be imitated easily by competitors,
thus the process is related to business survival (Liao
et al., 2008).
There are several definitions about knowledge
management, because it includes different activities
such as data collection, analysis, storage, diffusion
or use in organizations (Lancioni and Chandran,
2009). For instance Kebede (2010) defines the
Obeso, M. and Luengo-Valderrey, M..
Managing Knowledge in Enterprises - Evidences from China.
In Proceedings of the 7th International Joint Conference on Knowledge Discovery, Knowledge Engineering and Knowledge Management (IC3K 2015) - Volume 3: KMIS, pages 111-118
ISBN: 978-989-758-158-8
Copyright
c
2015 by SCITEPRESS – Science and Technology Publications, Lda. All rights reserved
111
process as manage process and tools linked with
knowledge with the aim to take advantage of its
potential and support to decision making process
facilitating innovation and creativity promoting
competitive advantages.
Knowledge management is linked to two
processes: knowledge sharing and knowledge
creation interrelated between each other, considering
knowledge sharing like the previous step of
knowledge creation (Nonaka, 1991). Both of them
are influenced by managers who support knowledge
sharing and knowledge creation in enterprises (Reid,
2014).
2.1.1 Knowledge Sharing
Knowledge sharing is defined as “the provision of
task information and know-how to help others and to
collaborate with others to solve problems, develop
new ideas or implement policies or procedures (…)
and it can occur via written correspondence or face-
to-face communications through networking with
other experts, of documenting, organizing and
capturing knowledge for others” (Wang and Noe,
2010, p. 117). Accordingly this process is related to
acquire knowledge (Chow and Chan, 2008).
Literature about knowledge management shows
that knowledge sharing is linked with several
benefits within organizations like reductions in
production costs, improve team performance,
increase innovation activity and, then, increase
firm´s performance between others (Cummings,
2004). In addition, in difficult situations knowledge
management could increase the credibility of firm´s
commitments because of the interrelations in
organizations (McEvily et al., 2000). Following
Amayah “in the knowledge-based economy,
knowledge sharing is increasingly viewed as critical
to organizational effectiveness” (2013: p. 454).
Although with general character knowledge
sharing related to research and learning in the
Universities is the most common, enterprises can´t
forget it (Fullwood et al., 2013). Knowledge sharing
is related to inter-organizational communication,
that is to say, between employees (internal process),
but also knowledge could be shared with suppliers
or clients (external process) (Renzl, 2008). Besides
this, enterprises should promote wellness with the
aim of preventing disengagement from knowledge
sharing (Ford et al., 2015).
2.1.2 Knowledge Creation
Knowledge creation is related to new knowledge. In
this way, this concept is linked to the innovation
process. Plessis defines innovation as “the creation
of new knowledge and ideas to facilitate new
business outcomes, aimed at improving internal
business processes and structures and to create
market driven products and services” (2007: p. 21).
Authors like Parlby and Taylor (2000) (cited by
Plessis, 2007) explain that knowledge management
process support innovation activity within the
organization, because it promotes the development
of new ideas and the organization´s thinking. In this
sense, Amar and Juneja show the relationship
between innovation and knowledge like an analogy
from a plant: “The seed is the tacit knowledge, the
fertilizer is the explicit knowledge and the soil is
human creativity; all three are essential to get
innovation” (2008: p. 299). Following Akhavan et
al. (2014) there is a positive relationship between
knowledge creation process and organizational
performance. That highlights knowledge creation
process.
There is a positive relationship between research
and development (R&D) activity and innovation,
because R&D is considered font of the innovation
process (Crepon et al., 1998). Following Roper et al.
(2008: p. 843) “R&D increase the market success of
innovative products”, and a strong R&D expenditure
influence internal knowledge needed for product
innovation (Rosenberg, 1990).
Authors like Boisot (1998) has been identified a
positive relationship between organizational learning
and knowledge creation. Addleson (1999) defines
organizational learning like the process to obtain
knowledge and develop abilities in employees in
order to improve the performance. Accordingly the
main aim of organizational learning is develop new
knowledge and increase knowledge existing in
organization (Pemberton and Stonehouse, 2000).
2.2 The Case of China
For the first time in the recent history, China lead the
global rank in 2014, overtaken The United States of
America if the gross domestic product (GDP) is
measured using the purchasing power parity (PPP)
(data extracted from International Monetary Fund
(IMF) website). This event is according to the
prevision realized by O´Neill in 2001, when the
economist from Goldman Sachs identified the
countries known as BRIC, acronym of their names:
Brazil, Russia, India and China. O´Neill predicted
the extraordinary growth of China before this
country took off.
Curiously the majority of Chinese enterprises are
between 6 and 15 years old (more than 70 per cent
KMIS 2015 - 7th International Conference on Knowledge Management and Information Sharing
112
of them), thus the creation of new enterprises in
China coincided with the publication of O´Neill´s
contribution.
China is a country located on East Asia and
Pacific region with a population around 1,357 billion
of inhabitants, the most populous country in the
world (World Bank, 2015). The country has a high
human development index (position 91) (UNDP,
2014), and a GDP per capita in the year of analysis
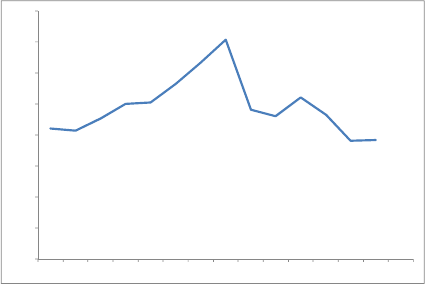
(2011) around US$11477 (UNDP, 2015). In this
way, its GDP growth since the year 2000 has been
always positive fluctuating between 7 and 15 per
cent (see Figure 1). Following IMF (2014),
predictions show that China will maintain a
sustainability growth, less every time; in the year
2019, predictions estimate a GDP growth around 6
per cent.
3 METHODOLOGY
3.1 Data Collection
Data has been collected in China between December
2011 and February 2013 by The World Bank. A
total of 2,700 privately-owned and 148 state-owned
were successfully interviewed over this period
referring to the last complete fiscal year (2011).
Following the information about the data, the sample
for China was selected using stratified random
sampling in order to make sure that the final total
sample includes establishments from all different
sectors and obtains unbiased estimates for different
subdivisions of the whole population. The data
included questionnaire-based responses on data in
the following areas: general information from
recipients, infrastructure and services, sales and
supplies, innovation and degree of competition, land
and permits, crime, finance, business development
services, business-government relations, labour
business environment and performance.
Database has been obtained from Microdata
Library, a service established by Enterprise Surveys
(from World Bank) to provide information about
people living in developing countries, their
institutions, their environment, their communities
and the operation of their economies (World Bank,
2015).
Enterprises belong to the following industries:
food, textiles, garments, chemicals, plastics &
rubber, non metallic mineral products, basic metals,
fabricated metal products, machinery and
equipment, electronics, transport machines, retail,
wholesale, information technology (IT), hotel and
restaurants (section H), services of motor vehicles,
construction (section F), transport (section I) and
other manufacturing. In addition sample includes
some 100 per cent state owned enterprises.
Authors have succeeded to database in April
2015, where the last data updated from China was
2011.
Figure 1: China´s GDP growth.
(Source: compiled by authors. Data extracted from World Bank
Database, 2015).
3.2 Statistical Technique
First, in order to realize a comparison between the
behaviour of innovative and non-innovative
enterprises linked to knowledge management, those
firms considered as innovative have been selected.
For this aim, innovative enterprises are considered
those companies that have introduced new products
or services in the last three years.
In the second step, we have used ANOVA
technique in order to know if there are any
differences between industries in Chinese innovative
enterprises related to innovation results. For
ANOVA analysis a result variable known as the
“Percentage of the establishment´s total annual sales
was accounted for by products or services that were
introduced in the last three years” has been chosen.
ANOVA technique is a statistical method used
with the aim of compare some groups regarding a
quantitative variable. In this way the method is used
to analyze if there is any difference between groups
(or not) (Hair et al., 1995).
Before the application of ANOVA, the Levene´s
test has been calculated to assess the equality of
variances for a variable calculated for two or more
groups (see Table 1). In this way, significance is less
than 0,05 thus null hypothesis is rejected that is to
say variances between variables are different.
As a consequence in ANOVA
post-hoc comparisons are performance using T2 of
0,00
2,00
4,00
6,00
8,00
10,00
12,00
14,00
16,00
2000 2001 2002 2003 2004 2005 2006 2007 2008 2009 2010 2011 2012 2013
Managing Knowledge in Enterprises - Evidences from China
113

Table 1: Levene´s test.
Levene´s test d.f1 d.f2 Significance
2,279 19 1272 0,001
Tamhane´s test (see Table 2). Significance is more
than 0,05 therefore there are not differences between
industries in innovative enterprises related to the
knowledge results measured.
Table 2: ANOVA test.
Sum of
squares
d.f
.
Mean
square
F Sig.
Between
groups
7510,775 19 395,304 0,980 0,482
Within
groups
512866,015 1272 403,197
Total 520376,789 1291
In the last step, after the ANOVA analysis, an
analysis about how Chinese innovative enterprises
managing their knowledge is presented using
descriptive analysis and comparing the situation of
innovative and non-innovative firms.
3.3 Description of Variables
In the first step, where enterprises are considered as
innovative are identified, a dichotomous variable is
used from the following question: “In the last three
years, has this establishment introduced any new
products or services?”. Respondents could choose
between “Yes” (innovative enterprises) and “No”
(non-innovative enterprises).
Besides this the paper have analyzed if there are
any different between innovation results comparing
the Chinese industries. For this comparison a scale
variable is used extracted from the following
question in the questionnaire: “In the fiscal year
2011, what percent of this establishment´s total
annual sales was accounted for by products or
services that were introduced in the last three
years?”.
In the descriptive analysis, the last step, variables
related to the knowledge management process in
Chinese enterprises with the aim of draw Chinese
situation are selected. These variables have been
categorized as knowledge sharing and knowledge
creation (see Appendix).
4 RESULTS AND DISCUSSION
Around 47 per cent of Chinese enterprises have
introduced at least a new product or service in the
last three years. In this paper, these companies are
known as “innovative enterprises” while those
companies that they have not introduced new
products or services in the last three years are known
as “non-innovative enterprises”. ANOVA´s test
shows that there are not any differences between
industries regarding the results (see Table 2), but
there are some industries with a high level of
innovative enterprises. In this way enterprises
belong to electronics, wholesale and IT have a
percentage over the average (53,1 per cent, 62,9 per
cent and 58,1 per cent respectively) while for
instance companies from transport or other
manufacturing have a percentage of enterprises
introducing new products or services in the last three
years less than the average (20 per cent and 35,6 per
cent respectively).
The majority of innovative enterprises are
located in a main business city (around 92 per cent
of them) and the years of experience working in this
sector the top manager have are about 17. Currently
they use cell phones for the operations of the
establishment and also they use them for inter-
organizational relationships and transactions. By
contrast only 85,5 per cent of non innovative
enterprises are located in a main business city,
although their top managers have an average of
experience very similar to innovative and they also
realize a heavy use of cell phones (see Table 3).
Research and development (R&D) activities
keep in mind, especially those related to internal
generation. Accordingly around 68 per cent of
innovative enterprises have spent on R&D in the last
three years but only about 20 per cent have spent on
R&D contracted with other companies. Regarding
the new products or services, more than 77 per cent
have been developed using internal R&D while only
36,4 per cent of them have used external support. At
the same time, regarding the new process a 78,6 per
cent have been developed inside and just 39 per cent
have used external resources. On the contrary the
situation of non innovative enterprises is very
different, because they present lower percentages
than innovative. For instance only a 18,34 per cent
of them invest in R&D activities.
Linked to Internet, about 91 per cent of
enterprises use e-mail in order to communicate with
clients and suppliers regularly, and they also use it
for inter-organizational relationships and
transactions (91,7 per cent). In addition more than
70 per cent of firms use Internet connection to
develop ideas on new products and services, and
around a 78 per cent of them has their own website.
In comparison, the percentage of non innovative
enterprises using e-mail to interact with clients and
KMIS 2015 - 7th International Conference on Knowledge Management and Information Sharing
114

supplier is only 82,3 and for inter-organizational
relationships a 68,54 per cent. In addition only
around a 40 per cent of enterprises use internet to
develop new ideas.
Table 3: Comparison between innovative and non-
innovative enterprises.
Innovative Non-innovative
KNOW_SHA1 17 16,06
KNOW_SHA2 91,8 82,3
KNOW_SHA3 77,6 67,7
KNOW_SHA4 70,9 40,8
KNOW_SHA5 99,8 98,9
KNOW_SHA6 99,1 97,1
KNOW_SHA7 91,7 68,5
KNOW_SHA8 80,2 58,2
KNOW_SHA9 61,5 33,6
KNOW_SHA10 77,3 53,8
KNOW_SHA11 36,4 19,9
KNOW_SHA12 78,6 58,7
KNOW_SHA13 39,2 25
KNOW_SHA14 82,1 61,2
KNOW_SHA15 33,2 22,3
KNOW_SHA16 45,9 27,3
KNOW_SHA17 50,4 30,4
KNOW_SHA18 79,4 63,6
KNOW_SHA19 35,2 29,7
KNOW_SHA20 42,3 26,8
KNOW_SHA21 41,4 26,7
KNOW_SHA22 68,1 18,4
KNOW_SHA23 20,9 -
KNOW_SHA24 63,74 57,55
KNOW_SHA25 88,11 94,43
KNOW_SHA26 75,22 75,37
KM_CREA2 23,65 -
KM_CREA3 89,6 39
KM_CREA4 69,7 29,8
KM_CREA5 63,6 31,6
KM_CREA6 82,2 59,8
KM_CREA7 82,7 26,5
KM_CREA8 72,2 29,6
KM_CREA9 83,9 66,2
KM_CREA10 77 51,4
The majority of enterprises also use specific
software in order to share data like for example
enterprise resource planning (ERP) systems or
customer relationship management (CRM) systems.
In this way, a 61,5 per cent of firms use this type of
software and more than 80 per cent of them use
online web-based systems for inter-organizational
relationships and transactions. By contrast the use of
these software in non innovative enterprises is
smaller (33,6 per cent and 58,2 per cent
respectively).
In the last three years a 89,6 per cent of
enterprises have introduced new technology and
equipment for product or process improvements,
around 70 per cent of them have introduce new
quality control procedure in production operations,
about 63 per cent introduce new managerial
processes, more than 82 per cent have provided
technology training for staff, a 82,7 per cent have
introduced new product or new service, more than
72 per cent have added new features to existing
products or services, a 83,9 per cent have taken
measures to reduce production cost and a 77 per cent
have taken actions to improve production flexibility.
Regarding the new products or services, more
than 82 per cent of enterprises developed them in
house, around 50 per cent introduced their own
version of a product already supplied by another
firm, a 45,9 per cent developed them cooperating
with their clients and only a 33 per cent of
enterprises developed the ideas collaborating with
suppliers.
Regarding the new process, more a 79,4 per cent
of enterprises developed them in house, around 41
per cent introduced their own version of a product
already supplied by another firm, a 42,3 per cent
developed them cooperating with their clients and
only a 35 per cent of enterprises developed the ideas
collaborating with suppliers.
In innovative enterprises more than 63 per cent
of full time workers have finished the secondary
school while this figure is 57,55 in the case of non
innovative enterprises. Both of production and non
production employees receive formal training (88,11
per cent and 78,22 per cent in the case of enterprises
categorized as innovative and 94,93 per cent and
75,77 per cent in the case of enterprises categorized
as non innovative).
However, the situation related to training
employees between innovative and non-innovative
Chinese enterprises is different. The percentage of
full-time permanent production workers receiving
formal training is around 88 per cent in innovative
enterprises, and around 94 per cent in non-
innovative enterprises. The percentage of full-time
permanent non-production workers receiving formal
training is 78,22 per cent in the case of innovative
firms, and 75,77 per cent in the case of non
innovative firms. In this way, it seems innovative
enterprises do not bet more than others related to this
variable. Finally the years of experience that top
managers have also are the same in both categories:
17 years in innovative enterprises and around 16
years in non-innovative enterprises.
With general character innovative enterprises
realize a heavy use of information and
Managing Knowledge in Enterprises - Evidences from China
115
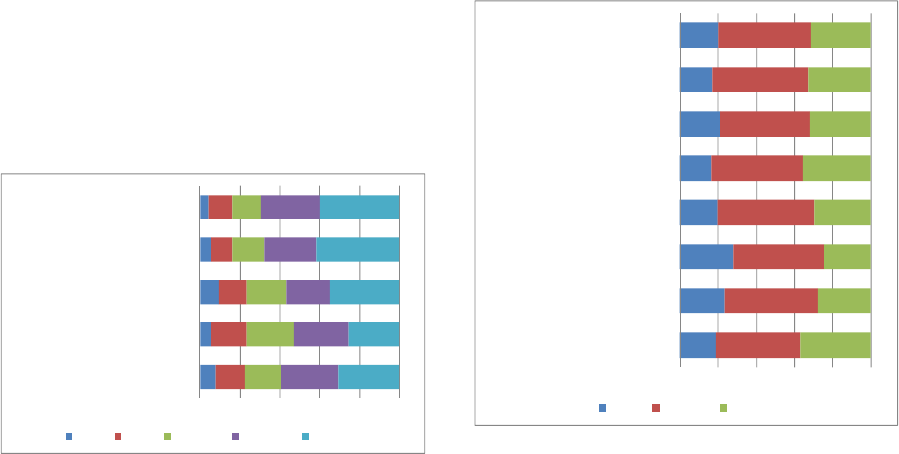
communication technologies (ICT) as for instance
computers, internet or software. As a result customer
and partner relations, marketing and sales,
production and operations and product and service
enhancement have been beneficiary by these
technologies because firms use them a lot in support
of the activities (see Figure 2).
Figure 2: ICT used to support the following processes.
(Source: compiled by authors. Data extracted from World Bank
Database, 2015).
In addition ICT have been used in order to realize
innovative activities like take actions to improve
production flexibility, take measures to reduce
production cost, add new features to existing
products or services, introduce new product or new
service, provide technology training for staff,
introduce new managerial processes, introduce new
quality control procedure in production or operations
and introduce new technology and equipments for
product or process improvements (see Figure 3).
In summary, nearly half of Chinese enterprises
are considered as innovative, that is to say, they have
introduced a new product or a new service in the last
three years. These innovative enterprises carry out
more measures related to knowledge management
than non-innovative firms.
In general, Chinese innovative enterprises realize
a high use of the new technologies, both
communication and develop new ideas. In this sense,
the majority of them have specific software to
manage information within the company and to
promote inter-organizational communication.
Almost all the firms use cell phones, fax and Internet
connection to communicate with clients, suppliers
and other people linked to the organization. In
addition Internet connection is used to develop new
ideas as new processes, products, services or
managerial processes, between others.
Finally, innovative enterprises pays attention to
R&D activity, specially that R&D generated using
Figure 3: ICT used to support the following processes.
(Source: compiled by authors. Data extracted from World Bank
Database, 2015).
internal resources where the investment is high.
However external R&D investment is less than
internal. In any case, innovative enterprises invest
more than non-innovative enterprises in R&D (both
internal and external resources).
These results are along the same lines explained
in the previous section, theoretical framework,
where authors highlighting the relationship between
knowledge sharing and knowledge creation (for
instance, Nonaka, 1991). Accordingly Chinese
innovative enterprises bet on knowledge sharing
measures using ICTs and, as consequently, they
achieve knowledge creation introducing new
products and services.
5 CONCLUSIONS
The extraordinary growth of China, considered at
present time as the first global power in the world,
identifies this country and their enterprises as
interesting cases of study. Besides this, an analysis
about Chinese enterprises, started from a point of
view based on how they manage their knowledge, is
presented.
Accordingly, we have identified that almost the
half of Chinese enterprises are considered as
innovative, and these innovative firms realize active
measures related to knowledge management. This
means that they use new technologies regularly in
order to communicate with people related to the
0% 20% 40% 60% 80% 100%
Partner relations
Product and service enhancement
Production and operations
Marketing and sales
Customer relations
Never Rarely Sometime Frequently All the time
0% 20% 40% 60% 80% 100%
Introduce new technology and
equipments for product or process
improvements
Introduce new quality control
procedure in production or operations
Introduce new
managerial/administrative processes
Provide technology training for staff
Introduce new product or new service
Add new features to existing products
or services
Take measures to reduce production
cost
Take actions to improve production
flexibility
No use Some use Heavy use
KMIS 2015 - 7th International Conference on Knowledge Management and Information Sharing
116
organization, and also to develop new ideas within
the organization. As a result a significant percentage
of their total annual sales is derived from their
innovation activity.
This result is interesting for different people. On
one hand, a vision of China is offered. In this way,
Chinese Government could be used our paper in
order to know how their enterprises manage their
knowledge. Accordingly, they could motivate to
non-innovative enterprises to incorporate actively
knowledge management process. On the other hand,
paper could be useful to Chinese enterprises. They
could know how they are categorized (innovative or
non-innovative enterprises) and then they could take
decisions if they need increase knowledge
management. In addition this paper could be useful
to scholars and people interested on knowledge
management in enterprises, because the paper shows
an example about enterprises in the first global
power.
The analysis has some limitations. First, the year
analyzed (2011), although is the most updated year,
is past. It could be interesting realize again the
analysis with a year more recent. On the other hand,
descriptive analysis supposes a first step, but it need
to be completed with other statistical techniques.
Finally the innovative enterprises selection is
conditioned by database, where the variable used is
the most suitable standard but it is not the best
because it is biased by the fact that success/failure
attached to this product or service is not considered.
Then in the future this database could be used to
other analysis like, for example, regressions or
similar in order to analyze what variables affect
knowledge performance. In addition a comparison
between different years it could be interesting in
order to know the changes within the country.
ACKNOWLEDGEMENTS
The authors thank to The World Bank and
Enterprise Surveys for the work collecting data.
REFERENCES
Addleson, M., 1999. What is a good organization?:
Learning organizations, community and the rhetoric of
the ‘Bottom Line’. European Journal of Work and
Organizational Psychology 9(2), 233-252.
Akhavan, P., Ramezan, M., Jafar, Y.M., Mehralian, G.,
2014. Exploring the relationship between ethics,
knowledge creation and organizational performance.
VINE 44(1), 42-58.
Amar, A.D., Juneja, J.A., 2008. A descriptive model of
innovation and creativity in organizations: A synthesis
of research and practice. Knowledge Management
Research & Practice 6, 298-311.
Amayah, A.T., 2013. Determinants of knowledge sharing
in a public sector organization. Journal of Knowledge
Management 17, 454-471.
Boisot, M.H., 1998. Knowledge assets: Securing
competitive advantage in the information economy,
Oxford University Press. New York.
Chow, W.S., Chan, L.S., 2008. Social network, social trust
and shared goals in organizational knowledge sharing.
Information & Management 45(7), 458-465.
Crepon, B., Duguet, E., Mairesse, J., 1998. Research,
innovation and productivity: An econometric analysis
at the firm level. Economics of Innovation and New
Technology 7, 115-158.
Cummings, J.N., 2004. Work groups, structural diversity
and knowledge sharing in a global organization.
Management Science 50(3), 352-364.
Edvardsson, I.R., 2009. Is Knowledge Management losing
ground? Developments among Icelandic SMEs.
Knowledge Management Research and Practice 7, 91-
99.
Ford, D., Myrden, S.E., Jones, T.D., 2015. Understanding
“disengagement from knowledge sharing” engagement
theory versus adaptive cost theory. Journal of
Knowledge Management 19, 476-496.
Fullwood, R., Rowley, J., Delbridge, R., 2013.
Knowledge sharing amongst academics in UK
Universities. Journal of Knowledge Management 17,
123-136.
Hair, J.F., Anderson, R.E., Tatham, R., Black, W., 1995.
Multivariate data analysis, Prentice Hall. Englewood
Cliffs, NJ.
International Monetary Fund (IMF), 2014. People´s
Republic of China. IFM Country Report No. 14/235.
International Monetary Fund (IMF), 2015.
http://www.imf.org/external/index.htm (accesed 7 may
2015).
Kebede, G., 2010. Knowledge management: An
information management perspective. International
Journal of Information Science 30, 416-424.
Lancioni, R.A., Chandran, R., 2009. Managing knowledge
in industrial markets: New dimensions and challenges.
Industrial Marketing Management 38(2), 148-151.
Liao, S.-H., Fei, W.-C., Liu, C.-T., 2008. Relationships
between knowledge inertia, organizational learning
and organization innovation. Technovation 28, 183-
195.
McEvily, S.K., Das, S., McCabe, K., 2000. Avoiding
competence substitution thorugh knowledge sharing.
Academic Management Review 25, 2294-311.
O´Neill, J., 2001. Building better global economic BRICs.
Global Economics Paper No: 66, Goldman Sachs.
Nonaka, I., 1991. The knowledge creating company.
Harvard Business Review Nov-Dec, 96-104.
Nonaka, I., Takeuchi, H., 1995. The knowledge creating
company: How Japanese companies create the
Managing Knowledge in Enterprises - Evidences from China
117
dynamics of innovation, Oxford University Press. New
York.
Pemberton, J.D., Stonehouse, G.H., 2000. Organizational
learning and knowledge assets-An essential
partnership. The Learning Organization 7(4), 184-194.
Plessis, M., 2007. The role of knowledge management in
innovation. Journal of Knowledge Mangement 11(4),
20-29.
Reid, S., 2014. Knowledge influencers: leaders
influencing knowledge creation and mobilization.
Journal of Educational Administration 52, 332-357.
Renzl, B., 2008. Trust in management and knowledge
sharing: The mediating effects of fear and knowledge
documentation. Omega 36, 206-220.
Roper, S., Du, J., Love, J.H., 2008. Modelling the
innovation value chain. Research Policy 37, 961-977.
Rosenberg, N., 1990. Why do firms do basic research
(with their own money)?. Research Policy 19(2), 165-
174.
Sakaiya, T., 1991. The knowledge value revolution or a
History of the future, Kodansha International. Tokyo,
Japan.
UNDP United Nations Development Programme, 2014.
Sustaining human progress: Reducing vulnerabilities
and building resilience.
UNDP United Nations Development Programme, 2015.
http://hdr.undp.org/en/countries/profiles/CHN
(accesed 9 may 2015).
World Bank, 2015. http://www.worldbank.org/ (accesed
14 may 2015).
Zyngier, S., Venkitachalam, K., 2011. Knowledge
management governance-A strategic driver.
Knowledge Management Research & Practice 9, 136-
150.
APPENDIX
(1) Knowledge sharing variables:
KM_IN1: This establishment spend on research and
development activities within the establishment in the last three
years.
KM_IN2: This establishment spend on research and
development activities contracted with other companies.
KNOW_SHA1: Years of experience working in the sector
the top manager has.
KNOW_SHA2: This establishment use e-mail to
communicate with clients or suppliers.
KNOW_SHA3: This establishment use its own website.
KNOW_SHA4: In this establishment Internet´s connection is
used to do research and develop ideas on new products and
services.
KNOW_SHA5: This establishment currently use cell phones
for the operations.
KNOW_SHA6: This establishment use phone and fax for
inter-organizational relationships and transactions.
KNOW_SHA7: This establishment use e-mail for inter-
organizational relationships and transactions.
KNOW_SHA8: This establishment use online web-based
systems for inter-organizational relationships and transactions.
KNOW_SHA9: This establishment use specific software for
inter-organizational relationships and transactions.
KNOW_SHA10: This establishment introduced new
products or services using internal R&D.
KNOW_SHA11: This establishment introduced new
products or services using external sources.
KNOW_SHA12: This establishment introduced new process
using internal R&D.
KNOW_SHA13: This establishment introduced new process
using external sources.
KNOW_SHA14: This establishment introduced new
products or services adapted in house.
KNOW_SHA15: This establishment introduced new
products or services cooperating with suppliers.
KNOW_SHA16: This establishment introduced new
products or services cooperating with client firms.
KNOW_SHA17: This establishment introduced new
products or services already supplied by another firm.
KNOW_SHA18: This establishment introduced new process
adapted in house.
KNOW_SHA19: This establishment introduced new process
cooperating with suppliers.
KNOW_SHA20: This establishment introduced new process
cooperating with client firms.
KNOW_SHA21: This establishment introduced new process
already supplied by another firm.
KNOW_SHA22: This establishment spend on research and
development activities within the establishment in the last three
years.
KNOW_SHA23: This establishment spend on research and
development activities contracted with other companies.
KNOW_SHA24: Percentage of full-time permanent workers
who completed secondary school.
KNOW_SHA25: Percentage of production full-time
permanent employees trained.
KNOW_SHA26: Percentage of non production full-time
permanent employees trained.
(2) Knowledge Creation Variables:
KM_CREA1: This establishment has introduced new
products or services in the last three years.
KM_CREA2: Percentage of these establishment´s total
annual sales was accounted for by products or services that were
introduced in the last three years.
KM_CREA3: Enterprises committed to introduce new
technology and equipments for product or process improvements.
KM_CREA4: Enterprises committed to introduce new
quality control procedure in production or operations.
KM_CREA5: Enterprises committed to introduce new
managerial processes.
KM_CREA6: Enterprises committed to provide technology
training for staff.
KM_CREA7: Enterprises committed to introduce new
product or new service.
KM_CREA8: Enterprises committed to add new features to
existing products or services.
KM_CREA9: Enterprises committed to take measures to
reduce production cost.
KM_CREA10: Enterprises committed to take actions to
improve production flexibility.
KMIS 2015 - 7th International Conference on Knowledge Management and Information Sharing
118
