
A Multi-Objective Simulator for Optimal Power Dimensioning on
Electric Railways using Cloud Computing
Alberto Garc
´
ıa Fern
´
andez, Silvina Ca
´
ıno Lores, F
´
elix Garc
´
ıa-Carballeira and Jes
´
us Carretero
Computer Science and Engineering Department, University Carlos III of Madrid,
Avda. Universidad 30, 28911 Leganes, Madrid, Spain
Keywords:
Railway Simulator, Power Dimensioning, Ontology, Multi-Objective Optimisation, Cloud Computing.
Abstract:
Power dimensioning and energy saving have been traditionally two main issues regarding the deployment of
electric grids. Electric railways are also concerned about these issues, and simulators have been traditionally
used to test such infrastructure deployments. The main goal of this paper is to present the Railway electric
Power Consumption Simulator, a simulation model and tool for the railway energy provisioning problem. This
simulator aims to propose electric railway infrastructure deployments, optimizing the quality of the electric
flow supplied to train, as well as saving as much energy as possible. The paper describes the simulator
structure, as well as the ontology used to translate railway infrastructure elements into an electric circuit.
Because these two objectives are conflicting, a multi-objective optimization problem is formulated and solved.
Finally, a standard railway scenario is used to illustrate the capabilities of the tool, trying to find the best
electric substation placements in order to optimize such objectives. The evaluation shows how the tool can
handle hundreds of simulated scenarios using Cloud Computing techniques.
1 INTRODUCTION
Power dimensioning and energy saving have been tra-
ditionally two main issues regarding the deployment
of electrical grids. Since their conception in the In-
dustrial Age, power grids are designed and deployed
following a trade-off between supporting high quality
provisioning to the consumers, and saving as much
energy as possible. Railway electric lines, as a par-
ticular case of electric grids, are also concerned about
these issues, trying to supply a steady flow of energy
to the moving trains, but not exceeding the power re-
quired by them.
Within this context, simulators have been the main
tools to design and test railway electric lines. Prior to
its installation, a particular deployment can be tested
on a simulator, modelling the infrastructure and the
train traffic in order to check the behaviour of the
system. Simulators like the ones introduced in (Pilo
et al., 2000; Bobi et al., 2007) are able to analyse per
instant if the power supplied to the trains is enough of
not, if there are voltage drops or over-voltages, etc.
Nevertheless, as computer systems evolve, the
role of simulators must become much more from
merely imitators of the real-world, to expert systems
with the ability of taking decisions and complement
the user knowledge with metrics in order to achieve
the best solutions. In previous works (Garc
´
ıa et al.,
2014), we stated that modern simulators should be
capable of proposing and evaluating new designs, tak-
ing into account all possible issues that may affect, or
even determine, the final validity of a solution. This
search across the problem domain may be driven by
expert’s knowledge implemented within the simula-
tor, in the form of generation or evaluation rules that
may reduce the number of simulations performed, or
give those solutions a score indicating their fitness ac-
cording to specific criteria.
The research community has been aware of this
need for optimal planning of power distribution sys-
tems as a whole (Pilo et al., 2015). In particular,
many of the relevant works in the field are focused
on providing a near-optimal solution in a computa-
tionally efficient manner. To achieve this, different
artificial intelligence (AI) techniques have served as
a base for the implementation of the aforementioned
decision making process, such as particle swarms
(del Valle et al., 2008), genetic algorithms (Ramirez-
Rosado and Bernal-Agustin, 1998; Carrano et al.,
2005), ant colonies (Gomez et al., 2004), simulated
annealing (Parada et al., 2004), artificial neural net-
works (Abrahamsson and Soder, 2009), multi-agent
428
Carretero J., Caino S., Garcia-Carballeira F. and Garcia A..
A Multi-Objective Simulator for Optimal Power Dimensioning on Electric Railways using Cloud Computing.
DOI: 10.5220/0005573404280438
In Proceedings of the 5th International Conference on Simulation and Modeling Methodologies, Technologies and Applications (SIMULTECH-2015),
pages 428-438
ISBN: 978-989-758-120-5
Copyright
c
2015 SCITEPRESS (Science and Technology Publications, Lda.)

systems (Nguyen et al., 2011), and evolutionary al-
gorithms (Strbac and Djapic, 1995). These method-
ologies provide a holistic approach in which the sim-
ulator proposes consistent, well-suited solutions to a
particular problem.
Additionally, it may occur that the optimisation
process depends on different conflicting criteria, lead-
ing to a Multi-objective Optimization (MOO) prob-
lem. Works like (Augugliaro et al., 2004; Mendoza
et al., 2006; Carrano et al., 2006; Ramirez-Rosado
and Dominguez-Navarro, 2004; Soler et al., 2015) ap-
proach the system’s design from a MOO perspective,
which allows the user to define several optimisation
metrics such as minimization of power losses, over-
all deployment cost, system failure index, or maxi-
mization of energy savings, etc. This approach has
been also translated to the field of railway power
supply systems, especially along with the previously
cited evolutionary techniques. In (Chang et al., 1995;
Chang et al., 1998), a trade-off between failure recov-
ery and load sharing is exposed and tackled as a MOO
problem.
Nowadays, many scientific areas make use of
the Cloud to overcome scalability issues in simula-
tions, and increase their performance. In particu-
lar, computing frameworks like MapReduce (Dean
and Ghemawat, 2008) have been increasingly used
as building-blocks for distributed large scale simula-
tors in a wide range of areas (Radenski, 2013; De-
craene et al., 2011; Kim et al., 2014). Railway simu-
lators have been also affected by this trend, integrat-
ing MapReduce and Cloud environments to existing
techniques with promising results in large datasets
and scenarios (Liu et al., 2010). Finally, works like
(Deelman et al., 2008) and (Angeli and Masala, 2012)
demonstrate the economic feasibility of migrating sci-
entific or engineering simulations to the Cloud, even
though making use of Cloud resources entails paying
for such resources to the Cloud services provider.
The main goal of this paper is to present a sim-
ulation model and tool for the railway energy pro-
visioning problem. This simulator aims to propose
electric railway infrastructure deployments, optimiz-
ing the quality of the electric flow supplied to train, as
well as saving as much energy as possible. Because
these two objectives are conflicting, a MOO problem
will be formulated and solved. In order to handle the
high number of simulations performed, the simulator
is suited for Cloud Computing. The evaluation will
show how the tool can handle hundreds of simulated
scenarios using Cloud Computing techniques.
From the related works researched by the authors,
only (Abrahamsson and Soder, 2009), (Nguyen et al.,
2011), (Pilo et al., 2015), and (Soler et al., 2015) stay
close to the present work, in terms of usefulness and
capabilities. (Abrahamsson and Soder, 2009) pro-
poses a fast approximator based on neural networks
in order to plan power supply investments. On the
contrary, our approach is independent from underly-
ing AI techniques, so different search strategies can
be implemented just performing a few modifications.
In (Nguyen et al., 2011), an agent-based smart power
router is implemented, which can flexibly integrate
network areas and optimally manage power flows.
Nevertheless, this approach is outside the railway do-
main, so it does not take into account the particu-
lar railway domain characteristics. (Pilo et al., 2015)
and (Soler et al., 2015) propose both an optimization
problem of the AC railway power system, with mod-
els well-developed and consistent, but such models do
not consider as many details regarding the infrastruc-
ture as our model does. Finally, neither of these pro-
posals are based on Cloud Computing, nor they can
make use of elastic computing infrastructures accord-
ing to simulation sizes and deadlines.
The paper is structured as follows: Section 2 in-
troduces the simulator developed, including its struc-
ture and the ontology used to represent the railway
domain; Section 3 exposes the MOO problem, defin-
ing the search problem, optimization metrics, and ob-
jectives; Section 4 describes the evaluation conducted
and the results obtained; and finally Section 5 pro-
vides key ideas as conclusions and some insight in
future work.
2 RAILWAY POWER
CONSUMPTION SIMULATOR
The Railway electric Power Consumption Simulator
(RPCS) proposes solutions for the problem of design-
ing and deploying electric infrastructure on railway
lines, trying to optimize the trade-off between power
supplied and energy saving. In this section we will
describe in detail the simulated domain, the ontology
implemented by simulator that represents such do-
main, and the main structure of the application. In the
following section we will analyse in detail the MOO
problem derived from the trade-off between energy
supply quality and energy saving, and its implemen-
tation within the simulator.
In collaboration with ADIF
1
, the Spanish railway
company, we have developed during the last years
the RPCS with the aim of testing and verifying dif-
ferent scenarios: developing new routes, increasing
train traffic across the tracks, or testing failure situa-
1
http://www.adif.es
AMulti-ObjectiveSimulatorforOptimalPowerDimensioningonElectricRailwaysusingCloudComputing
429

tions where services have to be operated on degraded
mode. Currently the tool considers only direct current
(DC) systems, but its extension to AC systems is now
work in progress. The tool translates railway infras-
tructure elements such as tracks, feeders, electrical
substations and trains into an electric circuit, and then
solves that electric circuit. Along with the tool, we
have proposed the ontology that drives such transla-
tion of real infrastructure elements into elements of an
electric circuit: voltage sources, branches, and con-
sumers (current sources). We first describe the tool
and its modules, and then we detail the ontology.
2.1 Application Description
The aim of this simulator is, provided a number of
trains circulating across the lines, to calculate if the
amount of power supplied by the electrical substa-
tions is sufficient to allow that trains to render without
delays, failures, or any other contingency. Starting
from a description of the railway infrastructure (i.e.
tracks, catenaries deployed over the tracks, electric
substations placed along the tracks, as well as addi-
tional elements like feeders and switches), the simu-
lator reads the position of the trains and their instan-
taneous power demand. Then, for each instant of the
simulated period, the electric circuit formed by the
trains and the infrastructure is composed and solved
using Modified Nodal Analysis (MNA). More details
about MNA can be found on (Jahn et al., ). Useful
mean voltages, voltage drops, and temperatures of the
wires are examples of results provided by the tool.
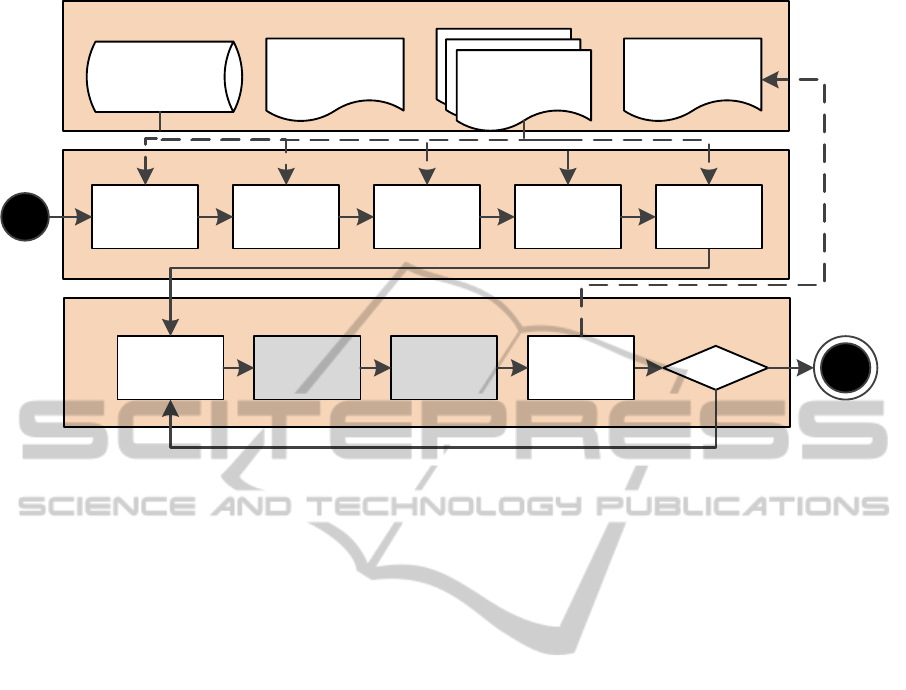
The structure of the application is shown in Fig. 1.
It is a modular application with consists of a prepara-
tion phase in which all the required input data is read
and fragmented to be executed in a predefined number
of threads. Two classes of input files are handled:
• A shared infrastructure specification file contain-
ing the initial and final time of the simulation, be-
sides a wide range of domain-specific simulation
parameters such as station and railway specifica-
tions and power supply definition.
• A set of train movement data files, structured in
a time-based manner, in which each line contains
the calculation of speed and distance profiles for
a particular train at a specific instant regarding the
infrastructure constraints, and most important, the
instantaneous power demand, with a one second
interval.
Once all data have been read, the ontology mod-
ule translates the infrastructure and train positions
on the current instant into an electric circuit, and
solves that circuit. Tracks, feeders, and catenaries are
branches of the electric circuit, whereas trains act as
consumers, and the converter-rectifier groups are the
voltage sources. The complete transformation pro-
cedure will be described along with the ontology in
Section 2.2. Finally, the simulator executes the algo-
rithm module for each instant to be simulated. With
this module, electric results are calculated on every
instant, using the MNA technique and an iterative pro-
cess. These results will be merged in the main thread
to constitute the final output files. The MNA general
formulation is:
A
1
Y
1
A
T
1
A
2
M
2
A
T
2
N
2
·
u
n
i
r
2
=
−As · is
ws2
(1)
In this problem, branches are considered resistors,
and there are only independent voltage sources, so the
previous equation can be simplified as:
G B
C 0
·
u
n
i
r
=
i
e
(2)
where G, B, and C are matrices of known val-
ues obtained from the circuit elements (connections,
conductances, etc.), u
n
and i
r
are the unknown volt-
ages and and currents, and finally i and e contain the
sum of the currents through the passive elements, and
the values of the independent voltage sources respec-
tively. Note that, due to the fact that the trains are in
movement, the system is constantly changing, so ev-
ery instant the electric circuit must be composed and
calculated, varying the position of the consumers. As
consequence, the MNA must be performed on every
simulated instant, thus requiring a significant amount
of computing power to perform the whole simulation.
Simulated times may vary, from one hour, to one day,
to one week, implying from 3 600 circuits simulated
on short scenarios, to 86 400 on average scenarios, to
604800 on very large scenarios.
The simulator outputs electric data indicative
of the state of the circuit and all its components.
They include, for each simulated instant, voltages
and currents in all trains, voltages and currents in
the converter-rectifier groups, and currents in all
branches. Additional data is post-processed calculat-
ing useful mean voltages on trains and zones of the
circuit. With all these data, several conclusions can
be drawn from the simulation:
• If the power supplied to the trains is enough of
not. Particularly:
– If the power stations are powerful enough.
– If the power stations are placed properly along
the tracks.
– If the train traffic is excessive, given a particular
configuration of the power stations.
SIMULTECH2015-5thInternationalConferenceonSimulationandModelingMethodologies,Technologiesand
Applications
430
ALGORITHMMODULE
t
i
>t
end
ALLOCATE
CONSUMERS
SOLVE
CIRCUIT
ITERATIVE
PROCESS
WRITE
RESULTS(t
i
)
t
i
=t
ini
YES
NO
t
i
++
ONTOLOGYMODULE
DATAMODULE
SCENARIOS
DB
TRAIN
MOVIMENTS
SIMULATION
PARAM.
SIMULATION
RESULTS
TR ANSLATE
TR ACKS
TR ANSLATE
CATENARIES
TR ANSLATE
FEEDERS
TRANSLATE
ELECTR ICAL
SUBSTATIO NS
TRANSLATE
TRAINS
Figure 1: Application structure and its modules.
• If the current through catenaries and feeders are
excessive, overheating the wires. Particularly:
– If there is a design fault in the circuit that pro-
vokes too much current through a wire.
– If the wires deployed are too thin.
Figure 2 illustrates an example of the graphs out-
putted by the simulator. Fig. 2(a) displays possi-
ble voltage drops by plotting the minimum voltage
achieved at each point of the track. Fig. 2(b) rep-
resents the nominal and root mean square power of
a converter-rectifier group along the simulated day.
Fig. 2(c) plots the current that circulates through a
feeder along the simulated day, as well as its root
mean square and the maximum current that this feeder
can accept before overheating. Finally, Fig. 2(d) dis-
plays a diagram of the positions of all trains circulat-
ing over a track during the day.
2.2 Ontology
Along with the tool, an ontology of the railway elec-
tric infrastructure domain has been developed. The
main objective of this ontology is to propose a taxon-
omy for translating real infrastructure elements into
an electric circuit. This electric circuit should reflect
the real behaviour of the system (i.e. trains, tracks,
electrical substations) as accurate as possible. There
are several reasons for developing an ontology. The
RPCS is a complete suite which includes not only the
simulation algorithm, but also:
• Project Management: the user can handle differ-
ent projects associated to geographical zones.
• Inventory Management: the user can handle an in-
ventory with materials or common pieces used by
the railway company. Besides, new materials or
pieces with different properties can also be added
by the user.
• CAD Tools. The RPCS includes several
computer-aided design (CAD) tools to display the
project, drawn electric or geographical schemas,
etc.
All these features are easier to develop if there is a
common ontology that homogenizes the problem do-
main. Besides, as multiple railway-related tools are in
development by the authors (Garc
´
ıa et al., 2014), an
ontology may ease the interaction between these tools
when importing or exporting elements from one to the
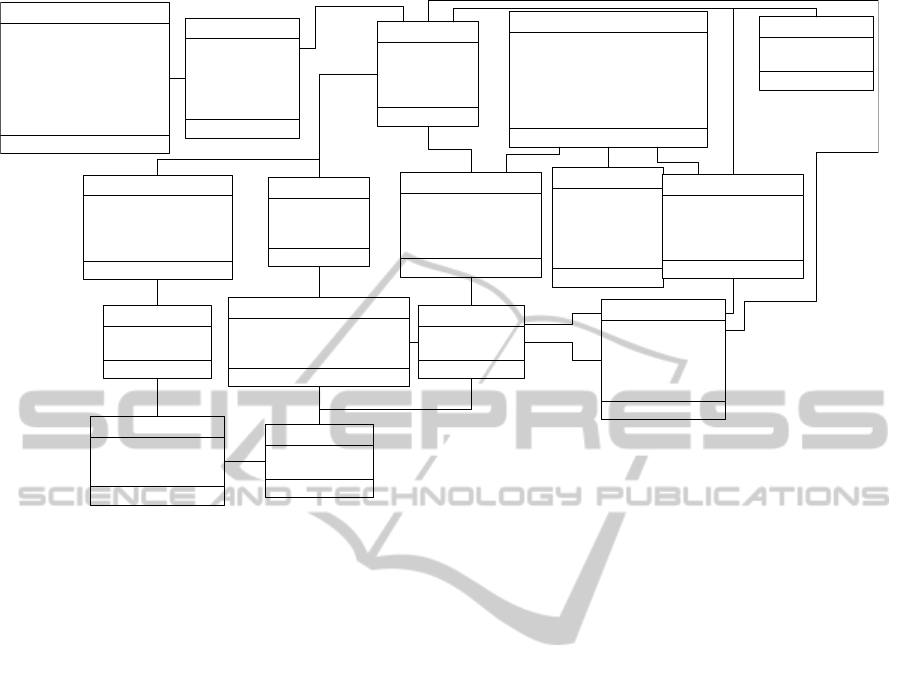
other. The entities and their relationships are repre-
sented in Fig. 3 through a semiformal UML model.
We proceed to describe such entities:
• Material. This entity represents a particular con-
ductive material with specific electric properties
such as resistivity or temperature coefficient. Ma-
terials compose the rails and wires of the system,
thus influencing the electric behaviour of such
system.
• RailType and WireType. These entities represent
a particular typology of rail or wire, defined by
the material that composes the rail or wire, and its
section. Material and section determine the resis-
tance per kilometre of that type of rail or wires.
Examples of those types are: copper 153 mm
2
wire, or UIC-54 6934 mm
2
steel rail.
AMulti-ObjectiveSimulatorforOptimalPowerDimensioningonElectricRailwaysusingCloudComputing
431
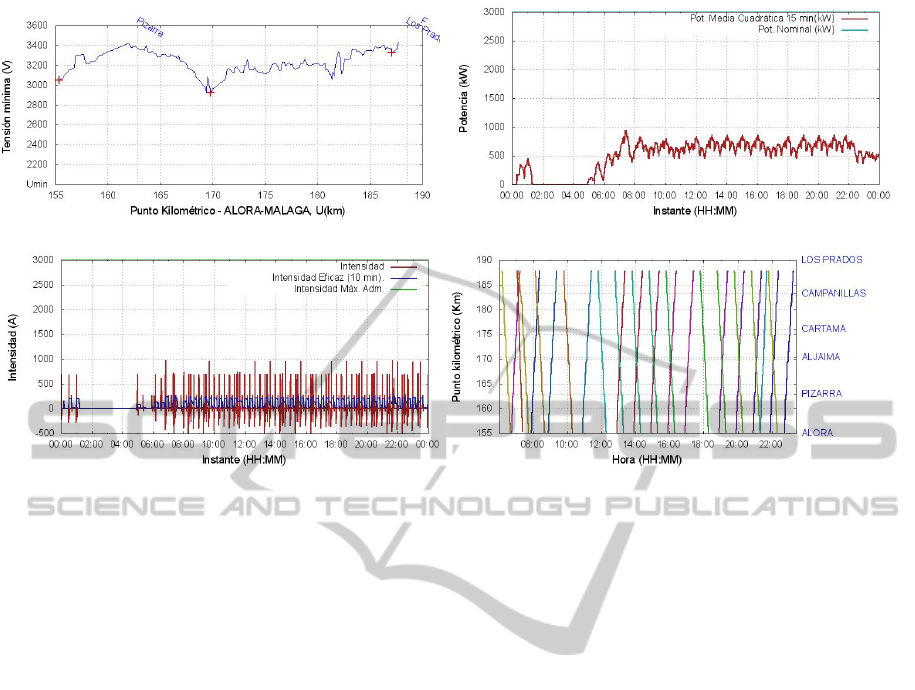
(a) Voltage drops (b) Average electrical power
(c) Current through feeders (d) Train traffic along the tracks
Figure 2: Different graphs outputted by RPCS.
• FeederType. This typology represents a group of
wires. Feeders are usually deployed using several
wires in order to avoid overheating. This entity
represent a particular configuration of wires (e.g.
3 x Cu153, which represents a feeder configured
with three cables of copper, 153 mm of section
each one).
• CatenaryType. A typology for catenaries, which
consist of supporting wire, contact wire, and op-
tionally, a compliment feeder in order to increase
the aggregated section of the catenary, avoiding
excessive overheating of the supporting and con-
tact wire because of the current.
• RailStretch and CatenaryStretch. These entities
represent a section of the track, from a starting
milemarker to a final milermarker, in which a par-
ticular typology of rails or catenary has been de-
ployed. For instance, on a track, from the mile-
marker 20km to the milemarker 25km, the cate-
nary is composed of a supporting wire of Cu 153
mm
2
, a contact wire of Cu 150 mm
2
, with no
compliment feeder, whereas in other stretch of the
track, a different typology of rails or catenary may
be deployed.
• Substation, Group, PositiveFeeder, and Negative-
Feeder. These entities represent an electrical sub-
station and its equipment: a main building that
contains one or several converter-rectifier groups
(see entity Group). These groups transform the
power from the main grid into direct current, suit-
able for feeding the system, thus constituting the
voltage sources of the electric circuit. These
sources are connected to the catenaries at some
milemarker through positive feeders (see Positive-
Feeder entity). Finally, in order to close the cir-
cuit, the substation also contains the ground ref-
erence, and the circuit is closed through negative
feeders connected to the rails at some point of the
track (see NegativeFeeder entity).
• Train and TrainPosition. These entities represent
a particular train with its electric characteristics,
and the collection of time/position/power records
that constitute its run along the tracks. Trains de-
mand such registered power at the particular time
and point indicated by such registers.
• Track. This is the main entity that represents a rail
track: two rails (in a common case), and an over-
head catenary. The kind of catenary or rails can
change along the length of the track, as stated be-
fore. Trains run across the track, stopping eventu-
ally on stations or yards at some milemarker. Oth-
erwise connected explicitly by the user, tracks are
considered electrically independent ones from the
others.
• CatenariesConnection and CatenarySwitch.
These entities represent particular connections
and switches which allow the user to customize
the electric circuit, connecting electrically two
tracks, or separating electrically to ends of a
track.
SIMULTECH2015-5thInternationalConferenceonSimulationandModelingMethodologies,Technologiesand
Applications
432
Material
-electricalResistivity
-specificConductance
-temperatureCoefficient
RailType
-section
-material : Material
WireType
-section
-material : Material
Track
-ID
-name
-initialMileMarker
-finalMileMarker
FeederType
-wires[] : WireType
-isolatedYesNo
CatenaryType
-contactWire : WireType
-catenaryWire : WireType
-complimentFeeder : FeederType
RailStretch
-initialMileMarker
-finalMileMarker
-railType : RailType
-railToGroundConductance
CatenaryStretch
-initialMileMarker
-finalMileMarker
-catenaryType
Substation
-ID
-name
-positiveFeeders[] : PositiveFeeder
-negativeFeeders[] : NegativeFeeder
-groups[] : Group
-connectionMatrix
Group
-ID
-name
-openCircuitVoltage
-power
-internalImpedance
PositiveFeeder
-ID
-track : Track
-connectionMileMarker
-feederType : FeederType
NegativeFeeder
-ID
-track : Track
-connectionMileMarker
-feederType : FeederType
Train
-ID
-name
-timeTable
-auxPower
-totPower
-maxVoltage
-trainPositions[] : TrainPosition
TrainPosition
-train : Train
-instant
-track : Track
-positionMileMarker
-powerDemand
CatenarySwitch
-track : Track
-positionMileMarker
CatenariesConnection
-track1 : Track
-positionMileMarker
-track2 : Track
-positionMileMarker2
-feeder : FeederType
1
N
1 N
composed
of
composed
of
configured
by
1
N
N
can
include
0-1 0-1
1
N
configured
by
1
N
configured
by
1
N
configured
by
1 1
1
N
N
N
houses
positioned at
positioned
at
positioned
at
positioned
at
1 N
1
N
2 1
N
N
1
N
deployed
at
1
N
N
1
1
configured
by
N
N
configured
by
Figure 3: Semiformal modeling of the RPCS ontology using UML.
The main algorithm that composes the electric cir-
cuit proceeds as follows: starting from a set of electri-
cally independent tracks, voltage sources (Group) and
ground connections are connected to the track from
the electric substation at some points indicated by the
feeders (PositiveFeeder or NegativeFeeder). Trains
run across the track demanding power at the time and
point marked by their TrainPosition instances, thus
acting as consumers in a circuit. Catenaries constitute
the load branches of the circuit, whereas rails con-
stitute the return branches of the circuit. The differ-
ent typologies of catenaries and rails along the track
are represented through stretchs (see CatenaryStretch
and RailStretch). These stretchs will be translated to
branches of some resistance depending on their con-
figuration, through wire and rail electric properties.
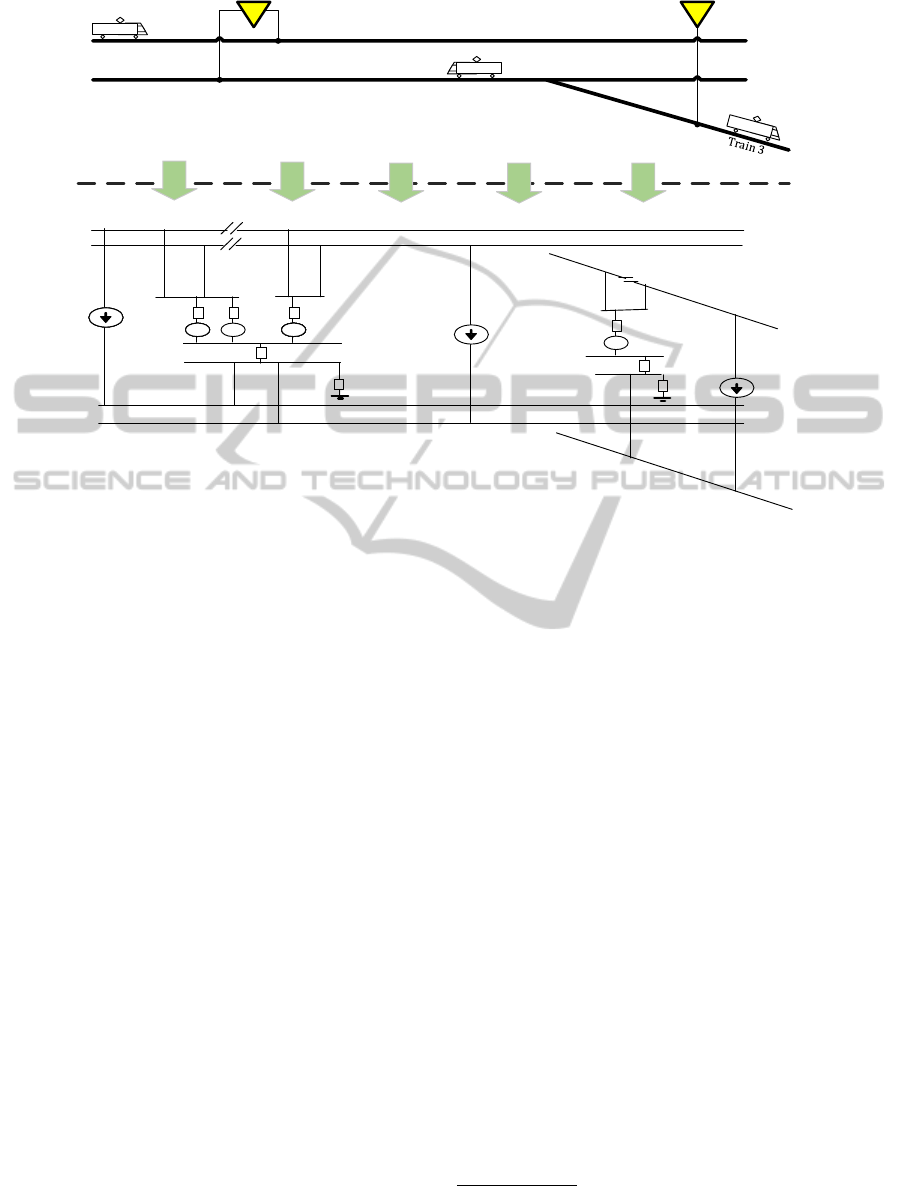
Figure 4 represents how a particular infrastruc-
ture is translated into an electric circuit. In the fig-
ure, three tracks, two electrical substations, and three
trains are translated into an electric circuit, where the
branches are numbered. Each electric substations is
translated into a set of branches and voltage sources
(see branches 0 to 4 and 9 to 11). The positive feeders
are translated into branches from the substation to the
catenaries (5 to 8 and 12 to 13), whereas the negative
ones connect the tracks to the substation (22, 23, and
24). Each catenary and track is considered a single
branch (16, 17, 20, 25, 26, and 27), but the user can
introduce switches in the circuit in order to divide the
same track in several independent branches (18, 19,
and 21). Finally, each train is represented as a branch
and current source, that connects the catenary (load
branch) to the track (return branch).
3 MOO APPROACH TO ENERGY
SAVING ON RAILWAY LINES
In the previous section we have described the RPCS
application, detailing how it can be used in order to
simulate a scenario with several tracks, trains, elec-
tric substations, etc. Nevertheless, as we stated be-
fore, modern simulators should be capable of propos-
ing and evaluating new designs taking into account
possible issues that may affect the final validity of a
solution. In order to do so, we have implemented an
enhancement to the RPCS basic structure, turning to-
wards a MOO problem.
In this MOO problem, not one, but many simu-
lations will be executed. Each one of these simula-
tions constitutes a variation of the input data –either
the infrastructure or the trains–, and the results are
evaluated according to a set of optimisation metrics in
order to find the optimum initial configuration, with
regard to a specific optimisation criteria. The way
we vary the input data defines the problem’s search
space, which constitutes the set of solutions obtained
from the simulations, and the optimisation metrics
and functions define the goal we pursue in our search.
AMulti-ObjectiveSimulatorforOptimalPowerDimensioningonElectricRailwaysusingCloudComputing
433
Track1
Track2
Electrical
Substation1
Electrical
Substation2
Train1
Train2
0
1
9
3
4
11
5
6
16
18
17
7
8
19
12
20
21
22
13
26
23
25
24
27
10
Track3
2
14
15
Figure 4: Railway infrastructure and its translation into an electric circuit.
In this particular case, we focus on the trade-off
between energy saving and quality of energy provi-
sioning. The quality of the power supply refers to the
concept of maintaining the system as near to the nom-
inal voltage, U
nom
= 3000V , as possible. As trains cir-
culate along the tracks demanding power, voltage os-
cillations may arise all across the electric circuit, lead-
ing to voltage drops or over-voltages. Note that trains
do not always consume the same amount of power,
and even more, they can return power to the circuit
due to regenerative braking technologies. These situ-
ations should be avoided, maintaining a constant flow
of electric power to the trains. While voltage drops
can be avoided by adding more electric substations
on the tracks, this may lead to over-voltages due to
excessive power. Besides, the more substations to be
placed, the more expensive the deployment is, and the
more aggregated energy is consumed by the electric
substations. This leads to conflicting objectives, thus
to a MOO problem: the goal of maintaining a con-
stant power flow, in favour of providing more energy,
against the target benefit of saving energy.
The problem search space to be studied will be
the placement of the electrical substations along the
tracks –i.e. the connection milemarker of the substa-
tion to the track–. By modifying the substations’ loca-
tions, we vary the electric circuit, thus we obtain dif-
ferent measures of instantaneous and mean voltages,
as well as consumed potency. Therefore, substation
placement has a direct impact on the power supply
quality and energy savings.
We aim to find the corresponding Pareto fron-
tier of the MOO problem, thus giving the user the
set of optimal solutions and letting him or her chose
the preferred option. We propose a set of restric-
tion rules that must be fulfilled by the design in or-
der to be considered as acceptable, and set of optimi-
sation metrics in order to score those accepted solu-
tions. Both sets are obtained analysing the European
regulations (AENOR, 2004), (CENELEC, 2012), and
(CENELEC, 2015)
2
. A formalisation of the resulting
MOO problem is described next.
3.1 Problem Formalisation
As previously described, there are two objectives that
guide the optimisation process:
• Improve the quality of the power supply.
• Reduce the amount of power consumed by the
groups.
We define from these goals the following criteria:
• Maximise the mean useful voltage per train, O
1
.
• Minimise total amount of energy consumed by the
groups, O
2
.
2
This normative is still under vote by the CENELEC
committee until 15th of July, 2015
SIMULTECH2015-5thInternationalConferenceonSimulationandModelingMethodologies,Technologiesand
Applications
434

The mean useful voltage, described in European
normative UNE-EN-50388 (CENELEC, 2012), is de-
fined as the mean of all voltages at the pantograph of
each train in the geographic zone, along all simulation
steps. This measure indicates the quality of the power
supply. The lower the mean useful voltage is, the less
energy is transferred from the supply stations to the
trains, on average.
For the formalisation of this problem, let T be the
set of trains in the whole system, and G be the set of
groups in the network. The first objective is defined
in Eq. 3, where U
t
mu
is the mean useful voltage per
train, and U
max
1
constitutes the maximum permanent
voltage.
max O
1
=
U
t
mu
− 2800
U
max
1
− 2800
∀t ∈ T (3)
The second objective is formulated in Eq. 4,
where E
i
g
is the energy consumed per group, in kW/h.
min O
2
=
G
∑
i=1
E
i
g
i 6= g,∀g ∈ G (4)
The problem is subject to the following con-
straints:
• According to the normative (CENELEC, 2012),
the mean useful voltage per train, U
t
mu
, must never
be lower than 2800V , and it shall not surpass the
maximum permanent voltage, U
max
1
.
2800 ≤ U
t
mu
≤ U
max
1
(5)
• No sharp voltage drops or over-voltages shall ex-
ist on normal (non failure) operating conditions
(AENOR, 2004). Therefore, instantaneous volt-
ages should be in the range of non-permanent con-
ditions on every instant of the simulation. This
derives Eq. 6a and Eq. 6b.
U
min
1
≤ U
t
≤ U
max
2
∀t ∈ T (6a)
U
min
1
≤ U
g
≤ U
max
2
∀g ∈ G (6b)
• The mean voltages on trains and the simulated
zone, shall be within the limits of permanent op-
erating conditions, even if voltages fall beyond
that limits for a moment during the simulation
(AENOR, 2004; CENELEC, 2012). This yields
Eq. 7a and Eq. 7b.
U
min
1
≤ U
t
mu
≤ U
max
1
∀t ∈ T (7a)
U
min
1
≤ U
muz
≤ U
max
1
(7b)
4 EVALUATION
We selected as benchmark a standard railway scenario
described in the proposed draft of the European nor-
mative prEN-50641 (CENELEC, 2015). This pro-
posal of normative establishes the requirements for
the validation of simulation tools used for the design
of traction power supply systems. Therefore, it is
meaningful to apply such normative to conduct the
optimisations. Key parameters of this test case are
indicated in Tab. 1, and a general overview of the el-
ements of the experiment are shown in Fig. 5.
The search space was generated by conducting the
simulation with a different positioning of several sub-
stations. For each substation E
k
, the initial and final
points of the interval in which they can be placed must
be defined –E
k
ini
and E
k
f in
, respectively–, along with
the distance between each planned position for the
generation of the experiment set, ∆
k
.
As each substation can be assigned to any of the
points within the former interval, and all of the substa-
tions have to be combined with the others to generate
the experiment set, we would get as many different
experiments as indicated by Eq. 8, where M is the
number of substations to be manipulated. The equa-
tion indicates that, the finer the grain of the planned
experiments, the more simulations have to be exe-
cuted in order to generate the solution space.
N =
M
∏
k=1
E
k
f in
− E
k
ini
∆
k
(8)
For this evaluation, we generated a set of 4 000 so-
lutions using the variations of the positions indicated
in Tab. 2, displacing each substation from one kilo-
metre to the next, without overlapping their ranges.
From this set, we sampled for this evaluation only
1000 random experiments, aiming to increase this
number for future works.
Since each experiment is composed of 4 800 sim-
ulation steps –one per simulated instant, correspond-
ing to 1h and 20m of simulated time–, it would be
required to solve 4 800 equation systems per experi-
ment. Considering that the number of experiments to
be simulated grows exponentially, as indicated by Eq.
8, the overall computing resources required to gen-
erate the solution space of the MOO would outscale
those typically available in current desktop comput-
ers.
To palliate this issue, we developed a version of
the power simulator suitable for the Cloud, which was
based on MapReduce. The complete process of adapt-
ing and implementing the Cloud version is described
in (Ca
´
ıno-Lores et al., 2015), as well as all the evalu-
ation performed in order to assure scalability when
AMulti-ObjectiveSimulatorforOptimalPowerDimensioningonElectricRailwaysusingCloudComputing
435
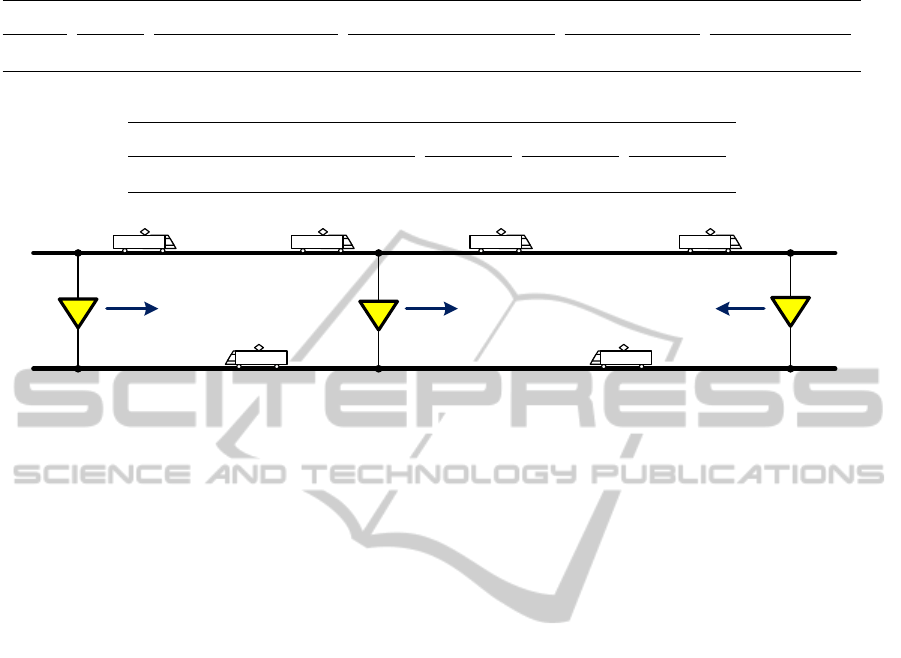
Table 1: CENELEC test case definition.
Trains Tracks Electrical substations Circuit branches (mean) Simulated time Input size (MB)
6 2 3 150 1 h 20 min. 4.2
Table 2: Variations of electrical substations placement on MOO optimization.
Electrical substation E1 E2 E3
Milemarkers(km) (initial, final, ∆) (0, 20, 1) (20, 40, 1) (40, 50, 1)
Track1
Track 2
Elec trical
Substation1
Elec trical
Substation2
Electrical
Substation3
Train1 Train2 Train3 Train4
Train 5 Train 6
Figure 5: Schema of the main railway elements in the CENELEC test case. Parallel connections between catenaries or tracks
are not shown.
tackling with a high number of experiments. This
platform allowed us to disseminate the experiments
across a large cluster, resulting in an efficient and scal-
able deployment that accelerated the overall solution
space generation process. Besides, Cloud Computing
paradigm brings us several features that can be useful
in the context of MOO:
• Virtual unlimited scalability of hardware re-
sources. The user is not tight on its local infras-
tructure, and more computing power may be allo-
cate on-demand.
• Flexibility according to instantaneous user needs
(through adapting computing resources). The user
may allocate more or less computing power de-
pending on the size of the simulation, and the
deadline for obtaining the results.
The selected cloud infrastructure consisted of a
general purpose m2.4xlarge node as dedicated master
and one hundred m2.xlarge machines as slaves. Table
?? shows the main aspects of the selected instances.
The results we obtained were parsed and evaluated ac-
cording to the metrics defined in Sec. 3. The Pareto-
optimal frontier for the former data is shown in Fig.
6, along with the other solutions that resulted from the
subsequent simulations. The solutions that belong to
the Pareto-optimal frontier highlighted in Fig. 6 are
the ones that meet the optimisation criteria developed
in Sec. 3, yet the preferred solution still has to be cho-
sen by the end user. The final selection could balance
the supply quality (O
1
) and the wasted energy (O
2
),
or be directed towards emphasising one of the optimi-
sation objectives. Table ?? gives the substation con-
figuration for the limit solutions in the Pareto-optimal
frontier, the positions are indicated with respect to the
beginning of the rail track.
5 CONCLUSIONS
In this paper, we have presented the RPCS, a simula-
tion model and tool, with the aim of proposing elec-
tric railway infrastructure deployments. The tool in-
tends to provide optimal solutions with regard to the
quality of the electric flow and the energy consumed.
Because these two objectives are conflicting, a MOO
problem is formulated and solved. In this MOO prob-
lem, not one, but many simulations will be executed.
Each one of these simulations constitutes a variation
of the electric substation placement, trying to find the
best positions according to the optimization objec-
tives.
In order to solve a single scenario, the tool trans-
lates railway infrastructure elements such as tracks,
catenaries, feeders, and electrical substations, as well
as the trains, which act as consumers, into an elec-
tric circuit. Then, for each simulated instant, the tool
solves the circuit using the MNA technique, obtain-
ing the resulting values of train voltages and currents.
Along with the tool, an ontology to translate railway
infrastructure elements into an electric circuit is pro-
posed, as well as the algorithm to perform such trans-
lation.
In order to illustrate the capabilities of the tool, we
perform an evaluation using a standard railway sce-
nario defined in an European normative. The aim is
to find the best electric substations’ placement in or-
SIMULTECH2015-5thInternationalConferenceonSimulationandModelingMethodologies,Technologiesand
Applications
436
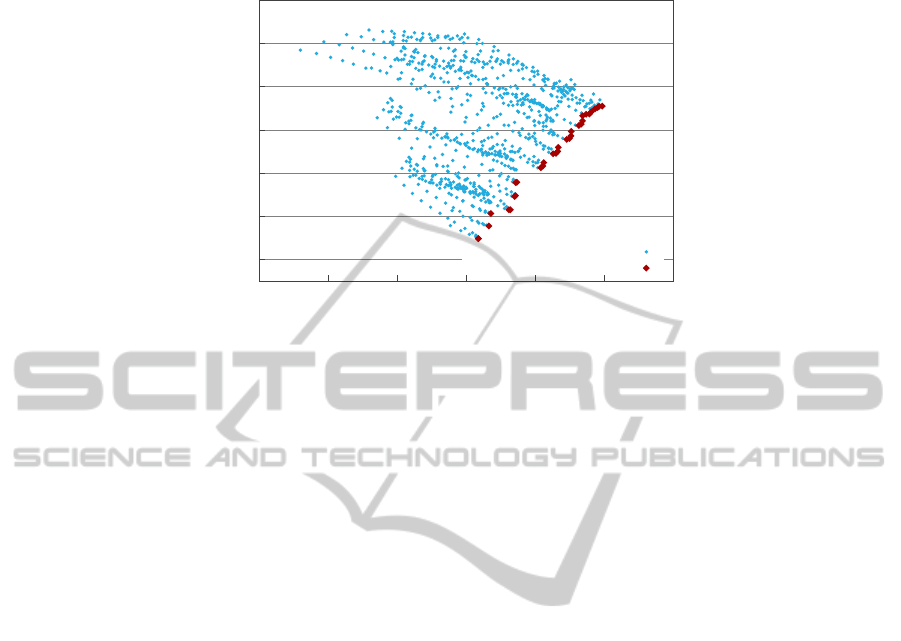
8200
8400
8600
8800
9000
9200
9400
0.1 0.2 0.3 0.4 0.5 0.6 0.7
O
2
(kW /h)
O
1
Solution space and Pareto-optimal frontier
Dominated solutions
Non-dominated solutions
Figure 6: Resulting solution space and Pareto-optimal frontier for the CENELEC experiment set.
der to maximize the two aforementioned objectives.
The number of explored solutions reaches one thou-
sand. Besides, for each simulation, the MNA tech-
nique must be performed on every simulated instant,
leading to 4 800 000 equation systems solved. In order
to tackle this amount of computing power required,
the application is built for Cloud Computing, using
instances allocated on demand to solve all of the sim-
ulations derived from the MOO problem.
As future work, we intend to enhance the MOO
problem focusing on different optimization objec-
tives. Currently, we only vary the electric substation
placement, but other infrastructure elements can be
modified in order to improve the overall system per-
formance: feeder typologies, electric substation con-
figurations, etc. Besides, a different MOO problem
can be proposed, focusing on fault-tolerance and sys-
tem resilience, as some other works do on general
electric grids, but particularizing the specific railway
domain characteristics. Furthermore, a different ap-
proach may be proposed, trying to optimize the train
traffic instead of the infrastructure. Thus, the number,
type or even train drivers signature can be explored in
order to improve system efficiency. A main guideline
is to transform the tool into a a complete integrated
IDE, so that the user could set its own search vari-
ables, optimization metrics and restrictions, propos-
ing her/his own MOO problems using the tool. Fi-
nally, through this Cloud implementation, we aim to
develop several heuristics, in order to propose sizes
of the Cloud infrastructure (virtual instances, proces-
sors, memory, etc.) according to each particular MOO
problem’s characteristics (problem domain, restric-
tions, solution space, etc.).
ACKNOWLEDGEMENTS
This work has been partially funded under the grant
TIN2013-41350-P of the Spanish Ministry of Eco-
nomics and Competitiveness, and the COST Action
IC1305 ”Network for Sustainable Ultrascale Comput-
ing Platforms” (NESUS).
REFERENCES
Abrahamsson, L. and Soder, L. (2009). Railway power
supply investment decisions considering the voltage
drops-assuming the future traffic to be known. In In-
telligent System Applications to Power Systems, 2009.
ISAP’09. 15th International Conference on, pages 1–
6. IEEE.
AENOR (2004). UNE-EN 50163: Railway Applications -
Supply voltages of traction systems. AENOR.
Angeli, D. and Masala, E. (2012). A cost-effective cloud
computing framework for accelerating multimedia
communication simulations. Journal of Parallel and
Distributed Computing, 72(10):1373 – 1385.
Augugliaro, A., Dusonchet, L., Favuzza, S., and Sansev-
erino, E. (2004). Voltage regulation and power losses
minimization in automated distribution networks by
an evolutionary multiobjective approach. Power Sys-
tems, IEEE Transactions on, 19(3):1516–1527.
Bobi, J. d. D. S., Marcos, F. J., and N
´
u
˜
nez, J. G. (2007).
A simulation tool for sizing electrical railway lines.
In ASME/IEEE 2007 Joint Rail Conference and In-
ternal Combustion Engine Division Spring Technical
Conference, pages 269–277. American Society of Me-
chanical Engineers.
Ca
´
ıno-Lores, S., Fernndez, A. G., Garca-Carballeira, F., and
Prez, J. C. (2015). A cloudification methodology for
multidimensional analysis: Implementation and appli-
AMulti-ObjectiveSimulatorforOptimalPowerDimensioningonElectricRailwaysusingCloudComputing
437

cation to a railway power simulator. Simulation Mod-
elling Practice and Theory, 55(0):46 – 62.
Carrano, E., Soares, L., Takahashi, R., Saldanha, R., and
Neto, O. (2006). Electric distribution network mul-
tiobjective design using a problem-specific genetic
algorithm. Power Delivery, IEEE Transactions on,
21(2):995–1005.
Carrano, E., Takahashi, R., Cardoso, E., Saldanha, R., and
Neto, O. (2005). Optimal substation location and en-
ergy distribution network design using a hybrid ga-
bfgs algorithm. Generation, Transmission and Distri-
bution, IEE Proceedings-, 152(6):919–926.
CENELEC (2012). UNE-EN 50388: Railway Applications
- Power supply and rolling stock - Technical crite-
ria for the coordination between power supply (sub-
station) and rolling stock to achieve interoperability.
AENOR.
CENELEC (2015). prEN 50641 (draft): Railway Applica-
tions - - Fixed installations - Requirements for the val-
idation of simulation tools used for the design of trac-
tion power supply systems. CENELEC: Europeean
Committee for Electrotechnical Standardization.
Chang, C., Wang, W., Liew, A., and Wen, F. (1998). Bi-
criterion optimisation for traction substations in mass
rapid transit systems using genetic algorithm. Electric
Power Applications, IEE Proceedings -, 145(1):49–
56.
Chang, C., Wang, W., Liew, A., Wen, F., and Srinivasan, D.
(1995). Genetic algorithm based bicriterion optimisa-
tion for traction substations in dc railway system. In
Evolutionary Computation, 1995., IEEE International
Conference on, volume 1, pages 11–.
Dean, J. and Ghemawat, S. (2008). Mapreduce: simplified
data processing on large clusters. Communications of
the ACM, 51(1):107–113.
Decraene, J., Zeng, F., Low, M. Y. H., Cai, W., Cheng, Y. Y.,
and Choo, C. S. (2011). Evolutionary design of exper-
iments using the mapreduce framework. In Proceed-
ings of the 2011 Summer Computer Simulation Con-
ference, SCSC ’11, pages 76–83, Vista, CA. Society
for Modeling & Simulation International.
Deelman, E., Singh, G., Livny, M., Berriman, B., and Good,
J. (2008). The cost of doing science on the cloud: The
montage example. In High Performance Computing,
Networking, Storage and Analysis, 2008. SC 2008. In-
ternational Conference for, pages 1–12.
del Valle, Y., Venayagamoorthy, G., Mohagheghi, S., Her-
nandez, J.-C., and Harley, R. (2008). Particle swarm
optimization: Basic concepts, variants and applica-
tions in power systems. Evolutionary Computation,
IEEE Transactions on, 12(2):171–195.
Garc
´
ıa, A., G
´
omez, C., Garc
´
ıa-Carballeira, F., and Car-
retero, J. (2014). Enhancing the structure of railway
infrastructure simulators. In Proceedings of the 1st
International Conference on Engineering and Applied
Sciences Optimization (OPT-i), pages 352–363.
Gomez, J., Khodr, H., De Oliveira, P., Ocque, L., Yusta, J.,
Villasana, R., and Urdaneta, A. (2004). Ant colony
system algorithm for the planning of primary distribu-
tion circuits. Power Systems, IEEE Transactions on,
19(2):996–1004.
Jahn, S., Margraf, M., Habchi, V., and
Jacob, R. Qucs technical papers.
http://qucs.sourceforge.net/tech/node14.html. Last
accessed April 2015.
Kim, B. S., Lee, S. J., Kim, T. G., and Song, H. S. (2014).
Mapreduce based experimental frame for parallel and
distributed simulation using hadoop platform. In 28th
European Conference on Modelling and Simulation,
ECMS 2014, Brescia, Italy, May 27-30, 2014, pages
664–669.
Liu, Z., Liu, F., Zhang, B., Ma, F., and Gao, S. (2010).
Research on cloud computing and its application in
railway. Beijing Jiaotong Daxue Xuebao(Journal of
Beijing Jiaotong University), 34(5):14–19.
Mendoza, F., Bernal-Agustin, J., and Dominguez-Navarro,
J. (2006). Nsga and spea applied to multiobjective
design of power distribution systems. Power Systems,
IEEE Transactions on, 21(4):1938–1945.
Nguyen, P. H., Kling, W. L., and Ribeiro, P. F. (2011). Smart
power router: a flexible agent-based converter inter-
face in active distribution networks. Smart Grid, IEEE
Transactions on, 2(3):487–495.
Parada, V., Ferland, J., Arias, M., and Daniels, K. (2004).
Optimization of electrical distribution feeders using
simulated annealing. Power Delivery, IEEE Transac-
tions on, 19(3):1135–1141.
Pilo, E., Mazumder, S., and Gonzalez-Franco, I. (2015).
Smart electrical infrastructure for ac-fed railways with
neutral zones. Intelligent Transportation Systems,
IEEE Transactions on, 16(2):642–652.
Pilo, E., Rouco, R., Fernandez, A., and Hernandez-Velilla,
A. (2000). A simulation tool for the design of the
electrical supply system of high-speed railway lines.
In Power Engineering Society Summer Meeting, 2000.
IEEE, volume 2, pages 1053–1058 vol. 2.
Radenski, A. (2013). Using mapreduce streaming for dis-
tributed life simulation on the cloud. In Proceedings
of the Twelfth European Conference on the Synthesis
and Simulation of Living Systems. ECAL 2013., pages
284–291.
Ramirez-Rosado, I. and Bernal-Agustin, J. (1998). Genetic
algorithms applied to the design of large power dis-
tribution systems. Power Systems, IEEE Transactions
on, 13(2):696–703.
Ramirez-Rosado, I. and Dominguez-Navarro, J. (2004).
Possibilistic model based on fuzzy sets for the mul-
tiobjective optimal planning of electric power distri-
bution networks. Power Systems, IEEE Transactions
on, 19(4):1801–1810.
Soler, M., Lopez, J., Mera Sanchez de Pedro, J., and
Maroto, J. (2015). Methodology for multiobjective
optimization of the ac railway power supply sys-
tem. Intelligent Transportation Systems, IEEE Trans-
actions on, PP(99):1–12.
Strbac, G. and Djapic, P. (1995). A genetic based fuzzy
approach to optimisation of electrical distribution net-
works. In Genetic Algorithms in Engineering Systems:
Innovations and Applications, 1995. GALESIA. First
International Conference on (Conf. Publ. No. 414),
pages 194–199.
SIMULTECH2015-5thInternationalConferenceonSimulationandModelingMethodologies,Technologiesand
Applications
438
