
Hyred
HYbrid Job REcommenDation System
Bruno Coelho
1
, Fernando Costa
2
and Gil M. Gonçalves
1,3
1
INOVA+, Centro de Inovação de Matosinhos, Rua Dr. Afonso Cordeiro, 567, 4450-309, Matosinhos, Portugal
2
Department of Informatics Engineering, Superior Institute of Engineering of Porto,
Rua Dr. António Bernardino de Almeida, 431, 4249-015, Porto, Portugal
3
Department of Informatics Engineering, Faculty of Engineering, University of Porto,
Rua Dr. Roberto Frias, 4200-465, Porto, Portugal
Keywords: Recommender Systems, Decision Support Systems, Match-making Algorithms, Jobs, Employment, Work,
Teams, User Modelling, Content-based Filtering, Collaborative Filtering.
Abstract: Nowadays people search job opportunities or candidates mainly online, where several websites for this
purpose already do exist (LinkedIn, Guru and oDesk, amongst others). This task is especially difficult because
of the large number of items to look for and manual compatibility verification. What we propose in this paper
is a Hybrid Job Recommendation System that considers the user model (content-based filtering) and social
interactions (collaborative filtering) to improve the quality of its recommendations. Our solution is also able
to generate adequate teams for a given job opportunity, based not only on the needed competences but also
on the social compatibility between their members.
1 INTRODUCTION
Social professional networks have had an exponential
growth in the last few years, mainly due to the
banalization of internet access. LinkedIn, created in
2003, is now the most relevant professional network
platform; it has reached 300 million users in 2014
(Wagner, 2014), being that 210 million were
registered in the last 5 years. As LinkedIn allows the
input of job opportunities, if someone is looking for
the most suitable job, the universe of search is pretty
vast: 3 million jobs vast, to be more precise (Smith,
2015). Of course that one can focus this job search to
only one specific activity area, or search on an
existing recommended jobs list.
However, there is still a need for an extensive and
manual analysis of each one of the job specifications
(e.g. analyse required experience, technical skills,
education, etc.) to know which jobs really are the
most adequate to the candidate, or if we are what the
opportunity really needs (opposite perspective of the
recommendation).
These job search platforms lack in features that
could attenuate or even eliminate all this trouble: a
precise Recommendation System (RS) that takes in
consideration all the parameters that a human
resources (HR) specialist would normally take when
searching for the best opportunity or candidate. Also,
they lack on a very relevant matter – team
recommendation. This would represent a very
efficient and useful way of searching all the best
candidates and verifying which of them would
probably make a good team together. Also, this could
help an HR specialist finding a perfect fit for an
existent team.
In this job search context, the main objective is the
recommendation between entities of the domain:
users and opportunities. On almost any type of
situation where recommendations need to be
calculated, one issue automatically arises – possible
large volume of items to compare (similarity
calculation) and consequently low speed in the
recommendations calculation. In this scenario, speed
is especially relevant, because of the complexity that
entities can reveal. E.g. a user can have multiple
professional experiences, soft skills and technical
skills associated, so the similarity calculation can be
as complex as the complexity of its profile and its
interactions with the system. The same logic applies
to the opportunities that can be characterized by the
same dimensions. The size of the solution space is a
problem especially in the team recommendation
context, because of the large number of possible
combinations that can be done with a small number
29
Coelho B., Costa F. and M. Gonçalves G..
Hyred - HYbrid Job REcommenDation System.
DOI: 10.5220/0005569200290038
In Proceedings of the 12th International Conference on e-Business (ICE-B-2015), pages 29-38
ISBN: 978-989-758-113-7
Copyright
c
2015 SCITEPRESS (Science and Technology Publications, Lda.)

of users (e.g. for 15 users, combined in 10 element
groups,1510 3003). Another problem has to do
with the known cold-start issue (Sahebi & Cohen,
2011), that consists on having little to none
information about the entities at play.
2 RELATED WORK
In this chapter we present you some examples of
previous research made within the scope of the same
job recommendation area, i.e. job recommendation
systems (JRSs). These endeavours have helped
HYRED immensely by providing excellent problem-
resolution thinking and analysis, as well as an overall
experience when trying to tackle the same difficulties.
It is believed that HYRED has made good use of those
examples and has improved upon some of the features
made available by them.
(Lu et al., 2013): This research has some
similarities to our solution, being that this is a hybrid
RS that uses both content-based and interaction-based
data to make recommendations. Based on that
information, it creates a graph that relates all the
entities involved and then, using that graph, calculates
similarities. The main differences between this
system and our solution are: (1) this system does not
have the ability to make team recommendations; (2)
profile similarity calculations are made using Latent
Semantic Analysis (LSA) tools and (3) the system
cannot inference new information. This tool analyses
text files that contain the content of profiles (instead
of directly comparing each entity’s profile
characteristics), leading to less precise results.
(Datta et al., 2013): This project consists on a
framework characterized by three sets: individuals I,
expertise areas EA and social dimensions SD. The
elements of such sets are captured using three graphs:
competence graph, social graph and history graph.
This is an interesting approach, because it divides the
content into three different data structures, so the
content in each one of the graphs is more specialized.
However, because the information is partitioned into
various graphs, one cannot infer new knowledge that
uses information from more than one graph (or at
least the database cannot). Although, because the
platform information has a simplified structure, the
recommendation of teams can be executed relatively
fast. This solution continues to have the same
combination explosion problem already explained,
because all the team combinations must be
individually calculated, as well as their members’
compatibility. Also, there are several sources of
information used for the team recommendation
calculations; the quantity of information available is
vast, leading to more complexity.
(Yu et al., 2011): This project makes two-way
recommendations (between jobs and users), which is
also exactly what HYRED performs. To make
suggestions, they perform the following steps: (1) use
explicit information extracted from user résumés and
jobs’ attribute information and convert them to vector
space models (VSM), in order to calculate the
similarity of explicit preference (it is not very clear if
the job entity is also described through a résumé); 2)
they use all the other résumés that exist in the
platform to locate implicit preference, according to
the proportion of each of the attributes being
compared. These steps are followed by similarity
calculations, using explicit and implicit information.
This solution has as main advantages the simplicity
and efficiency of the similarity calculation, while
giving users total freedom to input whatever they like
without using rigid forms for profile definition.
However, the use of VSMs for the similarity
calculations has some issues: (1) user résumés with
similar context but different term vocabulary won’t
be associated; (2) the order in which the terms appear
in the document is lost in the VSM representation; (3)
keywords must precisely match résumés’ items and
4) words’ substrings might result in a “false positive
match” (e.g. ‘program’ and ‘programs’).
3 CONCEPT AND
ARCHITECTURE
HYRED is part of a broader web platform that has the
purpose of bringing together entities which can
execute tasks and entities which have the need to have
those tasks executed. The overall architecture is
represented in Figure 1: Components Diagram.
Figure 1: Components Diagram.
RDB
Triple
Store
User/Opportunity
inTripleForm
Recommendations
Interface
User/Opportunity
inTripleForm
User/Opportunity
New/Updated
User/Opportunity
Recommendations
ICE-B2015-InternationalConferenceone-Business
30
In the next subsections these components are
explained in some detail, before diving into the most
important aspect of HYRED: recommendations made
in the scope of the Recommendation Engine.
3.1 RDB (Relational Database)
The RDB component consists on a SQL Server
relational database that contains all the data from the
platform. Only some of this information is needed for
recommendations. Some attention was paid as to not
overload this component for the sake of
recommendations, since the most important criteria
for the availability of the database is the end-user
interface (see next section).
3.2 Interface
The interface refers to the web portal / application that
is publicly available for users to interact with and that
ultimately uses the features made available by the RS.
As users interact with it, the information in the RDB
is updated, triggering recommendation calculations
on the Recommendation Engine component. This app
has many of the typical features found today on
similar-themed platforms, such as social network,
badges, messaging, LinkedIn integration and more.
One of the most interesting scenarios is the capability
of any LinkedIn user to import some parts of its
profile into the devised platform, eliminating the so-
called cold start problem explained earlier.
3.3 Triple Store
A study was conducted about the best option for the
persistence of information of the platform’s entities,
which would at the same time enable for a fast
recommendation generation without having an
impact in the web app. Two possibilities were found:
a RDB (another one or the same one presented earlier)
or a Triple Store (TS). After analysing the pros and
cons, the TS was chosen. This approach to data
storage has many advantages over RDB databases,
and most of those are very relevant in this context.
The most relevant advantages are schema flexibility,
reasoning power, standardization and cost. There are
some disadvantages on the use of a TS though, such
as data duplication and maintenance of inference
rules. A TS stores data in a graph-like structure,
where entities are directly connected to each other
and to their characteristics. A simple example of a
data structure stored in a TS is showed in Figure 2:
Graph Inference Example.
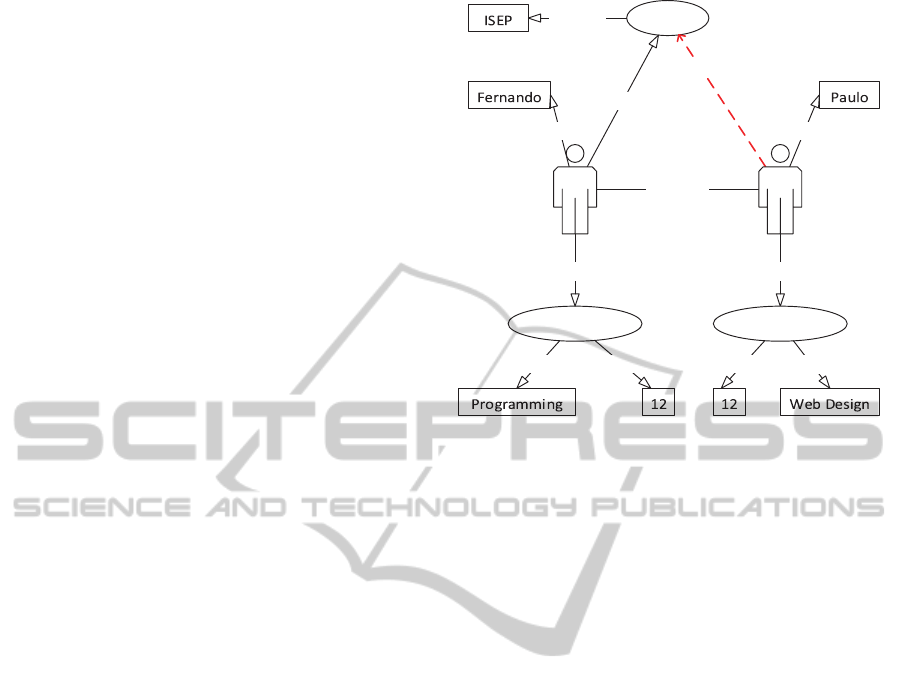
Figure 2: Graph Inference Example.
The TS contains all the data related with the
entities that are relevant for the recommendations
calculation. This data contains not only the data
related with the characteristics of the entities but also
the relations between them (e.g. user’s friends, user’s
likes, followed entities, etc.). This information can
then be used by the TS itself to infer new information.
As an example, a TS can infer that a person
possibly likes a certain institution if (1) a person X is
friend of a person Y and (2) a person Y follows some
institution Z. This can be visualized in the Figure 2:
Graph Inference Example. Inference rules are created
using the Semantic Web Rule Language (SWRL).
3.4 Recommendation Engine
This component is the most important of all and is
responsible for the recommendations’ calculations
and the conversions between the RDB and the triple
format (for the TS). These actions are triggered for
some entity that is either added or updated in the
database, therefore only operating when necessary.
The recommendations are calculated for every
possible combination of entities in the platform, so
that end users have all of this important and useful
data when navigating through the web app in a
general purpose or with any of the most typical goals
of the job market. These calculations are made
originally made for all the elements present, with no
restrictions made to the universe of search.
Conversions between the database and TS are
made for every dimension related with the entities
that are later used for recommendation. So users/
isFriendOf
Institution
hasName
hasName
follows
hasName
Work Experience#2
hasWorkExperience hasWorkExperience
WorkExperience#1
[INFERRED]‐possiblyLikes
Person#2 Person#1
months
activityArea
activityArea
months
Hyred-HYbridJobREcommenDationSystem
31

Figure 3: Entities’ Similarity Calculation.
opportunities are completely “converted” to the TS,
including not only their characteristics but also their
interactions with the system; this means that after the
conversion is made, the RDB is no longer necessary
and thus the system is completely free to attend web
requests from users. After that, similarities between
entities are calculated offline, so that there is no
noticeable delay in the user interface. As soon as an
entity is modified, all their similarities related to
every other entity in the system are recalculated.
4 RS ALGORITHMS
In this subsection we describe in technical and
mathematical detail how all recommendations are
made.
The core component of the devised work is a set
of heterogeneous data blocks (content-based data)
that make up for the most important part of the
recommendation calculation. We started by defining
which information pieces to attach to each one of the
entities involved in the recommendation context
(users and opportunities) and by streamlining that
data into common blocks that would be used in a
modular way in all recommendation scenarios. We
have defined the following large information
dimensions: (1) Education; (2) Languages; (3) Soft
Skills; (4) Technical Skills; (5) Work Experience and
(6) Physical Location. These dimensions (along with
the simpler activity area and optional likeability ratio)
are the basis of the similarity calculation between
entities, and thus the basis for the more advanced
forms of recommendation referred later. The fact that
these dimensions are shared between entities eases
and fastens the similarity calculation, while
increasing precision. The dimensions of an entity
“Opportunity” refer to the needed specifications for
the related job opportunity; as for the entity “User”,
they refer to personal characteristics of human
candidates (users). With the aforementioned structure
in place, we will now present how we calculate the
most basic kind of recommendation.
4.1 Entity Recommendations
We make singular entity recommendations (SER) by
calculating the similarity between one instance of any
of the basic entities involved in the job search
scenario: user and opportunity; therefore we have the
following combinations / types of recommendations:
user-opportunity, user-user and opportunity-
opportunity. User-group recommendations can also
be obtained by going through the user-user
recommendations of the respective group members
(using the average). These calculations take into
consideration all the dimensions associated with each
one of the entities being compared. Using those
similarities, we then calculate a final one that sets a
weight to each one of them and then aggregates them
all. In Figure 3: Entities’ Similarity Calculation we
summarily demonstrate how this similarity
calculation works. We now explain in detail each one
of the dimensions’ similarity calculations (each one
of the squares contained in the central part of Figure
3: Entities’ Similarity Calculation).
4.1.1 Educations
Educations refer to the academic background related
with the entities; at the current time only more formal
types of formations are supported. When calculating
their similarity, the compared attributes are:
institution, activity area (compared based on the
semantic distance between them, using (1)
(Blanchard et al., 2005)), grade (numeric distance)
and degree (numeric distance).
1
∗
(1)
The semantic distance between two entities of the
same type is performed in the following dimensions:
Dimensions
ActivityArea:X
WorkExperience:Y1
WorkExperience:Y2
WorkExperience:Y3
Education:Z1
Education:Z2
Dimensions
ActivityArea:X
WorkExperience:Y1
WorkExperience:Y2
WorkExperience:Y3
Education:Z1
...
EntityX
EntityY
ICE-B2015-InternationalConferenceone-Business
32

activity areas (used in their own similarity and within
experience and education) and technical skills. The
variable
is the number of levels in
the hierarchy that separate both concepts, while can
act as 1 or 2 depending on whether the comparing
entity is a superclass or a subclass of the comparison
target respectively (i.e. we gave more importance to
specialization rather to generalization).
∗0.2
∗0.5
∗ 0.15
∗ 0.15
(2)
4.1.2 Languages
Languages refer to language skills that entities
possess. Compared attributes are the language id and
proficiency (numeric distance).
1
⁄
(3)
4.1.3 Soft Skills
Soft skills (SSs) are personal traits and human
characteristics that play an important part in the job
search problem. Because SSs can be completely
defined only by its Id (i.e. the existence of that skill),
the comparison is directly made.
_
_
/_
(4)
4.1.4 Technical Skills
Technical skills (TSs) are one of the most important
and used information pieces when comparing
candidate / job profiles and, in the scope of HYRED,
are compared based on the next attributes: technical
skill id (semantic distance, i.e. (1) and proficiency.
∗0.7
∗0.3
(5)
4.1.5 Work Experience
Work experiences possessed by people or required by
opportunities are compared based on the next
attributes: activity area (1) and duration.
∗0.7
∗0.3
(6)
4.1.6 Physical Location
The physical location is compared based on the real
distance between the locations of the compared
entities. This distance is more relevant when
calculating user-user similarities because of the
propinquity factor (Rauch, et al., 2003) (please check
4.1.4 - Physical Location of Team Members).
∗0.9
∗0.1
(7)
4.1.7 Activity Area
The activity area to where the entity belongs to can
have a relevant importance in the similarity between
entities. Therefore it is compared based on its
semantic distance to other areas, using (1).
4.1.8 Likeability Ratio
Unlike other dimensions, which are explicit profile
parts of each one of the entities, the likeability is an
indirect value that measures the relationship between
a user and an institution related with an opportunity
(thus it’s not used for user-user or opportunity-
opportunity calculations). (8) shows a part of that
likeability; however, that equation may still add some
additional conditions, such as (1) if the user follows
that institution or (2) if he is a member of it.
∗0.3
(8)
4.1.9 Final Similarity Calculation
The final similarity calculation weights each one of
the explained dimensions with an almost-equal
distribution; these weights are configurable through a
configuration file, so that they can be further refined
(attributes of each one of the dimensions are not
currently configurable). We have defined the weights
with the values shown in Figure 4: SER Weights.
Figure 4: SER Weights.
By using all of the previously explained formulae,
the final similarity value is then given by (9).
_
_ ∗ 0.15
_
∗ 0.1 _ ∗ 0.1
_ ∗ 0.15 _ ∗ 0.15
_
∗ 0.15 _ ∗
0.1 〖〗
_
∗ 0.10
(9)
15,00%
10,00%
10,00%
15,00%15,00%
15,00%
10,00%
10,00%
Education
Languages
Soft Skills
Technical Skills
Work Experience
Physical Location
Activity Area
Likeability Ratio
Hyred-HYbridJobREcommenDationSystem
33

4.2 Team Recommendations
Teams are groups of people; however, not all groups
are teams, because a team is so much more than just
a set of people together and that fact alone triggers all
sorts of changes and interactions between people that
otherwise wouldn’t happen. With that in mind, we
have studied which are the concepts and human traits
that may have an influence in achieving the perfect
group of users that can make up a good team for a
certain opportunity (i.e. only those related with the
job domain). Based on a number of different studies,
our research has come up with the following four
upper-level components that, when combined, are
able to distinguish one good team from a simple /
plain group of people: (1) number of team members,
(2) team cohesion, (3) required competences and (4)
physical location of team members. In the next
sections we thoroughly detail the research and nature
of these components in the scope of team
recommendations, as well as how we use them in
HYRED.
4.2.1 Number of Team Members
How many people does the team have is one of the
major variables to consider, not only because of
resources to be allocated for the project but also
because it has an impact on the rest of the variables.
We have analysed some previous studies on the
subject that have helped us reach a more grounded
concrete idea for the team member number.
(Widmeyer et al., 1985) and (Ringelmann, 1913)
have researched, through a simple rope-pulling test,
the relationship between the number of team
members and the individual member’s average
performance. The results were surprising,
demonstrating that, as new members were added to
the team, the average effort by each member actually
decreased. This is related with a known phenomenon
called “social loafing” (SL) that happens when people
exert less effort to achieve a goal when they work in
a group rather than alone (Simms and Nichols, 2014).
(University, 2006), that had also studied the SL
phenomenon, said that the ideal number of team
members is somewhere between 5 and 12, being the
number 6 the most relevant in his studies. In (de
Rond, 2012) it is considered that the maximum
number of team members should be 4 or 5. Teams
with less than 4 are too small to be effective and teams
over 5 are non-efficient. A study made by (Putnam,
2015) (that includes as metrics concepts such as size,
time, effort and detected defects) showed that in short
term projects, bigger teams (with an average of 8.5
workers) reduced only 24% of the execution time
relative to smaller teams (with an average of 2.1
workers), i.e. a direct relationship between the
number of people in a team and the productivity
(increase) was not found.
Based on the aforementioned literature, we chose
to define the number of team members to a maximum
of ten. This is the top number of people suggested that
a team working together must have, having in
consideration productivity maximization and team
inefficiency minimization. We also suggest 6 as the
number of optimum team size for projects which
necessarily will be multi-people, but we enable
people to refine that number as they please.
4.2.2 Team Cohesion
Groups, as all living creatures, evolve over time.
Initially a group is just an agglomerate of people who
happened to work together, but the uncertainty
eventually gives place to cohesion as the members
bond with each other through strong social
connections. Cohesion depends essentially on how
well people relate with one another, as pairs and as
groups; it is what keeps a team together after the
presence of relationships between all the members. It
prevents team fragmentation, keeping its members in
a constant state of bonding, as well as avoids
problems and animosities.
(Widmeyer et al., 1985) defends that there is a
clear distinction between the individual and the group
when one talks about team cohesion. For one, there is
the attraction of the individual to the group – how
much he / she wants to be a part of it. Then there is
the group aspect, represented by a set of perceptions /
features that consist, e.g. in the degree of proximity,
similarity and union inside the group. Widmeyer also
defends that there is a clear distinction between social
cohesion and task cohesion. While social cohesion
refers to the motivation to develop and maintain
social relations with a group, task cohesion refers to
the motivation of reaching company or project goals.
We can conclude that the ideal scenario would be
when both cohesions exist; indeed, the existence of
only one is a bad omen for low cohesion in the long
run. In the proposed solution, we chose not to
calculate task cohesion, since the detection of this
kind of psychological trait is difficult based on
existing data. The best way to identify it is analysing
/ monitoring the physical behaviour of a person when
working on a certain task; also, in the context of team
recommendation, this variable does not have that
much relevance, since people can have a very high
cohesion on a certain task and very low on others.
ICE-B2015-InternationalConferenceone-Business
34

Social Cohesion
A way of detecting team cohesion is analysing the
social cohesion, since a team is a form of social
interaction. We reach this by using a formula that
appears in (Sahebi & Cohen, 2011). This
combines all the following variables:
Shared projects: the number of projects that each
person has in common with other team members
(this has a very direct relationship with his / her
interpersonal or emotional connection)
Friendship relations: friendship / contact
relationships between team members (just like in
Facebook or LinkedIn) are one of the most
obvious pieces of information for probable
likeability between people
Shared interests: if team members share the same
interests or tastes (if they follow the same entities
in the network, such as people and institutions),
attended the same institutions, etc.
Next we describe the approach that was used in each
one of the defined variables, in order to make them
ready to be included in the
equation.
Shared Projects
Consider
,…,
as being the group of
connections between elements of a certain group of
people. Each element of connects two persons and
has an associated weight relative to the number of
shared projects between them. Consider also as
being the heaviest weight of the set and
representing the number of elements contained in that
same set. Let be the set of users that are related in
the set’s connections. Based on this statements, we
obtained (10) that we called
.
1
∑|
|
|
|
|
|
∗
,∀ 1;∀2
(10)
Friendship Relations
Consider the set of friendship connections between
users from the team being analysed
,…,
.
We represent the number of elements of the set
using the (number of friendships) variable.
Consider also the number of all the possible
combinations of relations between those users
represented by . With this, we have defined a
that represents the friendship
between all the elements from a team in (11).
,∀∈
0, ∞
,∀∈
0, ∞
,
(11)
Shared Interests
One important step in the team cohesion calculation
is the analysis of their members’ shared interests /
tastes (when in the scope of job-related matters). We
have made this calculation using the following
connections:
Likes to the same posts (e.g. two persons show
that they like the same post submitted in the
system)
Follows to the same entity (e.g. two persons
follow the same company in which they are
interested in)
Frequency of the same scholar institution or even
the same course (in their respective profiles)
For the sake of brevity, the underlying assumptions
about these variables were left out. (12) is the one that
handles all these variables.
∗0.4
∗0.3
∗0.3
(12)
We have then defined in (13 how to calculate the final
score related with the social cohesion. Consider a
certain set
,…,
that contains a group of
people. We have also set weights for the three
components mentioned before such as that shared
projects and friendship relations are both 25%
important, while shared interests are 50%.
∗
0.25
∗0.25
∗0.5
(13)
4.2.3 Required Competences
(Datta et al., 2011)– “If a set of people do not provide
complete coverage, then they cannot form a
legitimate team by themselves”. This means that at
least one of their members must fulfil each one of the
required competences. In order to calculate a numeric
value representative of a team’s competence
(
), we use (14) presented by (Datta
et al., 2011).
∑
Ω
|
|
,
|
|
(14)
We now explain how the formula above works.
Consider a group of people
,…,
, a group
of key competences
,…,
, and a function
∶→ that allows to calculate the value
of a person related with a competence. Now
consider also the Ω possible values, so that Ω∈
, ,
, that helps quantifying the value of
the competences of a person according to indicated
Hyred-HYbridJobREcommenDationSystem
35
preferences. The value gives more importance
to the existence of experts in a certain competence,
while the gives more relevance to the existence
of a balanced team on each of the required
competences. The usage gives more importance
to the minimization of “weakest links”.
With the objective of reducing the number of
combinations to be calculated (i.e. avoiding using the
whole universe of search), we’ve considered only the
top 15 candidates for a given opportunity. These
candidates are obtained through the already
calculated similarities (SERs). This way, we limit the
number of combinations to be analysed to a
maximum of 157 6435. There is the clear
understanding that this kind of limitation may leave
out some excellent teams; a great team may not
necessarily be composed of the very best of the best,
nor can HYRED (or any platform for that matter)
predict particular types of problems that may happen
between teams (such as psychological disorders). It is
being tried to come up with some techniques to be
able to relax this constraint in the medium / long run.
Some examples may be the use of artificial
intelligence techniques related with the analysis of
long-term data (such as neutral networks and case-
based reasoning) which end up providing us with
inferred patterns, the clustering of data regarding any
of the information pieces that describe entities (as
mentioned before), the explicit filtering of data
through the web interface, amongst others.
4.2.4 Physical Location of Team Members
In the context of virtual teams (teams that do not work
in the same physical space), the physical proximity of
their members can still have a big influence on its
success; one of the main reasons is the fact that, as
explained before, people’s propinquity ends up
influencing their similarity. This means not only
people’s personality plays a role on this likeability,
but also their culture / background, easing the
interpersonal relations between them. With the goal
of calculating the similarity between team members
related with their geographical location, we have
created (15). In this formula, we sum up the averages
of the distances between each pair of team members
and we divide that number by the squared number of
people.
∑
º
⋯
∑
º
º
(15)
1
(16)
4.2.5 Team Score Formula
After the description of all variables that come into
play when we evaluate the recommendation of a team
of people, we then present the final formula that
aggregates them all (17). We have distributed the
weights this way: team cohesion (35%), needed
competences (50%) and physical location (15%).
This equation is the basis for the opportunity-team
recommendations that will join the other ones already
presented earlier.
∗0.3
∗0.5
∗0.15
(17)
5 TESTING AND VALIDATION
In order to evaluate HYRED, we have made tests
regarding recommendations’ calculations. Because
the system is still not live and publicly available, we
had to build a dummy data set for this purpose.
5.1 Recommendation Speed
The first test is about the speed of recommendation’s
generation, i.e. the time it takes for the HYRED
algorithm to be run against a particular user or
opportunity.
Figure 5: Entity Recommendation Speed and
Figure 6: Team Recommendation Speed show the
calculation speeds for SERs (explained in section 4.1)
Figure 5: Entity Recommendation Speed.
Figure 6: Team Recommendation Speed.
0
100
200
300
25 50 100 300
ms
#ofelements
USR‐>OPO OPO‐>USR
0
20
40
100 500 1.000 2.000
ms
#ofteams
Recommendations
ICE-B2015-InternationalConferenceone-Business
36

and team recommendations (explained in section 4.2)
respectively. This test was conducted on a machine
with the following specifications: CPU Intel Core i7-
3630QM, RAM 6GB 1600MHz and HDD 500 GB
5400 RPM.
These obtained recommendation times are
acceptable, as they are calculated offline (please
check section 3) and are not needed in real-time by
the application user. However, as the number of
entities in the database increases, this time delay can
be a problem. As one can infer by analysing Figure 5:
Entity Recommendation Speed and considering that
it takes 100ms to process 43 users, if there were
100.000 elements in the database, then the average
time that would be required to do this calculation
would be approximately 232s (~4min) (applying a
simple rule of three), which clearly is high. We have
to take into consideration that we are making an
extensive complex analysis to all possible
combinations in the RDB. This is mainly due to the
need for accuracy and precision of the
recommendations’ generation. Knowing these
bottlenecks, we can make some improvements, such
as: (1) more processing power, (2) multi-threading
and (3) clustering.
5.2 Precision
As the main goal in a RS is the interest of the
recommendations themselves for the user who
receives them, we have made a classic precision test
to evaluate this matter. In this test, we started by
defining 25 very different user and opportunity
profiles (different backgrounds). We then calculated
SERs between all of those entities and manually
evaluated the obtained results, which are
demonstrated in Table 1: Confusion Matrix.
Table 1: Confusion Matrix.
Predicted Class
Objective
Class
Suggested Not Suggested
Relevant 21 4
Irrelevant 0 0
Using the Table 1 data we have calculated some
metrics that help us evaluating in a more precise
manner the quality of the obtained recommendations.
This measures can be analysed in the Table 2:
Evaluation Metrics.
Analysing the calculated metrics, we can
conclude that the SERs obtained through the RS have
a very high quality and so a very high relevance for
the application users. Although manual evaluation
and the overall precision testing scenario lacks a more
formal and objective approach (please check the next
section), the results obtained were very promising,
surpassing at least one of the related work’s research
numbers ((Lu et al., 2013) had an average of 0.5 for
precision).
Table 2: Evaluation Metrics.
Metric Result [0-1]
Recall
21/21 4 0,84
Precision
21/21 0 1
F-measure (relates precision and recall)
2
2
1 0.84
1 0.84
0,45
5.3 Validation Scenario
The aforementioned tests were made primarily to
assess the robustness of algorithms and the overall
concept of the platform, which at the moment has
been deployed with a Minimum Viable Product
(MVP) designation and approach. However, HYRED
also needs to be validated using other means, such as
with real scenarios and more intensive needs. To this
end, the following pilots are already planned to be
executed: (1) a real use-case of a company in need of
freelance consultants in the IT sector (30 user profiles
are already present) and (2) the dissemination of the
platform into several consultancy companies /
technology and business hubs in order to promote the
use of the system in such extremely dynamic and
demanding job market scenarios.
6 CONCLUSIONS
HYRED is a system that is able to make suggestions,
in an accurate and precise manner, between users and
opportunities. It can also generate team suggestions
for a particular opportunity, based on its complex
description requirements. These recommendations
are made based on: (1) explicit information from user
and opportunity profiles (not only directly compared
but based on their semantic distances); (2) social
network interactions – e.g. shared likes, shared
follows and item visualizations and (3) implicit
information, through inference of new knowledge
(using the TS discovery capabilities). Our tests so far
have found out that, being a RS more closely related
to the content-based nature, it correctly recommends
items with a fairly high precision and, since we have
moved our most resource-intensive processes into an
offline component, recommendations can be used in
Hyred-HYbridJobREcommenDationSystem
37

a real-time application with great success as far as
RS-related features and usability are concerned.
However, there is still a lot to be made in order to
improve, above all, the recommendation mechanism.
For instance, it will be tried to improve the
recommendation’s calculation speed both by
increasing the server’s hardware capabilities as well
as using the server’s multi-threading feature. Also, we
want to use clustering techniques to reduce the
universe of search – e.g. when trying to find the top
candidates (or teams) to an opportunity, only
calculate similarities to the 1000 closest users. It is
also expected to improve the accuracy and recall of
the recommendations by inferring more knowledge
about users and opportunities. This new knowledge
can be easily inferred through the addition of more
knowledge rules into the TS, after careful study of
existing recruitment / web likelihood patterns and / or
through the analysis of HYRED analytics itself. This
evidently increases the calculation load of the TS;
however, it does not make much difference in
response times and user perception.
In addition, work team search configurations will
also be implemented (cohesiveness, competence,
creativity, etc.) and make them available to the final
user without losing much speed in the similarity
calculations. These features will allow the platform
users to search, in a more precise way, for the exactly
kind of team profile they want given their
requirements. Despite SERs’ weights being already
currently configurable, it would be very interesting to
also analyse the effectiveness of the present chosen
parameters, as well as to come up with a methodology
to improve these values with time and maybe to
automatically suggest optimizations to them based on
the actual use of the platform.
However, since the platform is still in MVP stage,
some issues are yet to be dealt with, such as
scalability, user acceptance, analysis on the validation
scenario, analysis as to how the solution is actually
used, etc. On the other hand, research into the whole
area of JRSs will not halt with this study, so we expect
to continue making significant progress into HYRED
by embedding more found evidence and work done,
either by the authors or related.
ACKNOWLEDGEMENTS
This work has been supported by the project
WorkInTeam, funded under the Portuguese National
Strategic Reference Programme (QREN 2007-2013)
under the contract number 2013/38566.
REFERENCES
Blanchard, E., Harzallah, M., Briand, H. and Kuntz, P.,
2005. A typology of ontology-based semantic measures.
s.l., s.n.
Datta, A., Braghin, S. and Yong, J. T. T., 2013. The Zen of
Multidisciplinary Team Recommendation. In: Journal
of the Association for Information Science and
Technology. s.l.:s.n.
Datta, A., Yong, J. T. T. and Ventresque, A., 2011. T-RecS:
Team Recommendation System through Expertise. s.l.,
s.n.
de Rond, M., 2012. Why Less Is More in Teams. Harvard
Business Review.
Lu, Y., Helou, S. E. and Gillet, D., 2013. A recommender
system for job seeking and recruiting website. s.l., s.n.
Putnam, D., 2015. Haste Makes Waste When You Over-
Staff to Achieve Schedule Compression. [Online].
Rauch, K. L., Scholar, M. and University, P. S., 2003.
Human Mate Selection: An Exploration of Assortative.
s.l., s.n.
Ringelmann, M., 1913. Recherches sur les moteurs animés:
Travail de l'homme. In: Annales de l’Institut National
Agronomique. s.l.:s.n.
Sahebi, S. and Cohen, W., 2011. Community-Based
Recommendations: a Solution to the Cold Start
Problem. s.l., s.n.
Simms, A. and Nichols, T., 2014. Social Loafing: A Review
of the Literature. In: Journal of Management Policy and
Practice. s.l.:s.n.
Smith, C., 2015. By the Numbers: 12 Interesting LinkedIn
Job Statistics. [Online].
University, W., 2006. Is Your Team Too Big? Too Small?
What’s the Right Number?. [Online].
Wagner, K., 2014. LinkedIn Hits 300 Million Users Amid
Mobile Push. [Online].
Widmeyer, W. N., Brawley, L. and Carron, A., 1985. The
measurement of cohesion in sport teams: the Group
Environment Questionnaire. s.l.:s.n.
Yu, H., Liu, C. and Zhang, F., 2011. Reciprocal
Recommendation Algorithm for the Field of
Recruitment. In: Journal of Information and
Computational Science. s.l.:s.n.
ICE-B2015-InternationalConferenceone-Business
38
