
The Impact of Digital Presence on Competitive Advantage
A Study Applied to Brazilian Bank Industry
Claudio Luis Cruz de Oliveira, Veranise Jacubowski Correia Dubeux and Vinicius Andrade Pereira
ESPM Media Lab, Escola Superior de Propaganda e Marketing, Rua Doutor Álvaro Alvim, 123, São Paulo, Brazil
Keywords: Digital Presence Index, e-Metrics, e-Business, Bank, Internet Banking.
Abstract: This pilot study analyses the impact of Digital Presence on the competitive advantage of the Brazilian banks.
The research reinforces previous findings. It verifies high correlations of digital variables and business results.
The study also introduces the Digital Presence Index (DPI) to consolidate the digital metrics. Additionally,
the paper proposes new forms to visualize the variables. These contributions may improve the decision-
making process of marketing analysts, business executives, and Internet professionals.
1 INTRODUCTION
The impact of digital presence on sales, brand recall
and profit has often been confirmed (Pauwels et al.
2012; Harrison, 2013; Westerman et al. 2012).
However, the executives face difficulties to make
decisions based on complex online metrics (Kaushik,
2007). The objective of this paper is to describe the
steps in the construction of a simplified digital
presence index (DPI). We intend to clarify the
following research questions:
How can we measure the digital presence and
business results of the largest Brazilian banks?
Which variables of the digital presence affect
the business results most?
Is it possible to consolidate these variables in a
DPI representing the competitive advantage of
banks?
This pilot study aims to analyze the relationship
between digital presence (Haj-Bolouri et al., 2014;
Thibeault, 2012) and competitive advantage (Porter,
2001), considering a limited set of the largest banks
in Brazil. We chose the Brazilian banking industry
because 40.6% of the Brazilian online users accessed
internet banking in 2013 vs. 32.7% of the users
worldwide (ComScore, 2014). Moreover, almost half
of the banking transactions happens on the site or
mobile applications in Brazil (Febraban, 2014).
Future studies must include a larger set of companies
from different industries.
A research with the 12 leading banks in Brazil
suggests that the digital presence variables have high
correlation with business results as profits, assets and
deposits. The DPI captured these correlations as well
as the performance of each bank. Additionally, we
represented the DPI of a bank in an importance-
performance matrix (Martilla and James, 1977, Slack,
1994) as a recommendation to a decision-making
process to improve the digital presence.
2 RELATED WORK
Brands and companies aim to be exposed in the
digital world. The digital presence is a broad concept
that encompasses the company exposure as a whole
on the Internet, whether controlled by the corporation
or not (Haj-Bolouri et al., 2014; Thibeault, 2012).
Interactive marketers define the digital presence as a
set of channels with the consumer on the Internet and,
furthermore, such conversation between consumers
about brands and companies. They classify the
channels as paid, owned and earned media (Pauwels
et al., 2012; Corcoran, 2009). The owned media are
the channels controlled by the company (e.g., website
applications). The paid media are communication
efforts to leverage the enterprise channels (e.g.,
display ads, paid search). The earned media occurs
when consumers become the channel (e.g., social
networks, blogs) (Corcoran, 2009).
The digital presence is compounded by three
levels of media: paid, owned and earned (Pauwels et
al., 2012; Corcoran, 2009). The owned media is
controlled by the companies; it is formed by the
80
Luis Cruz de Oliveira C., Jacubowski Correia Dubeux V. and Pereira V..
The Impact of Digital Presence on Competitive Advantage - A Study Applied to Brazilian Bank Industry.
DOI: 10.5220/0005546900800087
In Proceedings of the 12th International Conference on e-Business (ICE-B-2015), pages 80-87
ISBN: 978-989-758-113-7
Copyright
c
2015 SCITEPRESS (Science and Technology Publications, Lda.)

website, mobile apps, blogs and social media
accounts. The paid media is the investment to
leverage an owned channel as displays ads, paid
search, and sponsorships. The buzz and viral
replication of messages, when consumers become the
channel is earned media (Corcoran, 2009), as well as
the trend of the searches of the brand in search
engines as Google; this trend represents the unaided
brand recall (Kaushik, 2012).
Pauwels et al. (2012) observed that paid, owned,
and earned media metrics add explanatory power to a
sales response model that already includes marketing
mix actions. Harrison (2013) measured the impact of
these metrics on brand recall.
Westerman et al. (2012) observed the most
digitally mature companies are 26% more profitable
than their industry competitors This digital maturity
is compound by digital intensity, the investment in
technology-enabled initiatives to change how the
company operates, and the transformation
management intensity, the leadership capabilities
necessary to drive digital transformation in the
organization. Westerman et al. (2012) also described
the possibility of executives in every industry for
gaining digital advance.
Executives analyze multiple information systems
to monitor the market and prepare the company for
competition (Davenport and Harris, 2007). Although,
only a few companies capable to analyze the
increasingly amount of information (Kaushik, 2007;
Goes, 2014). The importance-performance matrix
helps executives to make better decisions based on
multiple indicators (Martilla and James, 1977; Slack,
1994).
3 METHODOLOGY
The research is descriptive in nature, and we used the
following methodological procedures: bibliographic
research, access to multiple databases, interviews,
workshops and multivariate analyses.
We used bibliographic research to explore the
concept of digital presence, its variables and to
exploit its link with business strategy.
The data about digital presence variables was
collected in multiple databases as Brazilian Central
Bank, ComScore, Google Trends and Social Bakers.
We interviewed six banking executives and two
social media researchers to explore the digital
presence and business results variables of banks.
These interviews were complemented with
workshops about e-metrics with marketing
executives of 10 companies.
We used multivariate analyses to measure the
correlation between variables. Finally, we developed
a quantitative model to consolidate and calculate the
DPI based on these correlations.
Despite efforts to produce a scientific
contribution, this research has some limitations:
the study represents the result of banking, not
allowing generalizations for other industries.
the Brazilian bank market is formed by large
companies, not allowing the comparison with
small and medium business;
it was not possibly to monitor the broad historic
of internet buzz of banks due to budget
limitations, so we used Google Trends data
about searches on Google;
for the same reason, we monitored only number
of likes and followers on Facebook and
Instagram. However, there are other relevant
social media sites as Instagram and Youtube;
the number of likes on Facebook is
questionable because fake users inflate the
statistics (Krombholz et al., 2012)
4 IMPLEMENTATION
4.1 The Digital Presence and Business
Results of Banks
To clarify the first question “how can we measure the
digital presence and business results of the largest
Brazilian banks?”, we need to problematize the
digital presence concept (Haj-Bolouri et al., 2014;
Thibeault, 2012) classifying its channels as paid,
owned and earned media (Pauwels et al., 2012;
Corcoran, 2009). We selected the banking industry
considering the massive use of these channels.
The owned media of banks have an expressive
role. About 28 million people use the internet banking
applications in Brazil (ComScore, 2014). The internet
is the main channel for banking transactions, 41% of
the transactions occur on the Internet. Mobile
operations correspond to 6% according to the
Brazilian Federation of Banks (Febraban, 2014).
These numbers show that internet banking is a critical
tool to maintain a competitive advantage in Brazil.
Brazilians use 8% more internet banking than the
global average (ComScore, 2014). There are some
historical reasons to explain this difference. Due to
hyperinflation in the 90s, the banks invested in
automated teller machines (ATM) to deal with the
huge movement of Brazilian branches. This
TheImpactofDigitalPresenceonCompetitiveAdvantage-AStudyAppliedtoBrazilianBankIndustry
81

technology platform boosted internet banking sites.
Brazilian consumers trust the security of internet
solutions because they are used to performing virtual
operations at ATM’s.
Brazilian banks are heavy media buyers. They are
the third industry in communication investments in
Brazil, buying almost USD 700 million in media in
the first semester of 2014 (Ibope, 2014). An
expressive share of this investment is destined to
online paid media.
The importance of earned media is fostered by the
Brazilians’ behavior on social media. Brazilians
spend 13 hours per month on social networks vs. 6
hours of users worldwide (ComScore, 2014). The
buzz about banks is expressive; one million tweets
mentioned the term “bank” in February of 2015
(Topsy, 2015).
The DPI aims to reinforce this contribution by
calculating the contribution of each e-metric to the
business results. The importance of each variable will
be proportional to the correlation between the e-
metric performance, and business results; comparison
with the company and other players will form the
performance scale of the variables.
4.2 Variables of Digital Presence
To address the second question: “Which variables of
the digital presence affect the business results most?”,
we accessed the performance data of banks on the site
of the Brazilian Central Bank . We collected data
about 10 business results indicators. After interviews
with bank executives, we seleceted 3 indicators:
B1 - Net profit: the net profit generated by all
banking operations.
B2 - Total assets: the size of a bank is usually
associated with the total assets managed
(Exame.com, 2014).
B3 - Total deposits: representing the funding
capacity of the bank;
This set of bank results indicators are defined as
the independent variables in the multivariate analyses
(Johnson and Wichern, 2002).
The dependent variables came from the
workshops with marketing executives and consulting
of online researchers as ComScore, Social Bakers,
and Google Trends. ComScore is a market research
that follows almost 150 thousand internet users in
Brazil to monitor websites audience behavior and
media investment. Social Bakers is a global
monitoring company that collects data on social
media for a diversity of industries. Google Trends is
the tool to monitor trends in terms searched on
Google. As Google does not provide absolute
numbers about the searches in its engine, it is
necessary to compare the companies to know which
one is the top of mind for users of Google Searches.
We selected metrics we could compare with all
institutions in order to calculate the performance ratio
of the players (1).
Regarding paid media, two variables that were
included in the model came from ComScore:
V1 – Media Investment: the amount of
investment in online media.
V2 – Media impressions: the number of times
the bank ads appeared to internet users.
We considered 4 variables (V3 to V6) to owned
channels because of the complexity of this kind of
media. The variables represent owned presence in
websites and social media. The reports of audience of
ComScore offered 22 metrics about the website
audience, although, we selected 2 representative ones
in order not to overestimate the role of site audience
in the model:
V3 – Average visits per month: the total of
visits (sessions) on the website per month.
V4 – Average visits per visitor: the number of
visits per unique visitor, it is a hint of usability,
because the user returned to the site.
We did not find any metrics about mobile
applications use in Brazil; however, the executives
consider important to measure the user behavior on
mobile apps.
The owned presence in social media was
represented by two variables, the number of followers
in Twitter, and the number of fans on Facebook page,
both measured by Social Bakers. We selected these
two social network sites because of their audience in
the Brazilian market:
V5 – Facebook likes: number of likes in the
company page. When the company had two or more
pages, we considered the pages with more
followers.
V6 – Twitter followers: the number of followers
of the company Twitter account. The same
procedure used for Facebook was used for Twitter
in the case of multiple accounts.
The marketing executives cited the
importance of the volume of buzz and the feelings
expressed in the posts. However, we did not include
these variables due to the difficulty in monitoring
them. Interviews with social media researchers
indicated that a reliable monitoring of the posts
would encompass the buying of an enormous
volume of data and a task force to classify the posts
by feeling. Considering the volume of posts for the
banking industry, almost 1 million per month, this
ICE-B2015-InternationalConferenceone-Business
82
monitoring was not possible for the scope of this
study. However, we included the variable searches
in Google to indicate the brand recall (Kaushik,
2012):
V7 – Searches in Google: the number of brand
searches performed in Google by internet users.
This variable may also be a proxy for the buzz,
because it can capture social phenomena with
precision, being used even to forecast 7 to 10 das
before conventional centers (Carneiro &
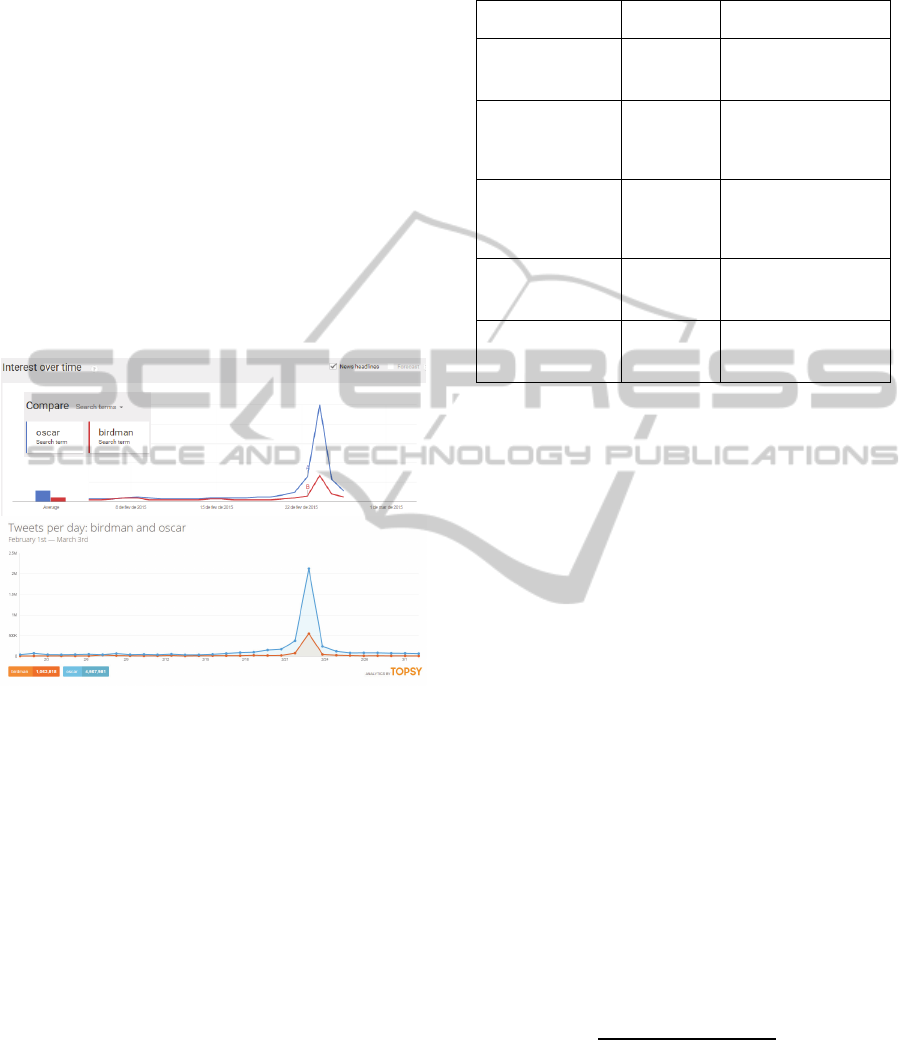
Mylonakis, . When some topic is broadly
commented on social media, the same trend can be
noted on Google. For example, comparing the
Oscar related terms, the Oscar 2015 winner
“Birdman”, and the term “Oscar” on google
searches and tweets (Topsy, 2015), we see similar
trends (Figure 1).
Figure 1: Google searchs monitored by Google Trends and
Tweets by Topsy for the terms “Birdman” and “Oscar”
We tracked these 7 variables for 9 months from
January 2014 to September 2014. Although we have
data from the entire 2014, the Brazilian Central Bank
provided data until the quarter closed on September
2014. Table 1 shows the way the data was collected
and consolidated, each variable has an specific
periodicity, points of measure, and aggregation. For
example, the number of visits is collected monthly
counting 9 points of measure from Jan/15 to Sep/15,
the average of these points is variable 3 – Average
number of visits per month. The Brazilian Central
Bank shows the results of the 50 largest banks, from
the original list we excluded the banks that had no
digital presence data or those that missed too many
data in the nine months. The final list contains 12
banks.
After data consolidation, we performed the
multivariate analyses using the SPSS software. We
used statistic descriptive analyses calculating the
Table 1: Summary of earned, owned and paid media
variables.
Variable Data source Consolidation
procedure
B1 Net Profit
B2 Total assets
B3 Total deposits
Central
Bank of
Brazil
Periodicity: quarterly
Points of measure: 3
Agregation: sum
V1 Media
Investment
V2 Media
impressions
ComScore Periodicity: monthly
Points of measure: 9
Agregation: sum
V3 Average visits
per month
V4 Visits per
visitor
ComScore Periodicity: monthly
Points of measure: 9
Agregation:Average
V5 Facebook likes
V6 Twitter
Followers
Social
Bakers
Periodicity: daily
Points of measure: 1
Agregation: None*
V7 Searches in
Google
Google
Trends
Periodicity: daily
Points of measure: 270
Agregation: Average
Bn (Independent variables)
Vn (Dependent variables)
* Registered only the last day of year representing the total of
likers/followers of the page/profile
correlation matrix. We also tried to produce a
regression analysis; however, we did not achieve
trustworthy results in the regression due to the limited
sample of 12 companies.
4.3 The Digital Presence Index (DPI)
To answer the third question “Is it possible to
consolidate these variables in a DPI representing the
competitive advantage of banks?”, we create an
equation to calculate the DPI. This equation combines
the performance of the bank in each variable (Pnx)
with the weight of the variable (Wn). We calculated
the bank performance for each variable using
equation 1. The weight of the variables is the average
of the correlations of the 3 business results variables.
The weights are balanced so that the DPI result varies
from 0 to 10 (equation 2). We learned with the
executives that an index from 0 to 10 is easier to
communicate, perhaps because of a similarity to a
school grade. Other advantage, by maintaining the
index within a range, it is easier to compare the
present result with a time series.
Pnx
Vnx
Max
Vn
Min
Vn
(1)
Pnx: Performance of variable n for bank x
Vnx: Value of variable n for bank x
Vn: Variable n
TheImpactofDigitalPresenceonCompetitiveAdvantage-AStudyAppliedtoBrazilianBankIndustry
83

DPIx
∑
10
∑
(2)
DPIx: Digital Presence Index of bank x
Wn: Average of the correlation of Vn to R1, R2, R3
Figure 2 summarizes the method to calculate the DPI.
For a better visualization of the competitive
advantage of a bank, we propose to plot the data in an
importance-performance matrix to exploit the
performance and relevance of each variable.
5 RESULTS
5.1 Multivariate Analyses
To validate the relationship between the digital
presence variables (Vn) and business results variables
(Bn), we considered the following assumptions for
the Pearson correlation test:
• Null hypotesis (H0): there is no correlation
between the variables.
• Alternative hypotesis (H1): there is a
significative correlation.
Figure 2: The DPI calculation.
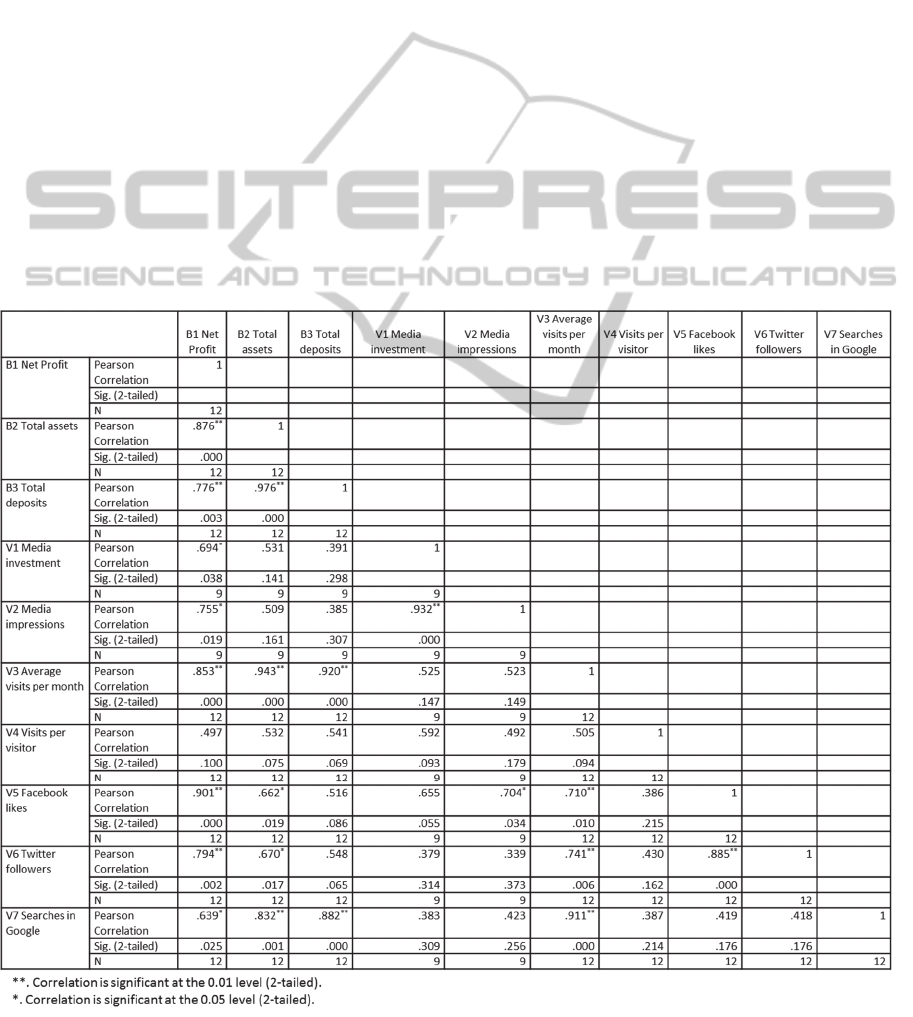
The Pearson correlation indicates strength and
direction of (positive or negative) of the correlation,
the correlation value can vary from -1 to 1. For
example, a correlation of 0,943 between V3 -
Average number of visits per month and the variable
B2 – Total Assests is very strong, because the value
is close to 1.
The Sig. (2-tailed) is the probability in which you
would see a correlation of this size just by chance. If
the Sig. (2-tailed) is less than 0.05, it means that the
correlation is significant at the 0.05 level. We
consider only correlations with Sig. (2-tailed) less
than 0.05, because smaller values indicates more
confidence.
The correlation matrix (table 2) shows the value
of the Pearson correlation and the Sig. (2-tailed) for
each pair of variables. The N value indicates the
considered sample with valid values.
The “B1 – Net Profit” variable correlates with all
the Digital Presence values with the exception of “V4
– Average number of visits per visitor”. It could
indicate that returns to the website could not be so
important to net profit. On the other hand, the
remaining 6 digital presence variables have a strong
relationship with profits indicating the digital
presence is crucial for the net profit in every channel:
paid, owned and earned. “V5 – Facebook likes”
represents the strongest relationship (0.901), altought
it is considered by literature as an owned channel
(Corcoran, 2009), the Facebook likes may indicate a
good brand reputation as the user demonstrates his
appreciation by liking the Facebook brand page. “V3
- Average number of visits” has the second highest
correlation (0.853), indicating that high audience is
important for business. “V6 – Twitter followers” has
the third highest correlation (0.794), maybe by the
same reasons of the correlation of “V5 – Facebook
likes” because the variables are very similar. “V2 –
Media impressions” has a correlation of 0.782,
problably because campaign efforts bring more visits,
and more visits are correlated with more profits. “V1
Media Investment” and “V7 Searches on Google”
have high correlations, but not at the same level of the
variables mentioned before.
Variables “B2 – Total Assets” and “B3 - Total
Deposits” have a strong relationship with “V3 –
Average visits” as expected beause a large audience
means more operations and consequently more
deposits, more assets and more profits. However, the
correlations of “V7 – Searches on Google” with B2
and B3 (0.832 and 0.882) are slightly different from
the correlation from V7 to “B1 – Net Profit” (0.639).
It could mean that brand recall on Google (Kaushik,
2012) is very relevant for new businesses (total
deposits) and consequently for total assets, as B2 and
B3 are closely correlated (0.976).
5.2 DPI Calculation
As exposed in the methodology, the next step is the
DPI calculation. The DPI is based on the weight and
performance of each variable. The weight is
ICE-B2015-InternationalConferenceone-Business
84
proportional to the variables correlation with business
results (table 2). The bank performance is comparable
to the performance of its competitors.
The DPI demonstrates the ranking of the digital
presence of banks with grades from 0 to 10. Each
grade is detailed in the 7 variables that measure the
digital presence . The colors expose the performance
of the banks and ease the visualization of a
comparative picture (figure 3).
Itaú is the first bank in digital presence followed
closely by Bradesco. Caixa, Banco do Brasil and
Santander compose an intermediary set. The other
banks had DPI’s lower than 1. This classification
illustrates the concentrated competitive scenario of
Brazilian banks.
The DPI can be updated every month because
some variables have monthly consolidation (table 1).
The dynamic process of monitoring and continuous
improvement of digital variables can contribute to
competitive advantage.
5.3 The Importance-performance
Matrix
In order to produce a clear picture of the DPI
contribution to competitive advantage we used the
classic reference of the importance-performance
matrix used in relavant fields as marketing (Martilla
and James, 1977) and operations management (Slack,
1994).The matrix explores the DPI of each bank,
presenting the importance of each variable and the
performance based on a comparative evaluation.
To illustrate the matrix application, we used the
example of “Caixa Econômica Federal”, a
government bank simply referred to as Caixa. The
majority of variables are on the urgent actions region
(figure 4). Variables related to social media followers
and likers (v5 and V6) are important and low
performance, so are the variables related to
campaigns (V1 and V2); it suggests improvements in
social media management and the necessity of best
investments in paid media. On the other extreme, “V3
Table 2: The correlation matrix of digital variables and business results.
TheImpactofDigitalPresenceonCompetitiveAdvantage-AStudyAppliedtoBrazilianBankIndustry
85
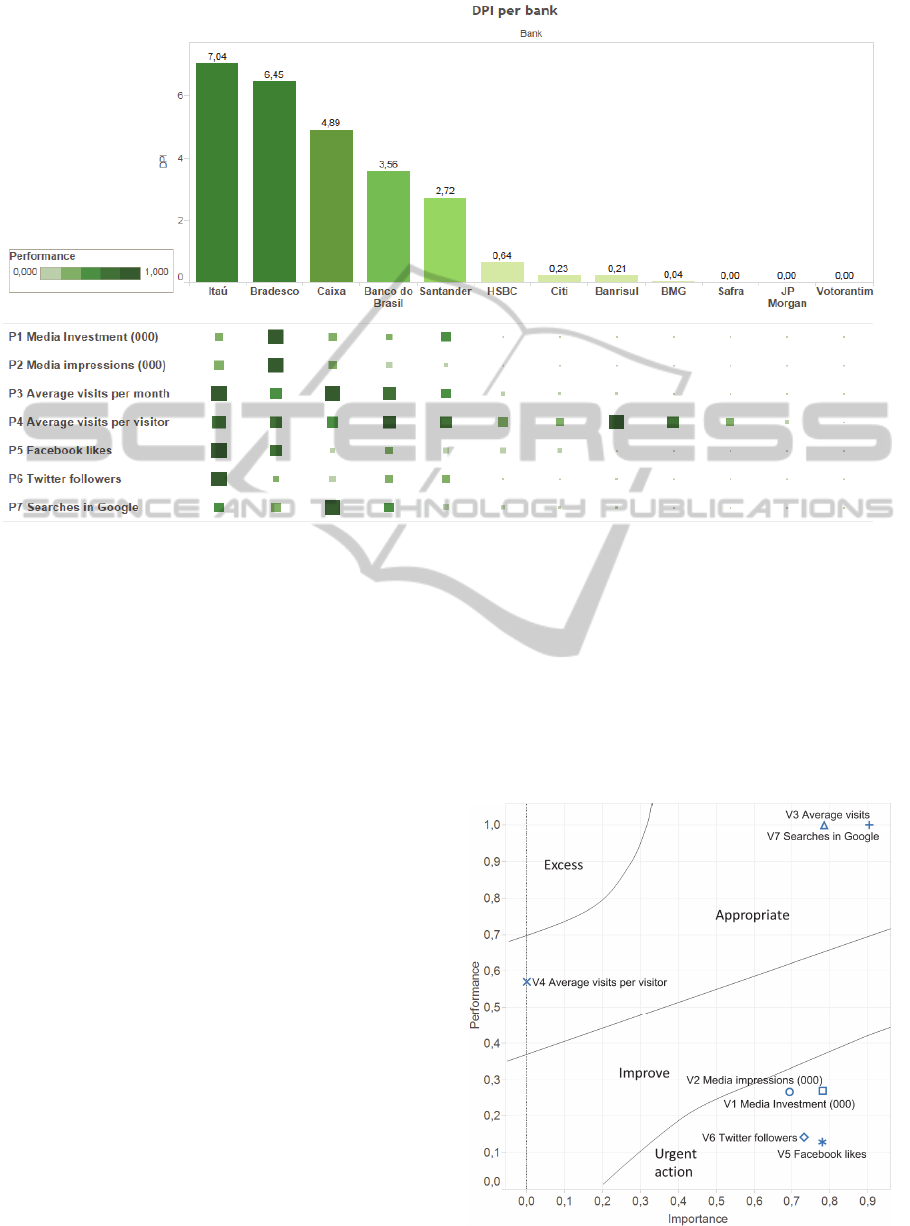
Figure 3: The DPI ranking of Brazilian banks.
Average visits” and “V7 Searches on Google” are in
the appropriate area, because these are important
high-performance variables comparable to the other
banks. However, the performance of “V4 Average
number of visits per visitor” is not so good, it is also
plotted in the appropriate region because of its low
importance to the DPI model; actually, the correlation
of this variable with business results has a low level
of confidence. As we can see, the matrix can be used
as a practical tool to help executives in the decision-
making process to improve the digital presence.
6 CONCLUSIONS
The DPI was calculated based on two factors: (i) the
correlations of each variable to business results
(Table 2); (ii) the performance of each company
compared to the other players.
The high correlations observed were expected due
to previous studies (Westerman et al. 2012; Pauwels
et al. 2012). The impact of digital presence on
business results is especially noted on banking
because of the high digital maturity of this market
(Westerman et al. 2012).
However, these results must be observed with
caution because only one industry was analysed
encompassing 12 companies. We intend to develop
further studies including other industries to reach
more consistent results, preferable, industries
combining large, medium and small companies, to
observe the importance of digital variables in
different sizes of business. The data collection must
be broadened to include buzz monitoring and other
social media sites like youtube and Instagram. Some
procedures must also be implemented to avoid
counting fake users of social media.
Figure 4: The importance-performance matrix.
ICE-B2015-InternationalConferenceone-Business
86

Although the necessary improvements, the study
verified the possibility to calculate a Digital
Performance Index for the banking industry. It is a
contribution to the decision-making process because
consolidate the diversity of variables in a unified
index. On the other hand, the DPI shows the perform
of each variable comparatively to competitors.
Complementary, the importance-matrix (figure 4)
showed a clear vision of the digital variables that must
be prioritized.
ACKNOWLEDGEMENTS
We thank the Center for Higher Studies of ESPM
(CAEPM) for sponsoring this research.
REFERENCES
Carneiro, H. A.; Mylonakis, E. Google Trends: A Web-
Based Tool for Real-Time Surveillance of Disease
Outbreaks. Clinical Infectious Diseases, V.49, No. 10,
pp. 1557-1564.
ComScore, 2014. 2014 Future Digital in Focus. Available
at http://pt.slideshare.net/jacquelinee/2014-brazil-
digitalfutureinfocuspt, accessed: Mar, 01, 2015.
Corcoran, S. 2009. Defining Earned, Owned and Paid
Media. Forrester Blog. Available at
http://blogs.forrester.com/interactive_marketing/2009/
12/defining-earned-owned-and-paid-media.html,
accessed: Jan, 13, 2015.
Davenport, T. H.; Harris, J. G. 2007, Competing on
Analytics: the new science of winning. Harvard
Business School Press. Boston, 1
st
edition.
Exame 2014. Os 50 maiores bancos do Brasil em 2013,
Exame.com. Available at http://exame.abril.com.br/
revista-exame/noticias/os-50-maiores-bancos-brasil-
em-2013, accessed: Jan, 12, 2015.
Febraban, 2014. Pesquisa FEBRABAN de Tecnologia
Bancária 2013. Available at
http://www.febraban.org.br/7Rof7SWg6qmyvwJcFwF
7I0aSDf9jyV/sitefebraban/RPSP-6021-
14%20FEBRABAN_Pesquisa%20Tecnologia%20Ban
c%E1ria_2013%207.5.2014_vf.pdf, accessed: Jan, 12,
2015.
Goes, P. B. 2014. Big Data and IS Research, MIS Quarterly,
(38:3), pp. 3-8.
Haj-Bolouri, A.; Flensburg, P.; Svensson, L. 2014,
Conceptualizing the Essence of Presence in Distance
Education through Digital Dasein. Proceedings of E-
Learn 2014, New Orleans. Available at
http://www.editlib.org/p/148904/proceeding_148904.p
df/. Accessed: Jan, 13, 2015.
Harrison, F. 2013. Digging deeper down into the empirical
generalization of brand recall: adding and Earned
Media to Paid-Media Touchpoints. Journal of
Advertising Research, Jun., pp.181-185.
Ibope, 2014. Categorias – 30 maiores – 1º semestre.
Available at http://www.ibope.com.br/pt-
br/conhecimento/TabelasMidia/investimentopublicitari
o/ Paginas/CATEGORIAS---30-MAIORES---1%C2%
BA-SEMESTRE-2014.aspx, accessed: Jan, 13, 2015.
Johnson, R. A., Wichern, D.W. 2002. Applied Multivariate
Statistical Analysis, Prentice Hall, New Jersey.
Kaushik, A. 2007. Web Analytics: An Hour a Day. Wiley
Publishing, Indianopolis, 1
st
edition.
Kaushik, A. 2012. Excellent Analytics Tip #20: Measuring
Digital "Brand Strength", available at.
http://www.kaushik.net/avinash/analytics-measuring-
digital-brand-strength/, accessed in Mar, 03, 2015.
Krombholz, k.; Merkl, D.; Weippl, E. 2012. Fake identities
in social media: A case study on the sustainability of the
Facebook business model. Journal of Service Science
Research, V.4, No.2, pp. 175-212.
Martilla, J.A.; James, C.J. 1977. Importance-Performance
Analysis. Journal of Marketing, V. 41, No. 1 Jan., pp.
77-79.
Pauwels, K.; Srinivasan, S.; Rutz, O.; Bucklin, R. 2012. The
Hierarchy of Effects HOE Meets Paid, Earned, and
Owned POE: How Do Internet Media Work to Drive
Brand Sales?, Working Paper, Boston University.
Available at http://pages.stern.nyu.edu/~atakos/
MMP2P/presentations/ssrinivasan.pdf in Jan, 1th,
2015.
Porter, M., 2001, Strategy and the Internet. Harvard
Business Review, (79:3), pp.63-78.
Slack, N. 1994. The importance-performance matrix as a
determinant of improvement priority. International
Journal of Operations and Production Management,
(14:5), 59–75.
Topsy, 2015. Search and Analyze the Social Web. Available
at http://topsy.com/, accessed: Mar, 03, 2015.
Thibeault, J. 2012. What is a digital presence? In the
limelight blog. Available at http://blog.limelight.com/
2012/07/what-is-a-digital-presence, accessed: Jan, 13,
2015.
Westerman, G,; Tannou, M.; Bonnet; D.; Ferraris, P., 2012;
McAfee, A. The Digital Advantage: How digital
leaders outperform their peers in every industry.
Capegimi.com. Available at https://www.capgemini.
com/resource-file-access/ resource/ pdf/ The_Digital_
Advantage__How_Digital_Leaders_Outperform_their
_Peers_in_Every_Industry.pdf, accessed: Mai, 26,
2015.
TheImpactofDigitalPresenceonCompetitiveAdvantage-AStudyAppliedtoBrazilianBankIndustry
87
