
Implementing an Agent-based Model with a Spatial Visual Display in
Discrete-event Simulation Software
Andrew Greasley and Chris Owen
Operations and Information Management Group, Aston University, Birmingham, U.K.
Keywords: Discrete-event, Agent-based, Spatial.
Abstract: There has been an increasing interest in the use of agent-based simulation and some discussion of the relative
merits of this approach as compared to discrete-event simulation. There are differing views on whether an
agent-based simulation offers capabilities that discrete-event cannot provide or whether all agent-based
applications can at least in theory be undertaken using a discrete-event approach. This paper presents a simple
agent-based NetLogo model and corresponding discrete-event versions implemented in the widely used
ARENA software. The two versions of the discrete-event model presented use a traditional process flow
approach normally adopted in discrete-event simulation software and also an agent-based approach to the
model build. In addition a real-time spatial visual display facility is provided using a spreadsheet platform
controlled by VBA code embedded within the ARENA model. Initial findings from this investigation are that
discrete-event simulation can indeed be used to implement agent-based models and with suitable integration
elements such as VBA provide the spatial displays associated with agent-based software.
1 INTRODUCTION
In order to provide a context for the investigation
there follows a brief overview of the three main
simulation approaches, namely System Dynamics
(SD), Discrete Event Simulation (DES) and Agent
Based Modelling (ABM). The following section will
also cover an as assessment of the differences in their
application and user bases.
System Dynamics is a continuous modelling
technique which was originally develop by Professor
Jay Forrester, (Forrester, 1958, 1961), when it was
known as ‘Industrial Dynamics’. In System
Dynamics models, stocks of variables are connected
together via flows. System Dynamics has been used
extensively in a wide range of application areas, for
example economics, supply chain, ecology and
population dynamics to name a few. In relation to this
paper, it is interesting to note that System Dynamics
has a limitation in relation to spatial simulation, since
the movement of individual entities cannot be
illustrated. System Dynamics has a well-developed
methodology as outlined by Sterman (2000), in that
the main stages and phases of the construction of a
model are defined.
Discrete Event Simulation began in the 1950s
with the development of early computers. The
method evolved in parallel with the development of
early computing (Tocher, 1963). DES takes a process
view of the world and individual entities can be
represented as they move between different
workstations and are processed or wait in queues. It
is hard to estimate the number of global users of DES,
but there is little doubt that of the three methods
outlined here, DES has the largest user base.
Evidence for this is provided by the biannual
simulation survey (Swain, 2013) carried out by
OR/MS Today of 43 software products and 23
vendors. This survey demonstrates the wide range of
applications for which DES has been used. In this
most recent survey, the main areas of application
noted are manufacturing, supply chain and logistics,
military, emergency logistics and more recently,
healthcare.
The use of agents in the design of simulation
models has its origins in complexity science (Phelan,
2001) and game theory (Axelrod, 1997). Agent based
modelling lacks a consistent set of definitions for key
concepts such as what an agent actually is, as well as
a philosophy of application (Borshchev and Fillipov,
2004; Schieritz and Milling, 2003). This may reflect
the relative immaturity of this field when compared
with SD and DES. Agent based modelling differs
from both SD and DES in the philosophy of
application. With ABM, the researcher is interested in
studying the behaviour of agents bottom up. What this
125
Greasley A. and Owen C..
Implementing an Agent-based Model with a Spatial Visual Display in Discrete-event Simulation Software.
DOI: 10.5220/0005531601250129
In Proceedings of the 5th International Conference on Simulation and Modeling Methodologies, Technologies and Applications (SIMULTECH-2015),
pages 125-129
ISBN: 978-989-758-120-5
Copyright
c
2015 SCITEPRESS (Science and Technology Publications, Lda.)
means is that agent behaviours are defined, and then
the agents are released into the environment of study.
The behaviour of the agents then emerges as a
consequence of their interaction. In this sense, the
system behaviour is an emergent property of the agent
interactions. ABM has been applied across a wide
areas for example, economics, human behaviour,
supply chain, emergency evacuation, transport and
healthcare (Axelrod, 1997).
The three different methods have their own
philosophies, communities, conferences and main
areas of application. DES has typically been applied
heavily in manufacturing and process type areas and
services. Its process orientation means that it is a
natural fit for people interested in process
improvement and optimisation. On the other hand,
ABM has emerged from the behavioural science and
social sciences and therefore the domain of
application has been more in that area.
With the arrival of ABM, a number of claims have
been made on its behalf, most importantly perhaps is
the idea that there are problems for which ABM is a
more suitable approach. This class of problems is
defined by Charles Macal in (North and Macal,
2007). At the 2010 OR Simulation Workshop a
debate was held on the relative merits of ABM and
DES (Siebers et al., 2010). Following this debate, a
challenge to this idea was put forward suggesting that
in fact DES is capable of modelling most, if not all
the problems tackled by ABM (Brailsford, 2014).
The gap in the current research is that little
empirical work has been done to directly compare
DES and ABM in relation to the specific claims made
on behalf of ABM. The aim of this research is to more
precisely test whether it is indeed possible to model
ABM type problems using DES. This is an important
question since, as discussed earlier, there is a large
installed base of DES users and it may be difficult for
these users to adopt a completely new approach to
simulation. It may be more efficient and effective to
provide more capability and guidance within the
existing DES software to allow users to tackle these
problems.
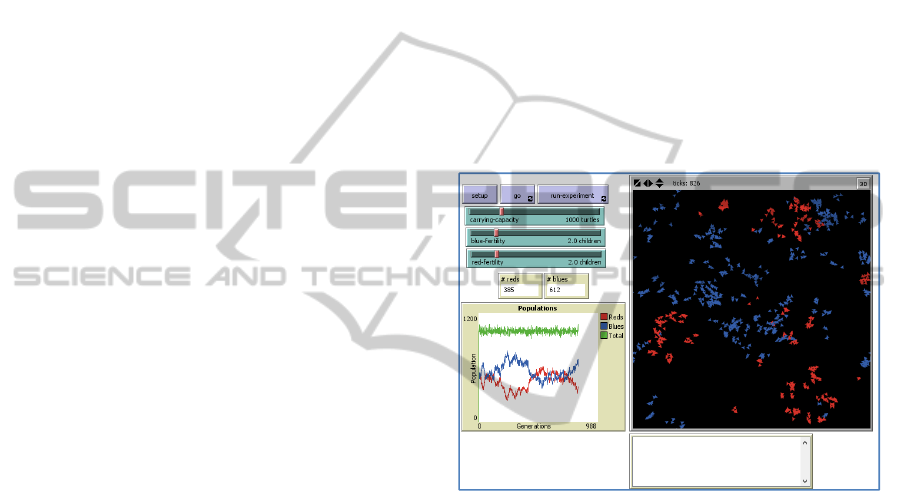
2 THE CASE STUDY
In order to investigate the feasibility of implementing
agent-based systems using discrete-event software a
simple agent-based model “Simple Birth Rates”
(Wilensky, 1997) was taken from the NetLogo
software (Wilensky, 1999) library. The model
simulates population genetics with two populations of
red turtles and blue turtles. Each type of turtle has its
own fertility and reproduces according to these birth
rates. There is a limit to the population set by the
carrying capacity of the ‘terrain’ in which they are set
and some agents will die if this population limit is
exceeded. The model is used to show how
differential birth rates can affect the ratio of red and
blue turtles. After setup the code contains two main
procedures for reproducing and killing turtle agents.
The reproduce procedure interrogates each turtle
agent and generates new turtles depending on the
current turtle’s fertility. The kill procedure destroys
turtles if the population has reached the carrying
capacity as set within the model. The NetLogo model
display is shown in figure 1. This incorporates buttons
and sliders for setting up the simulation experiments,
a time-based graph of turtle population and a spatial
visual display of the turtle agents.
Figure 1: The Netlogo simulation display.
To establish if the simple birth rates model can be
implemented in discrete-event simulation an
equivalent model was written using the ARENA
discrete-event simulation software (Kelton et al.,
2014) to test the feasibility of this approach. The
ARENA model is shown in figure 2.
To implement the turtle model requires only a
simple ARENA model. Blue and red turtles are
created at the beginning of the model and then two
sections of code implement the ‘reproduce’ and ‘kill’
procedures. The reproduce procedure generates new
turtles depending on a probability held in the fertility
variable set for red and blue turtles. The kill
procedure destroys red and blue turtles depending on
the capacity of the turtle population. Information on
each turtle such as its colour is held as an attribute
value which is a variable that is associated with each
turtle entity. A graph was used in ARENA to show
the change in red and blue turtle population over time
but no spatial representation of the turtles could be
SIMULTECH2015-5thInternationalConferenceonSimulationandModelingMethodologies,Technologiesand
Applications
126
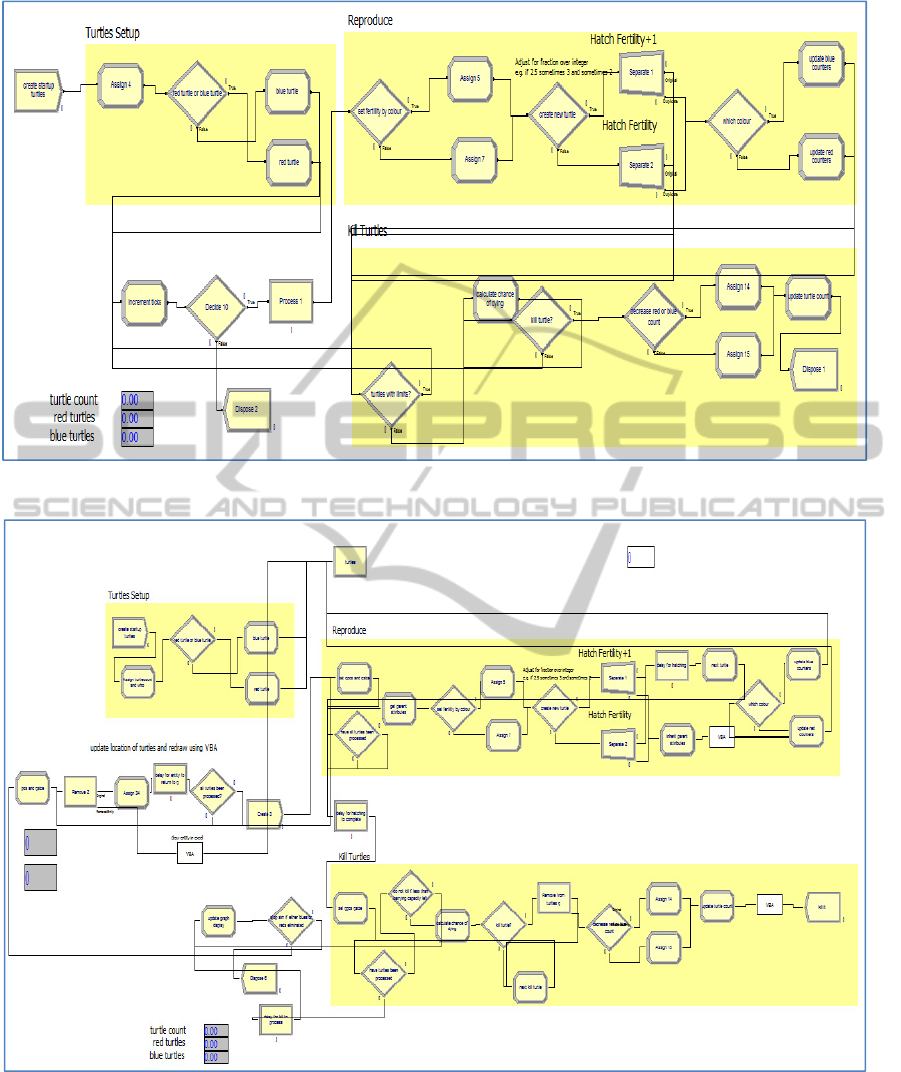
Figure 2: The ARENA turtle model using a process flow approach.
Figure 3: ARENA turtle model using agent-based approach.
provided using the ARENA vector graphics.
The next stage of the investigation was to develop
a model using ARENA but using an object/agent
based approach and to provide a spatial display of
turtle movement. Because of the limitations of the
ARENA graphics capability this was implemented
using the Visual Basic for Applications (VBA)
facilities packaged within the ARENA software. The
VBA was used to provide a real-time spatial display
of turtle movement in the Microsoft Excel
ImplementinganAgent-basedModelwithaSpatialVisualDisplayinDiscrete-eventSimulationSoftware
127
spreadsheet application. The Excel spreadsheet was
chosen for the display because each spreadsheet cell
set at an appropriate zoom level could be used to hold
the location of a turtle object. Also the ability to
execute VBA code to control Excel from within
ARENA allowed a real-time display of turtle
movement as the simulation is running. The agent-
based version of the ARENA model is shown in
figure 3.
This version of the ARENA model generates an
initial population of red and blue turtles and then
holds them in a queue for further processing. This is
intended to mimic the internal mechanism of agent-
based software where functions interrogate an object,
rather than the traditional discrete-event approach of
an entity moving through a process flow. The
ARENA program blocks are executed by a dummy
entity which follows the process flow to generate and
kill turtle agents as required. The ‘reproduce’
procedure examines the attributes of each turtle in the
queue in turn and generates new turtles based upon
parent turtle properties. The ‘kill’ procedure destroys
red and blue turtles depending on the turtle population
by removing them from the queue.
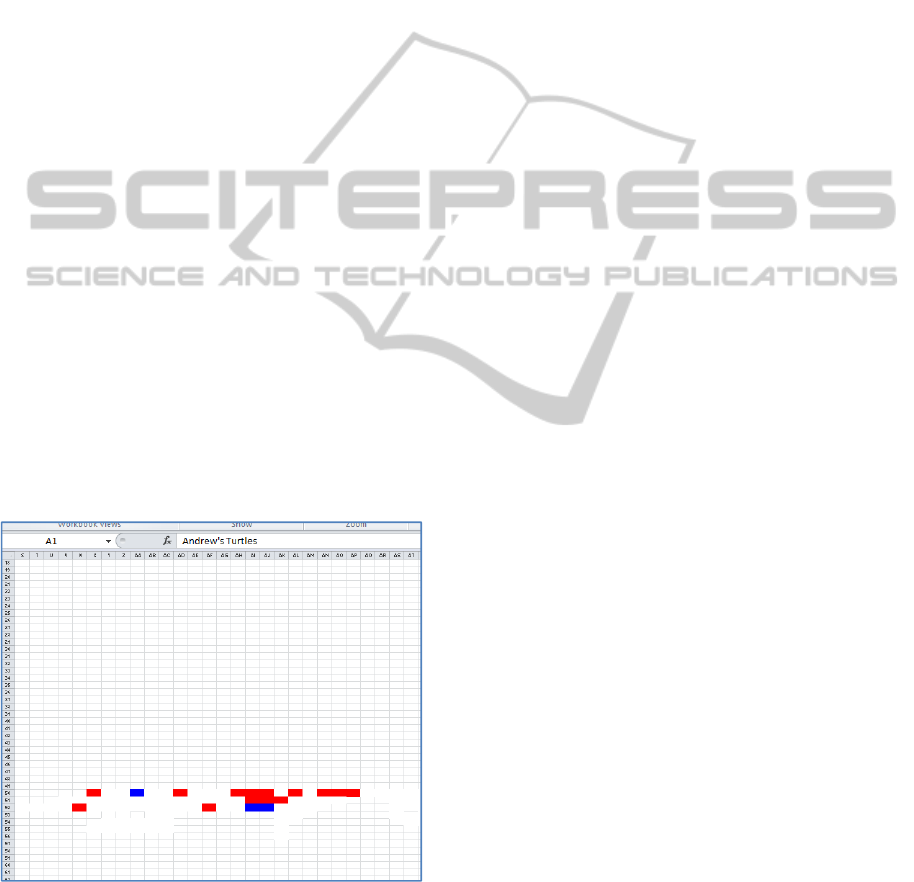
The next step was to provide a spatial visual
display of the turtle population as the simulation is
running. Currently model results are provided using
counters of red and blue turtle numbers and a time-
based graph showing turtle population change over
time. VBA code embedded within the ARENA model
was used to implement the spatial visual display in a
Excel spreadsheet (figure 4).
Figure 4: Spatial Display of Turtles in Excel.
A VBA routine at the start of the simulation run opens
the Excel application and sets the spreadsheet zoom
level at an appropriate level for the display. During
each cycle of the simulation a VBA routine is
executed from ARENA that retrieves the current
turtle object attributes from the ARENA model. The
attributes consist of elements such as turtle spatial
location, turtle colour and turtle direction of travel.
The code then removes the turtle displayed at its
current location, updates the turtle location and
redraws the turtle at its new location. Finally the
updated turtle attributes are copied back into the
ARENA turtle entity. Currently the display shows the
turtle as either a red or blue cell in the spreadsheet but
the coding is being developed to present the turtle as
an icon within each cell with an indication of its
current direction of travel. This would mimic the
features of the Netlogo display shown in figure 1.
3 DISCUSSION
The models presented represent an initial
investigation into the feasibility of incorporating an
agent-based approach into a discrete-event
simulation. Although a number of agent-based
software applications exist such as Netlogo and even
applications that create agent-based and discrete-
event type models (e.g. Anylogic) the barriers to
current discrete-event simulation users are substantial
in terms of the effort needed to become proficient in
these software applications. It may be that many
applications are developed in an approach that aligns
with the modellers’ background and expertise.
However one area where DES systems do seem to be
lacking in comparison with ABS software is in the
provision of spatial visual display facilities. This
ability to observe patterns and behaviours in this way
forms an important aspect of the analysis of the
performance of agent-based models. Observed
patterns provide valuable information about systems
and the processes operating them and, when used with
care, can act as filters in the design and evaluation of
simulation models (O’Sullivan and Perry, 2013). In
order to provide a spatial visual facility a spreadsheet
based display is presented using VBA coding
embedded in the ARENA model.
4 CONCLUSIONS
This paper has provided an indication that discrete-
event based systems could indeed be used to develop
agent-based models. These results are relevant
because implementing an agent-based model on a
discrete-event simulation software platform provides
SIMULTECH2015-5thInternationalConferenceonSimulationandModelingMethodologies,Technologiesand
Applications
128

a potential pathway for the established and very wide
base of discrete-event simulation practitioners to
develop agent-based models. However the facilitation
of this process will require discrete-event simulation
software providers to develop training materials in
agent-based model building and software modules
providing better integration of spatial visual displays.
REFERENCES
Axelrod, R., 1997. The Complexity of Cooperation.
Princeton University Press, Princeton.
Borshchev, A., Fillipov, A., 2004. From System Dynamics
and Discrete Event to Practical Agent Based Modelling:
Reasons, Techniques, Tools, Proceedings of the 22nd
International Conference of the System Dynamics
Society, Oxford, UK.
Brailsford, S., 2014. Discrete-event simulation is alive and
kicking! J of Sim 8, 1-8.
Forrester, J., 1958. Industrial Dynamics: A Major
Breakthrough for Decision Makers. Harvard Business
Review 36, 37-66.
Forrester, J., 1961. Industrial Dynamics. MIT Press.
North, M., Macal, C., 2007. Managing Business
Complexity. Oxford University Press.
Kelton, W. D, Sadowski, R. P and Zupick, N. B (2014)
Simulation with ARENA, Sixth Edition, McGraw-Hill:
Maidenhead.
O’Sullivan, D. and Perry, G. L. W. (2013) Spatial
Simulation: Exploring Pattern and Process, Wiley-
Blackwell, Chicester.
Phelan, S., 2001. What is complexity science really?
Emergence 3, 17.
Schieritz, N., Milling, P., 2003. Modelling the forest or
modelling the trees, A comparison of System Dynamics
and Agent Based Simulation, International Conference
of the System Dynamics Society, New York.
Siebers, P. O., Macal, C. M., Garnett, J. Buxton, D. and
Pidd, M. (2010) Discrete-event simulation is dead, long
live agent-based simulation!, Journal of Simulation, 4,
204-210.
Sterman, J., 2000. Business Dynamics. McGraw-Hill.
Swain, J., 2013. Simulation Software Survey - Simulation:
a better reality? Operations Research and Management
Science 40.
Tocher, K. D., 1963. The Art of Simulation. English
Universities Press, London, UK.
Wilensky, U. (1997) NetLogo Simple Birth Rates Model.
http://ccl.northwestern.edu/netlogo/models/SimpleBirt
hRates Center for Connected Learning and Computer-
Based Modelling, Northwestern University, Evanston,
IL.
Wilensky, U. (1999) NetLogo http://ccl.northwestern.edu/
netlogo/ Center for Connected Learning and Computer-
Based Modelling, Northwestern University, Evanston,
IL.
ImplementinganAgent-basedModelwithaSpatialVisualDisplayinDiscrete-eventSimulationSoftware
129
