
A First Framework for Mutually Enhancing Chorem
and Spatial OLAP Systems
Sandro Bimonte
1
, François Johany
2
and Sylvie Lardon
2
1
Irstea, TSCF, Aubiere, France
2
INRA, UMR Métafort, Aubiere, France
Keywords: Spatial OLAP, Geovisualization, Chorems, Spatial Data Warehouse.
Abstract: Spatial OLAP systems aim to interactively analyze huge volumes of geo-referenced data. They allow
decision-makers to on-line explore and visualize warehoused spatial using pivot tables, graphical displays
and interactive maps. On the other hand, it has been recently shown that chorem maps represent an excellent
geovisualzation technique to summarize spatial phenomena. Therefore, in this paper we introduce a
framework being capable to merge the interactive analysis capability of SOLAP systems and the potentiality
of a chorem-based visual notation in terms of visual summary. We also propose a general architecture based
on standards to automatically extract and visualize chorems from SDWs according to our framework.
1 INTRODUCTION
Spatial On-Line Analytical Processing (SOLAP)
systems allow on-line analyzing huge volume of
spatial data to provide numerical indicators
according to some analysis axes (Bédard et al.,
2006). SOLAP has been sucessufylly applied in
several application domains such as health,
agriculture, etc. SOLAP systems integrate
Geographic Information Systems (GIS)
functionalities with OLAP systems to provide a
cartographic visualization of these indicators
(Bédard et al., 2006). Decision-makers trigger
SOLAP operators by the simple interaction with
visual components of SOLAP clients (pivot tables,
graphical and cartographic displays). Therefore, they
can easily and interactively explore geo-referenced
data set looking for unknown and/or unexpected
patterns and/or confirm their decisional hypothesis
on some spatial phenomena. The success of SOLAP
rests on the visual analytic paradigm “Analyze First
- Show the Important - Zoom, Filter, Analyze
Further - Details on Demand” (Keim et al., 2006),
and its adaptation to geographic information, the so
called Geovisualization. Geovisualization integrates
the techniques of scientific visualization,
cartography, image analysis, and data mining to
provide a theory of methods and tools for the
representation and discovery of spatial knowledge
(MacEachren et al., 2004). Geovisualization
analytics tasks are performed using SOLAP
operators (Slice and Dice, Roll-up and Drill-down)
whose results are displayed in interactive thematic
maps. However, a part from thematic maps, SOLAP
systems lack of advanced Geovisualization
techniques as described in (Bimonte, 2014). In
particular, summarizing information (i.e. Zoom
visual analytic task) is reduced to aggregation of
measures values using SQL aggregation functions of
Roll-Up operator (e.g. SUM, MIN, MAX), but no
additional visual summary is provided.
Consequently, sometimes SOLAP cartographic
displays are not well adapted to complex spatial
phenomena, which need several or temporal
indicators leading to useless and/or clutterd maps
(Silva et al., 2012).
Per contra, recent results have demonstrated that
chorems can be used to both catch a thematic global
view of a territory and its phenomena (De Chiara et
al., 2011) (Del Fatto et al., 2008), and investigate
complex spatial phenomena by accessing data
characterizing them. A chorem is a schematized
spatial representation, which eliminates any detail
unnecessary to the map comprehension (Brunet,
1986). The main limitation of these approaches is
that chorem map extraction cannot be done on-
demand according to spatial decision-makers needs.
This limits the potentiality of the spatial decision-
making process, since, as stated in (MacEachren et
al., 2004), high interactivity exploration and analysis
38
Bimonte S., Johany F. and Lardon S..
A First Framework for Mutually Enhancing Chorem and Spatial OLAP Systems.
DOI: 10.5220/0005515200380048
In Proceedings of 4th International Conference on Data Management Technologies and Applications (DATA-2015), pages 38-48
ISBN: 978-989-758-103-8
Copyright
c
2015 SCITEPRESS (Science and Technology Publications, Lda.)

are mandatory when dealing with complex and
unknown datasets.
In this paper we carry out our aim of supporting
users’ tasks through advanced solutions and systems,
and describe how chorems can be used to perform
on-line analysis through a simple and immediate
approach that exploits analysis capabilities of
SOLAP systems. On this basis, in this paper we
propose a unique framework, called ChoremOLAP,
that, starting from warehoused spatial datasets, is
able to on-line produce and visualize chorem maps
exploiting the functionalities of SOLAP systems.
The paper is organized as follows. Section 2
recalls some basic notions about SOLAP systems
and chorems, detailing related work. Section 3
present a real case study. The ChoremOLAP system
is described in Section 4. Section 5 presents a
discussion of our proposal. Conclusions and future
work are drawn in Section 6.
2 RELATED WORK
Data warehouses (DW) and OLAP systems are
Business Intelligence technologies aim to support
on-line analysis of huge amounts of data.
Warehoused data are structured according the so-
called multidimensional model, which represents
data according to different analysis axes
(dimensions) and facts (Inmon, 1992). Dimensions
are composed of hierarchies, which define groups
for data (members) used as analysis axes. Facts
represent the subjects of analysis, and they are
described by numerical measures, which are
analysed at different granularities associated to the
levels of hierarchies. Decision-makers can aggregate
measures at coarser hierarchy levels using classical
SQL aggregation functions (AVG, SUM, MIN,
MAX, COUNT). OLAP operators are defined to
explore warehoused data. Classical OLAP operator
are: Slice which selects of a part of the data
warehouse, Dice which projects a dimension,
RollUp which aggregates measures climbing on a
dimension hierarchy, and DrillDown, which is the
reverse of RollUp.
Since OLAP systems do not allow to integrate
spatial data into the analysis and exploration
process, Spatial OLAP (SOLAP) systems have been
introduced (Bédard et al., 2006). SOLAP systems
integrate OLAP and Geographic Information System
functionalities in a unique framework to take
advantage from the analysis capabilities associated
to spatial data. SOLAP redefines main OLAP
concepts. In particular, the integration of spatial data
in OLAP dimensions brings to the definition of
spatial dimension: non geometric dimension, spatial
geometric dimension (i.e. members with a
cartographic representation) or mixed spatial
dimension (i.e. combine cartographic and textual
members). When the studied subject of the decision
process is the spatial information itself, then the
concept of spatial measures are introduced. A
SOLAP system allows visualizing results of SOLAP
queries using interactive tabular and map displays.
Few works investigate using advanced
geovisualization methods (such as Space-Time
cubes, geobrowser) for SOLAP (a survey can be
found in (Bimonte, 2014)). Indeed, existing SOLAP
tools are limited to classical GIS visualization maps
such as chloropleth and thematic maps.
In the last few years, much work has been done
on the chorem concept and on its exploitation as an
appealing visual notation to convey information
about phenomena occurring in specific application
domains, such as land use and territorial
management. The term chorem derives from the Old
Greek word χώρα (read chora). According to the
definition of the French geographer Roger Brunet
(Brunet, 1986), a chorem is a schematized spatial
representation, which eliminates any unnecessary
details to the map comprehension. A chorem is a
synthetic global view of data of interest which
emphasizes salient aspects. Figure 1 shows an
example of a chorem map, which contains chorems
referring to the environmental dynamics of the area
around the city of Poitiers, France.
This map results from a participatory process
with agents of DREAL Poitou-Charentes (regional
office of the environment) (Lebourg M-N, et al.,
2014). They handy draw all the information needed
using a Geographic Information System. Then, they
simplify the geometries of the map using the GIS
functionalities according an adapted semiotic. This
chorem map shows the predominance of transport
corridors in the organization of the territory, the
urban continuity and the expansion of the cities.
Moreover, chorems show the interaction between
these dynamics and the environmental issues of this
area.
The evolution of chorems both in terms of
applications and semantics is extensively discussed
in (Del Fatto, 2009) where the author provides a
review about the history of chorem, from its
definition (Brunet, 1986) to recent applications
(Kilppel et al., 2005).
A more recent application of the chorem concept
has been illustrated in (Del Fatto et al., 2008) where
the authors show how chorems can be used to
AFirstFrameworkforMutuallyEnhancingChoremandSpatialOLAPSystems
39
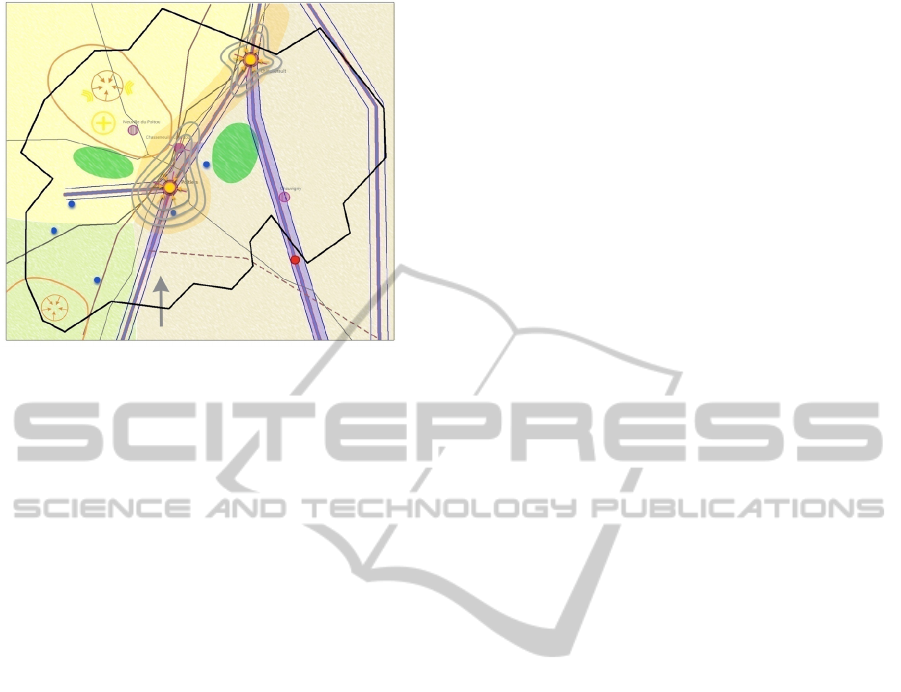
Figure 1: Chorems example.
visually summarize database content. To this aim
they provide for a definition and a classification of
chorems meant both to homogenize chorem
construction and usage, along with a usable
framework for computer systems. In particular, this
work emphasizes the role that chorems may play in
supporting decision-makers when analyzing
scenarios, by acquiring syntactic information (what,
where and when), as well as semantic aspects (why
and what if), useful to human activity of modelling,
interpreting and analyzing the reality of interest. A
prototype is also described, targeted to generate
chorems from a spatial dataset through a uniform
approach that takes into account both their structure
and meaning.
Finally, in (De Chiara et al., 2011) the authors
enhance the role that a chorem map may play in
geographic domains, by extending the semantics
associated with it through a more expressive visual
notation. In particular, by adopting the revisited
Shneiderman’s mantra, namely “Overview, zoom
and filter, details on demand” (Keim et al., 2006),
they allow users to acquire information about a
single phenomenon by accessing data characterizing
it from the underlying database. Each task of
interaction assumes a context-sensitive meaning and
invokes a proper function among the ones specified
in agreement with the mantra. As an example, when
a zoom / filter combination is applied on a chorem,
users are provided with data from spatial dataset
which initially contributed to its definition.
The main limitation of previously described
approaches is that chorem map extraction cannot be
done on-demand according to spatial decision-
makers needs. This limits the analysis of decision-
making process since as stated in (MacEachren et
al., 2004), a high interactivity exploration and
analysis is mandatory when dealing with complex
and unknown datasets.
To be useful for decision-makers, some authors
define classes of chorems in order to help decision-
makers to choice the right visual representation for a
particular phenomenon. Therefore, from the initial
chorematic grid of Brunet (1986), JP Deffontaines et
al. (1990) have formalized spatial models to
represent agricultural phenomena. S Lardon and P-L
Osty (2000) have shown an application of spatial
modelling on bushes expansion in farming lands.
Lardon and Piveteau (2005) have revised and
adapted the chorem grid for territory management
purposes. They distinguished structures (considered
space objects) and dynamics (spatial processes in
which these objects are identified). However,
decision-makers have hand-extract and hand-draw
their chorems from data sources.
Thus, the framework presented in the paper
enhances chorems systems since it allows the online
extraction and visualization of chorems using
SOLAP operators. At the same time, adding chorems
visualization to SOLAP improves its
geovisualization analysis capabilities (c.f. Section
5).
3 FAO CASE STUDY
An example of a Spatial DW (SDW), which will be
used all along the paper to describe our proposal, is
depicted in Figure 2 using the UML profile
presented in (Boulil et al., 2015). Here, several
stereotypes have been defined, one for each element
of the SDW. For example a spatial dimension
presents the <<SpatialDimension>> stereotype, a
spatial level is identified with <<SpatialAggLevel>>
stereotype. The <<Fact>> stereotype designs facts
and numerical and spatial measures have the
stereotypes <<NumericalMeasure>> and
<<SpatialMeasure>>.
The SDW is loaded using open-data of FAO
(FAO2015). It allows analysis of agricultural
cultivated surface and production per year, country
and crop. It presents a spatial hierarchy grouping
countries in areas, and years by decade. Using this
SDW it is possible to answer queries like: “What is
the total surface and production of wheat per country
and year?”. More complex analysis could be
performed using this SDW. In particular to evaluate
national agricultural policies, it is possible to
compare agricultural production and surface over
time, for example using the query: “What are
differences of total surface and production per
DATA2015-4thInternationalConferenceonDataManagementTechnologiesandApplications
40

Figure 2: FAO Spatial Data Warehouse.
country on the last 5 years. In our case study, we
work using national wheat production and national
wheat area harvested of European countries between
1991 and 2011. These data allow us to analysing not
only the variations of production and acreage but
also variation of crop yields and productivity. The
range of the period studied lets us to do several
analysis in different temporal scales.
4 CHOREMOLAP
In this section, we present the theoretical framework
for integration of SOLAP and chorems (Sec 4.2),
and its implementation in a SOLAP tool (Sec 4.1).
4.1 Architecture
ChoremOLAP architecture is described in Figure 3.
It is based on a Relational SOLAP architecture
composed of three tiers: SDW, SOLAP server and
SOLAP client.
Figure 3: ChoremOLAP architecture.
The Spatial Data Warehouse tier is implemented
using the Spatial DBMS PostGIS (PostGIS, 2015).
PostGIS is an extension of Postgres providing a
native support for spatial data and spatial analysis
functions. This tier is used for storing alphanumeric
and spatial multidimensional data. Warehoused
spatial data is stored using the star-schema (Kimball,
1996), where levels of the denormalized spatial
dimension present geometric attributes.
AFirstFrameworkforMutuallyEnhancingChoremandSpatialOLAPSystems
41
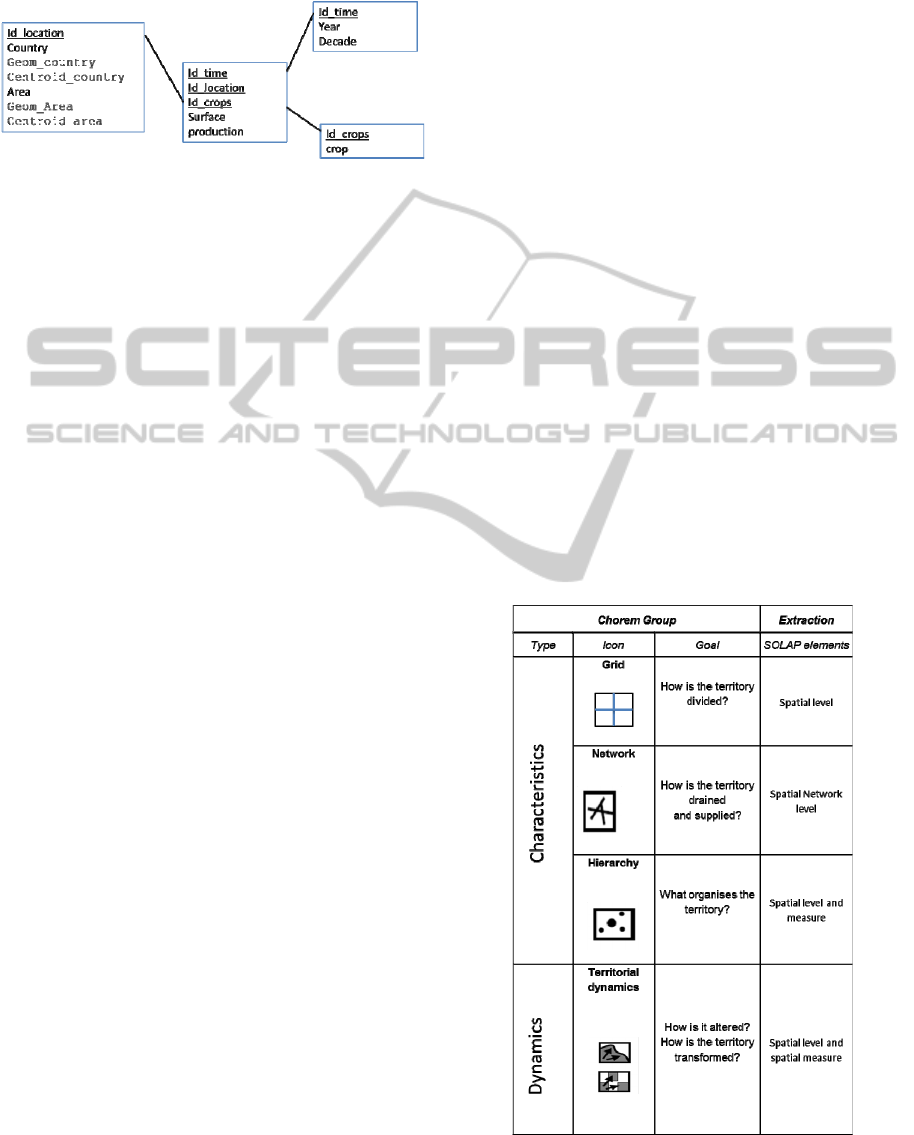
Example. The logical model of our case study is
shown on Figure 4, where a table for each dimension
is defined, and one table for the fact.
Figure 4: Star-schema of the FAO SDW.
The spatial dimension presents a geometry
column for each spatial level (Geom_country and
Geom_area). We also note that two additional
geometries representing the centroid of the countries
and the areas have been defined since, as detailed in
the next sections, they are used for the chorems
visualization.
The SOLAP server used is GeoMondrian
(GeoMondrian, 2015). GeoMondrian is an open-
source SOLAP Server supporting GeoMDX.
GeoMondrian represents dimensions and measures
using an XML file, which defines a mapping on the
logical schema. GeoMondrian supports SOLAP
queries on the top of Postgis.
The SOLAP client is a web-based client
composed of the OLAP client JPivot and the GIS
client OpenLayers. In particular, JPivot is an open-
source web-based OLAP client implementing all
OLAP operators by the simple interaction with the
pivot table. JPivot supports MDX. Cartographic
visualization of SOLAP queries is provided by the
cartographic web client OpenLayers. Openlayers is
an open source JavaScript library for displaying map
data in web browsers.
The architecture presented in (Bimonte, 2014)
has been extended in two ways to support chorems
extraction and visualization as described in Section
4.3. We have used this SOLAP system since it
provides an open and customizable visual interface.
Indeed, the main idea for implementing
customizable cartographic visual displays in the
SOLAP client is the usage of SLD and GML
standards, which are used by standard mapping web
services (e.g., WMS). A Styled Layer Descriptor
(SLD) is an XML schema specified by the Open
Geospatial Consortium (OGC) for describing the
appearance of map layers. Moreover, the Geography
Markup Language (GML), defined by the Open
Geospatial Consortium, allows expressing
geographical features. We use GML to represent
spatial data and the SLD for its appearance.
The original geovisualization proposed method
in (Bimonte, 2014) consists of chloropleth maps
(e.g. coloured geometries) implemented using GML
and SLD. Here, we have added the visualization of
icons representing chorems as described in the Sec
4.2.
In the SOLAP server, we have implemented a
component that translates a chorem query in a
classical SOLAP GeoMDX query. In this way,
chorem queries are transparently handled by any
SOLAP server. The proposed extensions are detailed
in the rest of this section.
4.2 Principles
Our geovisualization methods are based on two main
groups:
Chorem-based geovisualization methods, which
are based on chorems, and
Non chorem-based geovisualization methods,
which are classical geovisualization methods.
4.2.1 Chorem-based Geovisualization
Methods Principles
The chorems used in our approach are a subset of
chorems identified by S Lardon and P-L Osty (2000)
that can be extracted from spatial warehoused data,
as shown on Figure 5. Here, 5 main groups of
chorems are described.
Figure 5: Chorems and extraction mapping of the
ChoremOLAP framework.
DATA2015-4thInternationalConferenceonDataManagementTechnologiesandApplications
42
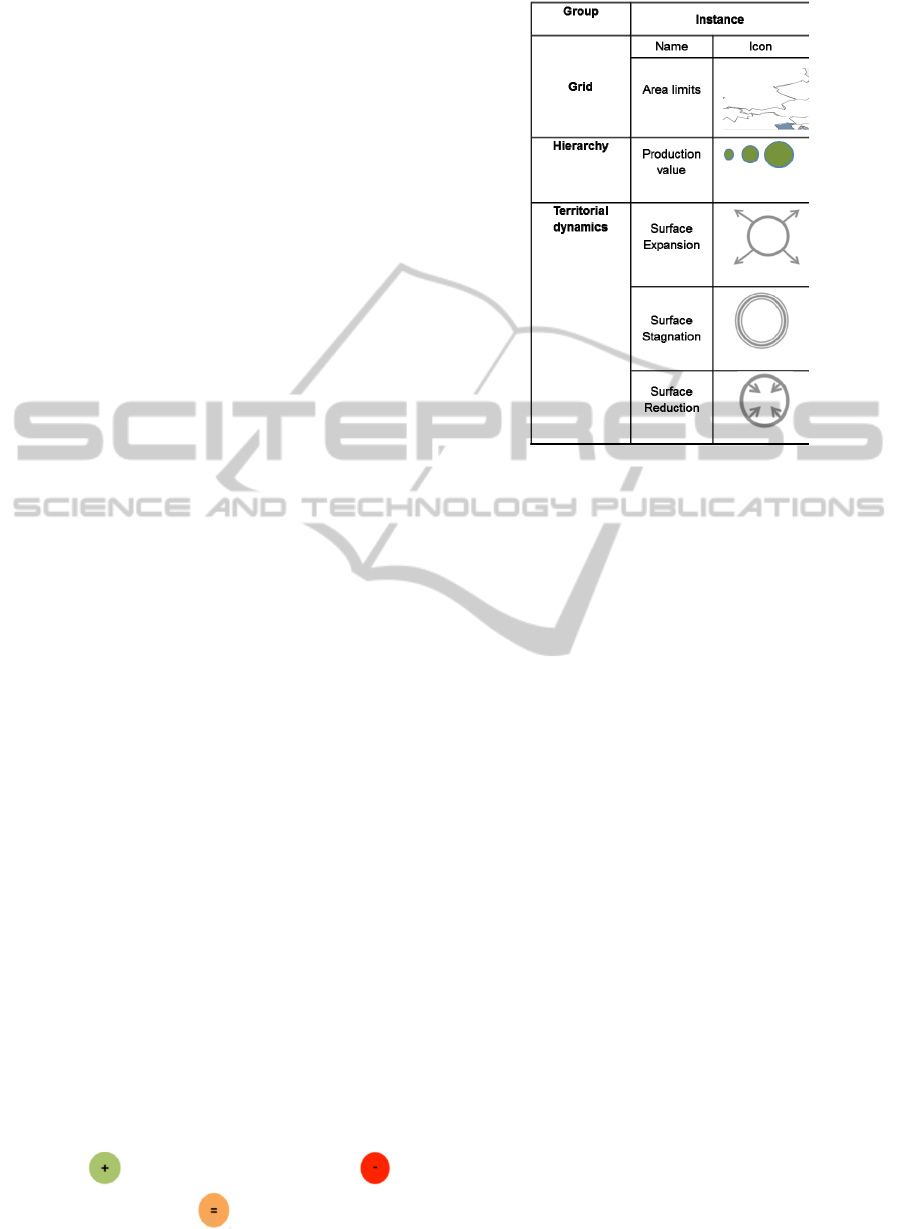
In particular, Grid represents how the territory is
divided by actors (for example, municipalities).
Network designs the presence of network structures
such as roads, rivers, but also informational
networks drained and supplied the territory.
Hierarchy specifies the different entities and how
they organize the territory.
The dynamic chorems result from the temporal
evolution of these structures. The Territorial
Dynamic transforms differentiated spaces, even by
continuous expansion or by discrete allocation.
Example. In Figure 6 an example of instance for
each group of chorems is also presented using our
case study.
Let us now describe what elements of the spatio-
multidimensional model are used to extract chorems
(Figure 5).
Grid chorems group concerns only the
geometries of spatial levels.
Example. In our case study the chorem “Area
limits” is simply defined using the spatial level
“Area” of the SDW.
In the same way, Network chorems group is also
only associated to spatial levels defined as spatial
network levels in (Bimonte et al., 2013).
Hierarchy chorems group refers to spatial
members and their numerical properties, which can
change along non-spatial dimensions.
Example. In our example, “Production increase”
chorem is defined using the spatial level “Country”
and the measure “Production”.
Finally, Territorial Dynamics chorems group is
similar to Hierarchy, but here the properties are
strictly related to the geometries of the spatial level
(spatial measures).
Example. The “surface” measure is a spatial
measure, and so the “Surface Reduction” chorem is
calculated using the spatial level “City” and
“surface” measure.
4.2.2 Non Chorem-based Geovisualization
Methods Principles
The system proposed in (Bimonte, 2014) allows to
displays results of SOLAP queries using chloropeth
maps. Here we extended them by using the
simplified geometries of the Grid chorems group.
Moreover, it allows visualizing nominal measu-
res using an iconic representation. For example, in
order to visualize production evolution, we define
three icons:
if there is an augmentation, if
there is a diminution, and
otherwise.
Figure 6: Chorems of the FAO SDW.
4.3 Extraction and Visualization
In this section, we detail how chorems of Figure 5
are extracted (Section 4.3.1) and visualized (Section
4.3.2) on the top of the SOLAP architecture of
Figure 3
4.3.1 Extraction
In order to extract chorems on the top of a classical
SOLAP server, we use MDX. MDX is de-facto
standard query language of OLAP servers. MDX
allows defining calculated measures (i.e. measures
calculated using measures values stored in the SDW
tier).
The template MDX formula for the Territorial
Dynamics chorem is presented in Figure 7. The
chorem is represented by the calculated measure
[Measures].[ChoremE]that assumes the
values:
“-1” the phenomenon reduces
“0”: the phenomenon does not change
“+1” the phenomenon expands
where:
Phenomena is the measure used for the chorem
definition. For example Phenomena =
“Surface” allows the extraction of Surface
Reduction, Surface Stagnation and Surface
Expansion chorems respectively (Figure 7);
TimeRange represents the interval between two
dates (Date) (for example TimeRange =5 allows
comparing Phenomena values of each year with
5 years ago values).
AFirstFrameworkforMutuallyEnhancingChoremandSpatialOLAPSystems
43

Figure 7: Territorial Dynamics chorem MDX template.
4.3.2 Visualization
The visualization of the Grid chorems group is
simply achieved by the visualization of simplified
geometries of the spatial levels members stored in
the SDW tier (Figure 5).
Example. An example of Grid visualization is
shown on Figure 8.
Figure 8: Visualization of the Grid chorem.
The visualization of the Territorial Dynamics
chorems group is implemented using a simple SLD
template (Figure 9).
Figure 9: Territorial Dynamics chorem SLD template.
An SLD template is generated for each
combination of non spatial members
(NonSpatialDimensionsMembersChorem) present in
the pivot table result (for example “2000”). It also
defines a rule for each chorem value ChoremValue
corresponding to the calculated measure
[Measures].[ChoremE] (-1, 0, +1). For each
rule, an image associate to the chorem value is
visualized (ChoremImage). The location where this
image is displayed is represented using GML. We
use the centroid of the spatial member, when it is a
polygon stored in the spatial dimension table (Figure
4).
Example. Figure 10 shows an example of the
chorems Surface Stagnation, Surface Reduction, and
Surface Expansion for each country in 2000.
Decision-makers rapidly “see” that Italy presents a
surface reduction, while France has a surface
expansion.
Figure 10: Surface Stagnation, Surface Reduction, and
Surface Expasion.
The Hierarchy chorems group is implemented in
the same way, but here we present only an example
of visualization.
Example. An example of Hierarchy chorem
visualization of the production on 2000 is shown on
Figure 11 (Italy and Switzerland are in the same
category, while France production is higher).
Figure 11: Production value.
An example of non-chorem based
geovisualization (Sec. 4.2.2) showing a chloropleth
map for the value of the surface on 2000 and the
production evolution per country is shown on Figure
12.
DATA2015-4thInternationalConferenceonDataManagementTechnologiesandApplications
44
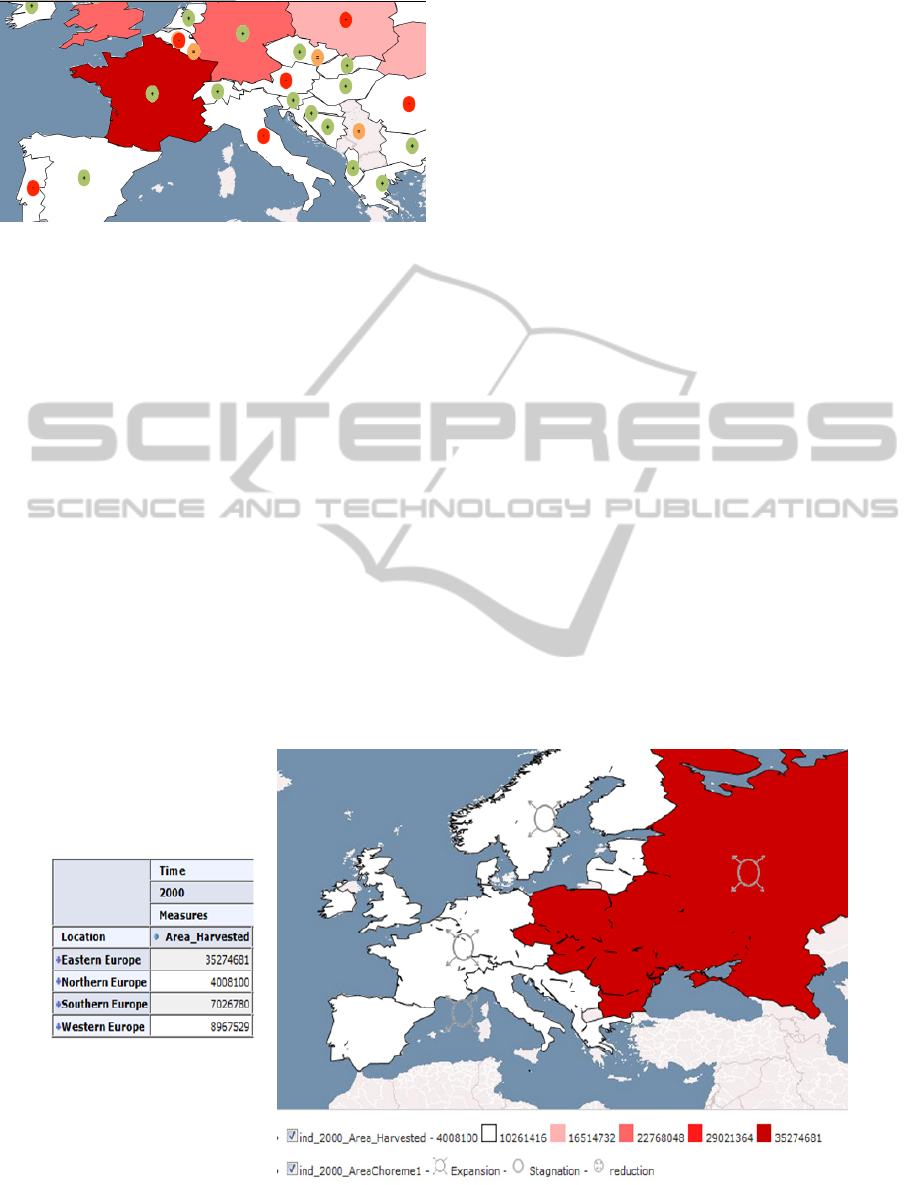
Figure 12: Non chorem-based geovisualization.
5 DISCUSSION
In this section, we analyse how our approach
mutually improves SOLAP and chorems systems.
5.1 Chorems Improved by SOLAP
As we state in the previous section, ChoremOLAP
allows to interactively creating chorems. This is
achieved by simply triggering SOLAP queries, as
described in the following.
SOLAP operators allow to explore the warehoused
data on-line aggregating measures values, and in our
tool also chorem values. For example, decision-
makers can move from the “Area” spatial level to
the “Country” spatial level by the simply interaction
with the pivot table of our web-client (i.e.
DrillDown operation on the spatial dimension)
(Figure 13). As shown on Figure 13a, the surface
chorem is visualized at the “Area” spatial level.
When the decision-maker DrillDowns to the
“Country” spatial level, the chorem map is
instantaneously re-calculated for each country
(Figure 13b).
In the same way, the decision-maker can
dynamically change other dimensions. For example
starting from the chorem map of figure 13a, he
change the year, for example moving from 2000 to
1995, and the chorem map is online calculated.
Thus, we can conclude that SOLAP system allows
the online creation and visualization of chorem
maps.
5.2 SOLAP Improved by Chorems
Let us now describe how SOLAP maps are
improved by chorems visualization.
In order to evaluate the new analysis capabilities
offered by our framework from a visualization point
of view, we performed a comparative study of
ChoremOLAP against one of the most advanced
commercial SOLAP clients. We compare our
proposal to classical SOLAP visualization methods
and we analyze the ability to represent different kind
of SOLAP queries.
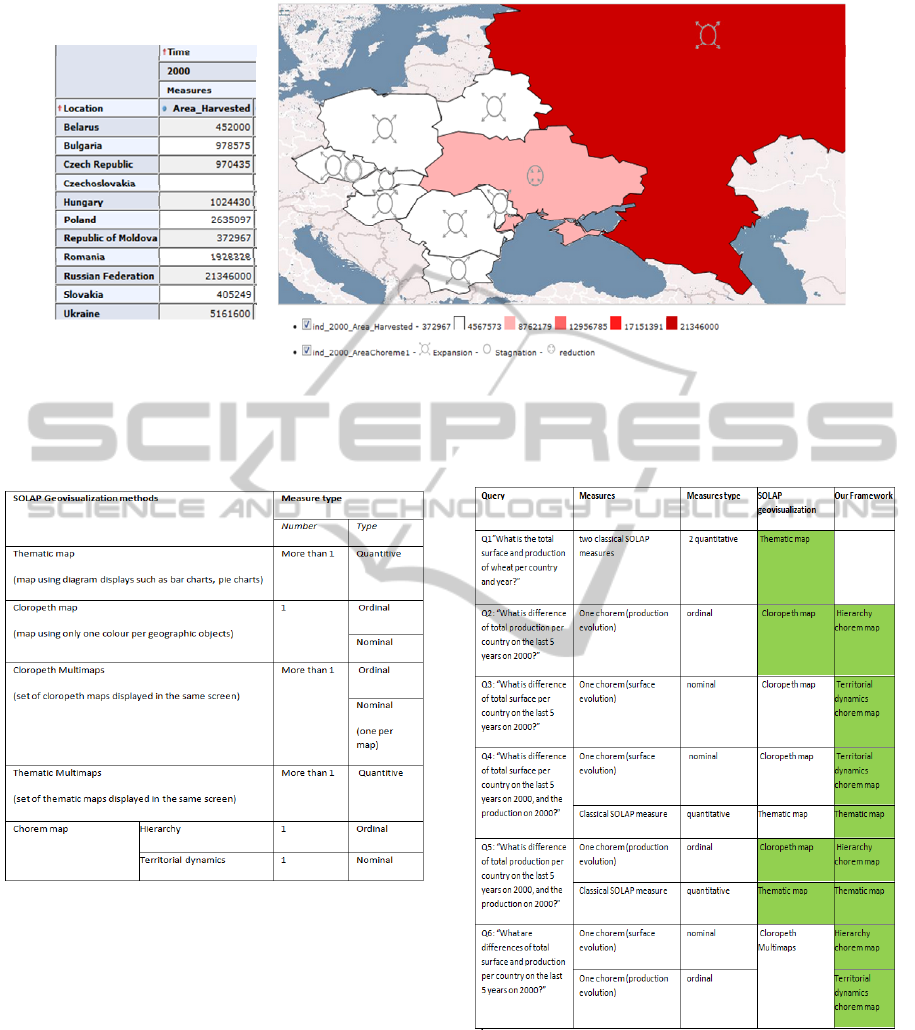
In table 1 we present what and how many measures
can be visualized with govisualization methods for
SOLAP including our chorem maps.
(a)
Figure 13: Drill Down for automatic chorem extraction and visualization.
AFirstFrameworkforMutuallyEnhancingChoremandSpatialOLAPSystems
45
(b)
Figure 13: Drill Down for automatic chorem extraction and visualization (cont.).
Table 1: Geovisualization methods for SOLAP.
In table 2 we evaluate these geovisualization
methods on 6 SOLAP queries. These queries
represent all possible combinations of possible
measures involved in a SOLAP query.
Query Q1 is a classical SOLAP query, therefore
there is no need to use chorems.
Query Q3 concerns one chorem (surface
evolution). Here using chorem visualization is very
satisfying for the decision-maker since to each
nominal value of the chorem (stagnation, etc.) a
particular icon is used. Chloropleth map can be also
used, but decision-maker is forced to mentally
associate a colour to a surface evolution.
Thus, chorem maps should be preferable to
chloropleth maps for nominal measures.
Table 2: Evaluation of geovisualization methods.
For the query Q2 chorem maps and chloropleth
maps have the same expression power.
For the Queries Q4 and Q5, our framework
presents the same advantage of Query 3.
Query Q6 concerns 2 chorems (surface and
production evolution). Therefore, chloropleth
multimaps (one chloropleth map per measure) can
be used, but the main limitation is that the decision-
maker has mentally to overlay the maps to compare
DATA2015-4thInternationalConferenceonDataManagementTechnologiesandApplications
46

the two measures country by country. Thus our
approach seems perform chloropleth multimaps.
To conclude, our geovisualization methods based
on chorems do not always replace classical
geovisualization methods of SOLAP tools, but they
appear useful when dealing with phenomena that can
be represented as chorems.
However, usability test should be provided to
quantify the advantage of using chorem maps
instead of SOLAP maps. They represent our future
work.
6 CONCLUSIONS AND FUTURE
WORK
SOLAP systems allow decision-makers to on-line
explore warehoused spatial data by means of
SOLAP operators, which aggregate numerical
indicators, to produce reports composed of pivot
tables, graphical displays and thematic maps.
However, when the analysed spatial phenomena are
complex, advanced geovisualization techniques are
need. On the other hand, it has been recently shown
that chorem maps represent an excellent
geovisualzation technique to summarize and reveal
hidden spatial phenomena. However, chorem
systems are based on pre-defined maps, which limit
potentiality of spatial decision-making process.
Thus, the goal of this paper is to introduce a
framework being capable to merge the interactive
analysis capability of SOLAP systems and the
potentiality of a chorem-based visual notation in
terms of visual summary.
In detail, we propose a set of methods to on-line
extract and visualize chorems on the top of a SDW.
We also propose an implementation of our
framework using a general architecture based on
standards.
As future work, we plan to investigate other
chorems as defined in (Lardon et al., 2005). We also
plan to define a usability study to evaluate in a
quantitative way the pro and cons of the usage of
chorems instead of classical SOLAP
geovisualization methods from a visualization point
of view.
REFERENCES
Bédard, Y, Rivest, S., Proulx, M-J., 2006. Spatial on-line
analytical processing (solap): Concepts, architectures,
and solutions from a geomatics engineering
perspective, Data Warehouses and OLAP: Concepts,
Architecture, and Solutions 14, p. 298–319.
Bimonte, S., 2014. A generic geovisualization model for
spatial OLAP and its implementation in a standards-
based architecture, Ingénierie des Systèmes
d'Information, 19(5), p. 97-118.
Bimonte, S., Kang, M., Trujillo, J., 2013.
Integration of Spatial Networks in Data Warehouses:
A UML Profile, ICCSA (4) 2013, p. 253-267.
Boulil, K., Bimonte, S., Pinet, F., 2015. Conceptual Model
for Spatial Data Cubes: A UML Profile and its
Automatic Implementation, journal of Computer
Standards & Interfaces, 38, p. 113-132.
Brunet, R., 1986. La carte-modele et les choremes,
Mappemonde, 4, p. 4–6.
De Chiara, D., Del Fatto, V., Laurini, R., Sebillo, M.,
Vitiello, G., 2011. A chorem-based approach for
visually analyzing spatial data, J. Vis. Lang. Comput,
22(3), p. 173-193.
Deffontaines J.P., Cheylan J.P., Lardon S., 1990. Gestion
de l’espace, des pratiques aux modèles, Mappemonde,
1990/4, 48p.
Del Fatto V., 2009. Visual Summaries of Geographic
Databases by Chorems. PhD thesis.
Del Fatto, V., Laurini, R., Lopez, K., Sebillo, M., Vitiello,
G., 2008. A chorem-based approach for visually
synthesizing complex phenomena, Information
Visualization, 7(3-4), p. 253-26.
FAO, 2015. http://data.fao.org/statistics. Geomondrian,
2015.
http://www.spatialytics.org/fr/projets/geomondrian/
Inmon, W., 1992. Building the data warehouse. Wellesley,
MA, USA.
Lardon S., Osty P. L., 2000. Time-space dimensions of
farmers’ practice: methodological proposals from
surveys and modelling of sheep farming. Case studies
in Southern Massif Central, France, Fourth European
Symposium. European Farming and Rural Systems
Research and Extension into the next Millenium.
Environmental, Agricultural and Socio-economic
Issues.
Lardon S. Piveteau V., 2005. Méthodologie de diagnostic
pour le projet de territoire: une approche par les
modèles spatiaux. Géocarrefour: Revue de Géographie
de Lyon, 80(2), p. 75–90.
Lebourg, M-N., Lardon, S., Cot, C., De Nayer, A.,
Lacroix, C., Dumont, A., 2014. La méthode de
diagnostic partagé: comprendre et analyser un
territoire avec les représentations spatiales
schématiques pour produire le «Dire de l’État»,
AgroParisTech Clermont-Ferrand et DREAL Poitou-
Charentes.
MacEachren A, Gahegan M, Pike W., 2004.
Geovisualization for Knowledge Construction and
Decision Support, IEEE Comput. graphics and appl.,
24(1), p. 13-17.
Keim, D.A., Mansmann, F., Schneidewind, J., Ziegler, H.,
2006. Challenges in visual data analysis, Information
Visualization (IV 2006), IEEE Press.
AFirstFrameworkforMutuallyEnhancingChoremandSpatialOLAPSystems
47

Kimball, R., 1996. The data warehouse toolkit: practical
techniques for building dimensional data warehouses,
John Wiley & Sons.
Klippel, A., Tappeb, H., Kulikc, L., Leed, P., 2005.
Wayfinding Choremes a language for modeling
conceptual route knowledge, Journal of Visual
Languages & Computing, 16(4), p.311-329.
PostGIS, 2015. http://postgis.net/
Silva, R., Moura-Pires, J., Santos, M., 2012. Spatial
Clustering in SOLAP Systems to Enhance Map
Visualization, International Journal of Data
Warehousing and Mining, 8(2), p. 23-43.
DATA2015-4thInternationalConferenceonDataManagementTechnologiesandApplications
48
