
Student Focused Dashboards
An Analysis of Current Student Dashboards and What Students Really Want
Gabriel Reimers
1
and Anna Neovesky
2
1
Quality and Usability Lab, Technische Universit
¨
at Berlin, Ernst-Reuter-Platz 7, 10587, Berlin, Germany
2
Digital Academy, Academy of Sciences and Literature Mainz, Geschwister-Scholl-Str. 2, 55131, Mainz, Germany
Keywords:
Dashboards, Learning Analytics, Visualisation, Self Reflection.
Abstract:
Online learning analytics dashboards are already available in various online learning platforms and are in use
at schools and universities. In this paper we give an overview about several existing dashboard applications.
Most of these dashboards are either targeted at teachers and tutors or focus on the presentation of research
relevant learning analytics concepts. We present two surveys among school and university students asking
them about their requirements on a learning dashboard. The results show that basic requirements of students
are not addressed in current learning platforms and dashboards. We formulate several research questions that
need to be answered to create dashboards that put students in the center of dashboard design processes and
give an outline of our own efforts in that direction.
1 INTRODUCTION
Learning Analytics and Quantified Self currently are
quite popular topics in educational research. Learn-
ing Analytics are “the use of intelligent data, learner-
produced data, and analysis models to discover infor-
mation and social connections, and to predict and ad-
vise on learning.” (Siemens, 2010).
So, Learning Analytics are the evaluation of the
learners’ activity in order to improve learning and
teaching. Quantified Self, on the other hand, is a
concept coming from the consumer industry and de-
scribes the detailed tracking of personal activity, es-
pecially in sports. Fitness trackers like the FitBit fit-
bit.com and Jawbone jawbone.com log the movement
of their owner and present that data in concise, graph-
ical form on an online dashboard. Quantified Self and
dashboards have quickly been adopted by education
research. In the next section we will present several
of these educational dashboards and will discuss their
very purposes.
It will be shown that most of the scientific dash-
boards were designed from a learning analytics per-
spective. That means they are usually intended to
present learning data collected from data mining or
detailed user tracking. The purpose of these dash-
boards often is to easily identify problems of single
students or to analyze the teaching method. Other –
often commercial – tools offer dashboards for teach-
ers and parents to supervise their children’s grades
and attendance. Both approaches focus on observa-
tion of students, which can also be seen in the cur-
rent NPC Horizon report on higher education saying
“Dashboards filter this information [from learning an-
alytics] so that student progress can be monitored in
real time.” (L. Johnson, 2014a).
Certainly, it is very valuable for teachers, re-
searchers and parents to have an overview of the stu-
dents’ progress and possible issues. However, hardly
any of the presented dashboards is intended to be the
central starting point for students to see their progress.
Those that are, are scientific prototypes and often de-
signed for specific courses.
We conducted two surveys among school and uni-
versity students asking them what they want to see in
their online learning platform. The results of these
studies are presented in section 3. Our surveys show
that students lack a dashboard as their personal con-
trol center. Basic information, like an overview of
grades and upcoming deadlines, are not sufficiently
covered by existing dashboards.
399
Reimers G. and Neovesky A..
Student Focused Dashboards - An Analysis of Current Student Dashboards and What Students Really Want.
DOI: 10.5220/0005475103990404
In Proceedings of the 7th International Conference on Computer Supported Education (CSEDU-2015), pages 399-404
ISBN: 978-989-758-107-6
Copyright
c
2015 SCITEPRESS (Science and Technology Publications, Lda.)

2 EXISTING FORMS OF
DASHBOARDS
When looking on existing online tracking systems
for student progress, we think it makes sense to
distinguish between the environments of schools in
K12 and higher education. Requirements of stu-
dents in schools and universities differ just as much
as resources of institutions and expertise of staff do.
Therefore, we present current dashboard examples
from both K12 and higher education environments,
focussing on how well they might serve as a central
personal dashboard for students.
2.1 Dashboards in K-12
2.1.1 Teacher & Parent Focused
US school books publisher Pearson offers the com-
mercial online “student information system” Pow-
erSchool pearsonschoolsystems.com. PowerSchool
is mostly a class management tool for teachers and
school administrators and allows tracking of grades
and absences as well as management of schedules and
student files. PowerSchool also offers an overview
of progress. Even mobile apps are available for stu-
dents and parents to be notified about new or note-
worthy grades. After all, the system mainly targets
parents and teachers and does not provide a graphical
progress and activity dashboard to students.
A quite similar approach is taken by the Ger-
man private school Schloss Neubeuern. The
school has an online grading portal schloss-
neubeuern.de/de/SchuleUndInternat/Noten Online,
where parents can access “real time presentations
of your children’s grade book”. Students also have
online access to their grades but clearly are not the
target audience. Presentation is limited to a tabular
gradebook.
The commercial learning management system
(LMS) Edmodo snapshot.edmodo.com/snapshot-for-
schools, which is specifically targeted on schools, has
extensive statistics on dashboards, which feature a
slick modern design but are available to teachers and
administration only.
2.1.2 Student Focused
It is noteworthy that some initiatives and private or-
ganizations provide very advanced dashboard tools in
order to keep students motivated. Especially the non-
profit education platform Khan Academy is to be men-
tioned, even though their dashboard is strictly embed-
ded in a gamification context with levels and badges.
khanacademy.org However, KhanAcademy is an in-
dependent project and not linked to institutional learn-
ing in schools
Also, the schoooools.com platform, developed at
the Instituto Superior Polit
´
ecnico Gaya in Portugal for
K-6 schools, gives a lot of social feedback to students
and is indeed a very mature and complete private so-
cial network for children. Yet, a dashboard or any
form of statistics is not part of the platform.
2.2 Dashboards in Higher Education
2.2.1 Learning Management Systems
Ideally, dashboards should be provided by the
learning management systems (LMS) which often
are already in place at schools and universities.
Regarding the top LMS (Green, 2013), however,
none of them has dashboards for students.
Moodle and Blackboard both provide very basic
overview tables of student grades for instructors but
have no equivalent for students. But it should be men-
tioned that at least for Moodle there is an extension
available that gives students a dashboard, displaying
graphs of the students online activity within Moodle
moodle.org/plugins/view/block mystats.
Brightspace claims to offer “Advanced An-
alytics” brightspace.com/solutions/higher-
education/advanced-analytics and so does Schoology
schoology.com/lms-reporting.php, but both only
provide learning analytics tools to instructors, not to
students.
2.2.2 OLI Dashboard
Carnegie Mellon University has a very broad project
called Open Learning Initiative (OLI) which is a plat-
form to create eLearning courses. oli.cmu.edu OLI
provides learning analytics data for educators and
even has a dashboard to track students’ activity. How-
ever, this students’ dashboard is basically just a tabu-
lar grade book.
2.2.3 Competency Map
The Competency Map, developed at Capella Univer-
sity, takes a more gamified approach and displays a
student’s progress split up into several competencies
(Grann and Bushway, 2014). For each course, key
competences are defined that should be obtained by
the student — a bit like in role play games (RPG),
completing single tasks accounts to specific compe-
tences. Progress in each of these competencies is then
graphically displayed in a dashboard. Therefore, the
CSEDU2015-7thInternationalConferenceonComputerSupportedEducation
400

competency map is a very student oriented tool, giv-
ing learners a concise overview of what is expected
of them, and how much progress they have achieved.
The authors’ position is “that the most direct way for
institutions to help students appreciate their educa-
tional experience is to align faculty grading practices
with specific competencies and to visualize student
learning for multiple stakeholders.” Accordingly, one
extra step is required to use this dashboard concept in
common grade-oriented institutions and courses.
2.2.4 Grade Craft
Similar to the Competency Map, researchers at
Michigan University created a dashboard for uncon-
ventional, gamified courses. (Holman et al., 2013)
The GradeCraft dashboard system was used in two
courses: Videogames & Learning and Political Sci-
ence. Both courses used game elements to increase
motivation and participation. Students could collect
badges for special tasks and would select assignments
from a bigger pool so they could choose their own
‘path’. GradeCraft provides an overview of current
progress and achievements and shows what needs to
be done to get the next achievement. As students are
free in what tasks they choose, GradeCraft also in-
cludes a performance prediction tool, which allows
informed decisions on what to do next.
It is especially worth pointing out that GradeCraft tar-
gets students and instructors equally and provides in-
terfaces for both groups. All performance measur-
ing, assessment and analytics are thus managed in one
central tool.
2.2.5 Case Studies
Especially the team around Erik Duval at Katholieke
Universiteit Leuven (KU Leuven) has a strong focus
on researching dashboards. Several prototype dash-
boards were developed there. The Student Activity
Monitor (SAM) (S. Govaerts, 2012) and an unnamed
prototype (J. L. Santos, 2012) are dashboards that dis-
play activity and time spent during a course to both
teachers and students. Building on that, the dashboard
StepUp! was developed at KU Leuven, which “visu-
alizes different learning traces, such as: time spent on
the course, resource use (e.g. wiki and blog use) and
social media use (e.g. Twitter)” (J. L. Santos, 2013).
All dashboards of KU Leuven provide students with
detailed tracking of their activity and are in that sense
very similar to fitness trackers’ dashboards.
At Melbourne University a dashboard was de-
ployed in a biology course in order to explore stu-
dents’ interpretation of learning analytics dashboards.
(Corrin and de Barba, 2014). The dashboard dis-
played bar charts of performance in online tests and
assignments as well as LMS activity. For each value
the course mean was given. So students can see if
they are above or below average. The authors report
that “the ability to view their feedback in this format
was found to have an impact on students’ motivation
towards the subject and helped to guide them in their
progress and performance in learning activities and
assessments”.
2.3 Summary
While commercial dashboards show more basic in-
formation like grades, they strongly focus on teachers
and parents as users. Benefit for students is usually
very limited.
The scientific dashboards, on the other hand, are usu-
ally more student targeted. They are often designed
for single courses and display learning analytics in-
formation like the time spend on certain tasks or the
activity in social learning settings.
None of the existing dashboards does really give
students the greater picture of their progress, espe-
cially not across courses. Key information like grades
is often missing, and the graphical presentation and
usability are not on par with what commercial trackers
like FitBit or Jawbone or not-institutional providers
like Khan Academy offer.
Higher education institutes like universities are
closer to providing useful dashboards to their stu-
dents as they directly profit from research results. Still
none of the research-driven dashboards has gained
wider acceptance and learning management systems
like Moodle or Blackboard do not offer real dash-
board solutions.
Schools, in contrast, don’t directly profit from re-
search projects and rely on commercial or open
source software solutions. Accordingly, it takes
longer for student focused approaches to dribble
down to K-12 education. This is also reflected in the
current NPC Horizon reports, which show dashboards
as a current or soon-to-be topic in higher education
but only as a long-term trend for schools (L. Johnson,
2014b).
3 RESEARCH POSITION
Erik Duval is right when he says “one of the big prob-
lems around learning analytics is the lack of clar-
ity about what exactly should be measured” (Duval,
2011). When building a dashboard, the biggest ques-
tion still is what data to present there. In our opinion,
StudentFocusedDashboards-AnAnalysisofCurrentStudentDashboardsandWhatStudentsReallyWant
401
the contents of a dashboard should not be determined
by what data is the most accessible or most research
relevant. A user centered design approach must be
followed and user studies have to be made to evaluate
what the users – i.e. the students – need and want to
see on the dashboard.
We conducted two surveys to ask students about
their expectations of online learning systems and es-
pecially learning dashboards.
Focus was put on performance analysis, and we did
not ask about badges or LMS activity measures. On
the one hand, performance data like grades or home-
work ratings are a very general pattern found in al-
most any course in schools and universities. On the
other hand, performance data is the primary informa-
tion to students. It will probably be helpful to expand
dashboards later with additional activity metrics, but
the first step must be to display performance progress
to the students in a satisfying way.
3.1 K12 Students Survey
First, we did a small survey among 47 German stu-
dents attending 12th and 13th grade of a comprehen-
sive school in Mainz, Germany. The survey was con-
ducted during a career day at the Academy of Sciences
and Literature Mainz. The students were aged be-
tween 16 and 19.
The questionnaire asked several general questions
about the participants use of computers but especially
covered how students would like to see their perfor-
mance online. The given statements and the possible
answer options are given in Table tab:schoolSurvey.
Two items aimed to evaluate to what extend stu-
dents would like to see their grades online. On the
statement “I would like to see all my grades online.”
the students mostly agreed. 33 of the 47 partici-
pants (70%) “generally” or “always” want to have an
overview of their grades online. The item “My class-
mates should be able to see my grades online.” largely
received disagreement. 35 “never” want that (74%),
11 only after explicit clearance (23%). No student
said she wanted her grades to be always visible to
classmates.
Three items under the headline “How would the
following online services affect your motivation to
learn:” should evaluate what form of online per-
formance analysis students would consider motivat-
ing. The idea of “Detailed online statistics of my
grades, graphically displaying my progress” received
the most agreement. 17 of 47 respondents (36%)
were “neutral” to that item and 4 students (9%) con-
sidered it “frustrating” or “strongly frustrating”. 18
(38%) said such statistics would be “motivating” and
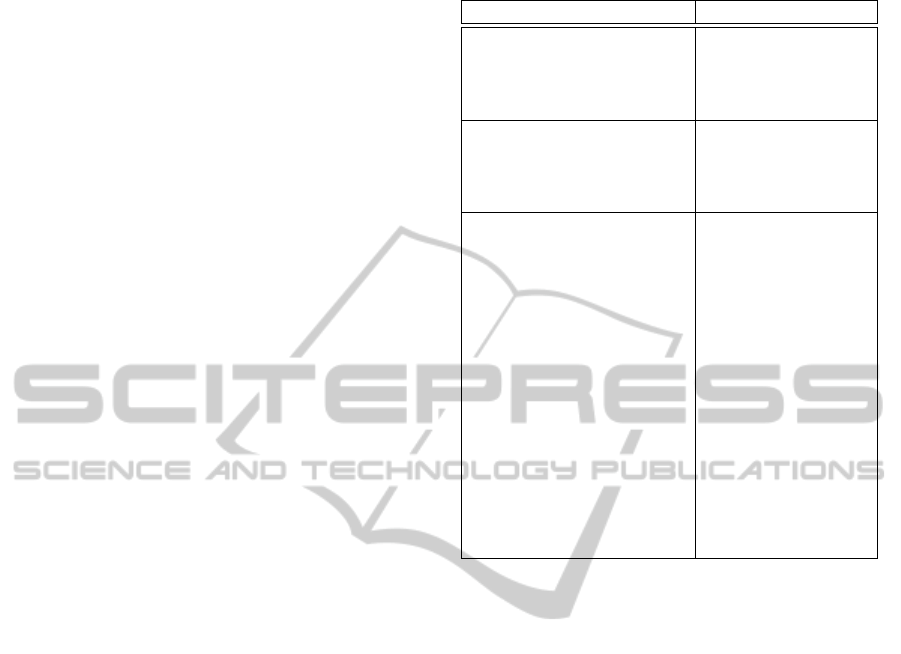
Table 1: Items asked in the survey among school students.
Statement Answer options
I would like to see all my
grades online.
No, never
Generally not
Generally
Yes, always
My classmates should be
able to see my grades on-
line.
No, never
After clearance
If not blocked
Yes, always
How would the following
online services affect your
motivation to learn:
• Detailed online statis-
tics of my grades,
graphically displaying
my progress
• Online comparison to
the grades of my class-
mates
• Online ranking (High-
Scores) of my class-
mates
strongly frustrating
frustrating
neutral
motivating
strongly motivating
8 (17%) even “strongly motivating”.
The option of an “Online comparison to the grades
of my classmates” received more disagreement. 17 of
47 respondents (36%) found that “strongly frustrat-
ing”. To almost half of the students (22) such compar-
ison would not affect their motivation. Only 8 (17%)
found that “strongly motivating”. Even more refusal
was met with the concept of “Online ranking (High-
Scores)”. Over half of the students (24 of 47) con-
sidered that as “frustrating” most of these (15) even
as “strongly frustrating”. Besides 13 neutral respon-
dents (28%) only 10 students (21%) could imagine
high scores as motivating.
3.2 University Students Survey
We also asked 194 university students in an online
survey about what they expect from an online learn-
ing platform. Participants were all from Germany or
Austria and consisted of 164 Bachelor and 20 Mas-
ter students. The focus of the survey was evaluating
possible dashboard elements. Among others, the fol-
lowing statements were given:
• “I would like to see all information relevant to my
studies in one place.”
• “I would like to have an overview of deadlines to
organize my studies.”
CSEDU2015-7thInternationalConferenceonComputerSupportedEducation
402

• “Automatic notifications / reminders would be
useful.”
• “Notifications about my learning activities moti-
vate me to continue learning.”
• “I would like to have a statistical analysis of my
study performance.”
• “I would like to compare my performance with
my fellow students.”
• “I would like to see my position in a course wide
anonymous ranking.”
• “I would like to have a social media button in my
online learning platform.”
To each statement participants could express their
agreement on a scale from 1 (totally agree) to 5 (to-
tally disagree).
Nearly all questioned students stated that they
would like to see all information relevant to their stud-
ies in one central place. 93% expressed agreement by
selecting 1 or 2 on the scale. Almost as many (85%)
agreed (selecting 1 or 2) on wanting an overview of
deadlines to better organize their studies. Both might
appear as very obvious and comprehensible desires.
Yet, none of the online platforms discussed above pro-
vides these two features.
A lot of students also agreed to wanting automatic
notifications like reminders. 77% of the respondents
expressed agreement to that (1 or 2 on scale). How-
ever, no clear opinion formed on whether notifications
about learning activities would be motivating. 18%
totally agreed on that but 15% totally disagreed. 28%
were undecided (3 on scale). Learning analytics in
form of statistical analyses of personal study perfor-
mance gained more agreement with 60% agreeing (2)
or strongly agreeing (1).
Social sharing of progress and comparing with
others does not seem to be very popular among stu-
dents. 44% of the respondents disagreed or totally
disagreed on the statement “I would like to compare
my performance with my fellow students”. Only 34%
expressed agreement. An almost similar response was
received on the item “I would like to see my position
in a course wide anonymous ranking”. 29% agreed
on that statement; 42% disagreed.
The strongest disagreement was expressed on
wanting a social media button on the learning plat-
form. 54% totally disagreed on this item, 19% dis-
agreed. Only 14% expressed desire for such a sharing
option (selecting 1 or 2).
4 CONCLUSIONS AND FURTHER
RESEARCH
Both surveys showed a strong desire among school
and university students to see statistics of their per-
formance online. However, students are very con-
scious about their privacy. Despite strong usage of
social networks like Facebook and Instagram (87%
of school students stated regular usage of Facebook
in our survey, 47% used Instagram), the majority of
students don’t want others to see their grades. Direct
comparison and competition with classmates or fel-
low students is also seen very critically. In general
one can say that students want to use learning ana-
lytics, but only for their personal motivation and self
reflection.
However, our surveys can only serve as a start-
ing point. We are currently building an online proto-
type with modular graphic panels on which we want
to conduct iterative user studies. Using the prototype
we want to further validate the outcomes of the sur-
veys above, and we might be able to get more detailed
results on those items from the survey where respon-
dents did not express clear preferences. Responses on
concepts like course wide rankings might be difficult
to imagine and could result in different responses if
students experience them in a working prototype.
Ultimately, we hope to answer questions such as:
What are the basic elements of information all stu-
dents want to see? What are the best approaches to
present that information? What data is it that stu-
dents are not interested in or specifically don’t want
to see? Are there different requirements across stu-
dents of different disciplines, social or age groups?
Another very practical question is how to get stu-
dents’ data into the dashboard. We like to elaborate
what useful data can be pulled from the APIs of learn-
ing management systems such as Moodle and what
data needs to be collected specifically for the dash-
board. Finally, a way must be found to integrate such
a dashboard in existing infrastructures and platforms
of institutions. Creating a plug-in for existing LMS,
for example, will probably result in bigger acceptance
among students and administration than creating yet
another platform.
ACKNOWLEDGEMENTS
Thanks to Guimfac Steve Leolin, Mike Schubert and
Tobias Zillmann for conducting the survey on univer-
sity students.
StudentFocusedDashboards-AnAnalysisofCurrentStudentDashboardsandWhatStudentsReallyWant
403

REFERENCES
Corrin, L. and de Barba, P. (2014). Exploring students’
interpretation of feedback delivered through learning
analytics dashboards. In Proceedings of the ascilite
2014 conference.
Duval, E. (2011). Attention please! learning analytics
for visualization and recommendation. In LAK ’11:
Proceedings of the 1st International Conference on
Learning Analytics and Knowledge. ACM.
Grann, J. and Bushway, D. (2014). Competency map: Visu-
alizing student learning to promote student success. In
LAK ’14 Proceedings of the Fourth International Con-
ference on Learning Analytics And Knowledge. ACM.
Green, K. C. (2013). The national survey of computing
and information technology. The Campus Computing
Project, October.
Holman, C., Aguilar, S., and Fishman, B. (2013). Grade-
craft: what can we learn from a game-inspired learn-
ing management system? In Proceedings of the Third
International Conference on Learning Analytics and
Knowledge, pages 260–264. ACM.
J. L. Santos, K. V. (2013). Addressing learner issues with
stepup!: an evaluation. In LAK ’13: Proceedings of
the Third International Conference on Learning Ana-
lytics and Knowledge. ACM.
J. L. Santos, S. G. (2012). Goal-oriented visualizations of
activity tracking: a case study with engineering stu-
dents. In LAK ’12: Proceedings of the 2Nd Interna-
tional Conference on Learning Analytics and Knowl-
edge. ACM.
L. Johnson, S. Adams Becker, e. a. (2014a). Horizon Re-
port: 2014 Higher Education Edition. The New Me-
dia Consortium, Austin, Texas.
L. Johnson, S. Adams Becker, e. a. (2014b). Horizon Report
Europe: 2014 Schools Edition. Publications Office of
the European Union and The New Media Consortium,
Luxembourg / Austin, Texas.
S. Govaerts, K. V. (2012). The student activity meter for
awareness and self-reflection. In CHI EA ’12: CHI ’12
Extended Abstracts on Human Factors in Computing
Systems. ACM.
Siemens, G. (2010). What are Learning Analytics.
http://www.elearnspace.org/blog/2010/08/25/what-
are-learning-analytics (2015-01-21).
CSEDU2015-7thInternationalConferenceonComputerSupportedEducation
404
