
Integrating GIS and Numeric Weather Prediction Model with Wheat
Simulation Model for Optimal Wheat Production Locations in
Arid Regions
R. Al-Habsi
1
, Y. A. Al-Mulla
1
, Y. Charabi
2
, H. Al-Busaidi
1
and M. Al-Belushi
1
1
Department of Soils, Water and Agricultural Engineering, College of Agricultural and Marine Sciences,
Sultan Qaboos University, P.O.Box 34, Al-Khod 123, Muscat, Sultanate of Oman
2
Department of Geography, College of Arts and Social Sciences, P.O.Box 42, Al-Khod 123, Sultan Qaboos University,
Muscat, Sultanate of Oman
yalmula@squ.edu.om
Keywords: Numeric Weather Prediction Model, Simulation Model, Wheat, Emergence, Geographic Information
System, Arid Regions.
Abstract: The upgrade rate of self-sufficiency in wheat depends largely on the amount of water and land to achieve
the quantity and proportion of self-sufficiency target. The climatic and soil conditions, however, are
dynamic conditions. Hence, these conditions seriously limit the capability of providing the optimum tempo-
spatial required data to assist in improving the wheat production unless specialized sensors are utilized
along with excessive work. That implies the crucial need of using computer simulation models. The general
objective is of this study was to delineate the best location for wheat production in arid regions such as
Oman through linking Wheat Simulation Model (WSM) with Numeric Weather Prediction Model (NWPM)
in Geographical Information Systems (GIS). The GIS application software used in this study was the ESRI
ArcGIS. Four field trials, over two seasons, have validated positively the linkage of the developed WSM
with GIS. The developed model can be promoted as a tool of improving wheat cultivation through making
the most of available water in wheat production and increasing the growing acreage of wheat in arid regions
like Oman.
1 INTRODUCTION
Food security is an important issue especially after
the recent food crisis that hit many parts of the
world. Food crisis was not limited only to the
substantial rise in the prices of food imports, but
extended to the lack of universal availability, and
then the scarcity and the difficulty of obtaining these
goods. One of the most important crops for food in
the world is wheat, where more than two thirds of
food is provided by cereals (Bushuk and Rasper,
1994) and one third production of cereals is wheat
(Carver, 2009). Knowing when to plant wheat crop
is one of the most important factors for better
emergence timing which leads to better wheat yield
especially in arid regions. The emergence time,
however, is affected by climatic conditions, soil
property and planting depth (Al-Mulla et al., 2014).
Moreover, despite the fact that an arid country like
Oman has no problem with soil temperature for
wheat emergence, Omani wheat growers usually
sow almost double number of seeds into a land in
order to assure they will get higher wheat production
efficiency of that land due to non-emergence of
portion of the sowed seeds. That might due to seeds
viability and to soil properties especially the
optimum soil temperature and soil water potential in
addition to planting depth which all play an
important role in determining the time of emergence
for wheat seedlings. Therefore, in order to increase
the wheat production efficiency, there is a need to
determine the optimum soil temperature, water
potential and planting depth of wheat and so the best
time and percentage of wheat emergence can be
predicated. However, given the above constraining
factors and due to varying values of these factors
from time to time and from place to place,
estimation of emergence time for wheat will be
much easier by using a computer simulation model.
Simulation is a computerized model that
describes the behavior of a complex system based on
141
Al-Habsi R., Al-Mulla Y., Charabi Y., Al-Busaidi H. and Al-Belushi M..
Integrating GIS and Numeric Weather Prediction Model with Wheat Simulation Model for Optimal Wheat Production Locations in Arid Regions.
DOI: 10.5220/0005472501410147
In Proceedings of the 1st International Conference on Geographical Information Systems Theory, Applications and Management (GISTAM-2015), pages
141-147
ISBN: 978-989-758-099-4
Copyright
c
2015 SCITEPRESS (Science and Technology Publications, Lda.)

a set of data and dynamic variables and interactive
components. The Computer simulation models
become popular in many natural systems in physics,
chemistry and biology, human systems in economics
and social science. Biosystems field is considered as
one that requires the use of simulation and computer
modeling including the predicting the time and
percentage of wheat emergence in field applications.
A wheat simulation model (WSM) was
developed by Al-Mulla et al., (2014) to predict the
time and percentage of winter wheat emergence
based on the three above mentioned factors: planting
depth, soil temperature, and soil water potential. The
developed wheat emergence model is based on the
hydrothermal time concept which was proposed and
further developed, but for germination only, by
Gummerson (1986), Bradford (1990 and 1995) and
Cheng and Bradford (1999). The WSM governing
equation has the following form:
)])(()[(
)(
b
fprobit
b
b
TT
HT
E
ft
(1)
where t(f)E is time from sowing seeds to emergence
(days), is soil water potential (MPa), and
b
and
σψb are mean and standard deviation of the base
water potential respectively (MPa), T is soil
temperature (°C), Tb is the base soil temperature
(°C), and probit(f) indicates the number of standard
deviations away from the mean that any fraction of
the seed population lies. It linearizes a cumulative
normal distribution which facilitates modeling
efforts (Bauer et al., 1998). The parameter HT is
the hydrothermal time to emergence (MPa degree-
days). It can be determined using the following
formula:
E
t
b
TT
b
HT
(2)
where all parameters explained above.
The parameter probit(f) can be determined as
follows:
b
b
E
t
b
TT
HT
Eprobit
)50(
)(
(3)
where
)50(
b
is base water potential for 50%
population of planted seeds
The developed WSM also includes the
calculation of the maximum percent of emergence
(Emax) by using the following equation which
works as a threshold for the developed model:
32
2
1
max
cDcDcE
(4)
where D is sowing depth (cm), and c1, c2, and c3
are constants related to ψ and T.
The soil temperature and water potential
information required for the emergence model are
not easy to find for any lands. That’s due to the need
of using special sensors to measure these factors at
time of emergence of the wheat crop. In this study a
novel approach is explored in order to utilize the
WSM model without the need of using any sensors
by finding a better way for extracting the needed
model’s input data from Numerical Weather
Prediction Model (NWPM) which is based on
numerical models that deal with set of motion
equations. These equations govern the fluid flow
partial differential equations (Stensrud, 2007).
Hence, by linking WSM with NWPM in Geographic
Information System (GIS), the best location of
wheat production in arid regions as the Sultanate of
Oman can be delineated and that was the main aim
of this study. The specific objectives of the projects
were: 1) to validate the developed simulation model
for predicting the time and percentage of emergence
using local field data, 2) to examine the performance
of the model using different wheat cultivars, 3) to
extract needed data from Numerical Weather
Prediction Model (NWPM), 4) to re-design the
simulation model by linking it with Geographic
Information system (GIS) and NWPM, and 5) to
create maps delineating the best location of wheat
production in the Sultanate of Oman.
2 MATERIALS AND METHODS
2.1 Field Experiment
Field experiment was conducted at Agriculture
Extension Station in Sultan Qaboos University in the
Sultanate of Oman (Figure 1) between first of
December 2013 until End of May 2014. The field
work was divided into two times. In time one,
planting started in 1st December 2013 until the end
of harvesting stage March 2014. Planting in second
time started on 22 January 2014 until 21 May 2014.
The field was divided to four lines, the first two lines
for time one and the last two lines for time two.
Each line was divided to seven 2m ˟ 2m plots. Each
plot was divided to ten cultivated lines irrigated by
drip irrigation system. The space between one line to
another was 20 cm and the wheat seeds were sowed
adjacent to the lines with 5cm spacing. Two wheat
varieties were used. One of them is local variety
GISTAM2015-1stInternationalConferenceonGeographicalInformationSystemsTheory,ApplicationsandManagement
142

which is Coli and the second one was imported from
Kuwait which is KW1. The seeds were sowed at two
different depths: 2.5cm and 5cm. Hence, the
experiment treatment factors are: 2 times ˟ 2
varieties ˟ 2 planting depths. Three replicates for
each treatments planting with one control plot of
each varieties were conducted. The planting method
in the control plots was by broadcasting.
Fertilization was applied as recommend by AES
staff experience. By which fertilizer was applied two
times a week through fertigation system where
combination of urea, potassium nitrate and
phosphoric acid was applied trough the irrigation
system.
2.2 Germination Test
Ten petri dishes were prepared for each variety and
in each petri dish a filter paper and ten seeds from
each variety were putted and irrigated with water.
So, 100 seeds in total for each variety were
examined. Germination of seeds was counted and
recorded on daily basis.
2.3 Physical and Chemical Soil
Analysis
2.3.1 Soil Sampling
One composite soil sample was taken by collecting
different soil samples from different plots and mixed
together. Then soil was air dried and sieved through
2 mm.
Figure 1: Sultanate of Oman (Source: geoatlas.com).
2.3.2 Moisture Content and Oven Dry
Weight
After the soil sample was air _ dried and sieved by
2mm sieve, unspecified amount of soil was taken
and its weight was determined before and after
drying in oven at 104 °C for 24 hours. Then
percentage of moisture content and Oven dry weight
were calculated and result used in soil texture
calculation.
2.3.3 Soil pH, EC and SAR Measurements
Paste saturation sample was prepared and soil
solution was extracted by air vacuum for Electrical
Conductivity (EC) and pH measurements using
electrical electrode. For Sodium Absorption Ratio
(SAR), concentration of Sodium (Na), Calcium (Ca),
and Magnesium (Mg) were measured using ICP. To
find SAR value, the following equation was used:
(5)
2.3.4 Soil Texture
Soil sample was air-dried and sieved by 2mm sieve.
From sieved soil, 50g of soil was assigned into a
baffled stirring cup with 10ml of 0.5N sodium
hexametaphosphate and distilled water was added
until half fill of the cup. The mixture was stirred for
five minutes and transferred to 1000ml graduated
cylinder which was filled with distilled water until
1000ml mark. The suspension was mixed and at the
end of 20 second from mixing, the hydrometer was
inserted. The first reading of hydrometer was
recorded after 40 seconds and also temperature of
suspension was recorded by the thermometer. Then,
the hydrometer was removed and re-shacked again.
After two hours, the reading of hydrometer and
temperature were recorded. The percentage of each
particle size was calculated according to these
equations:
Corrected Hydrometer Reading:
HRc = HR + (0.2 for every 1°C above 20°C)
(6)
%
40 sec 2
∗100
(7)
%
2
∗ 100
(8)
% 100 – % %
(9)
IntegratingGISandNumericWeatherPredictionModelwithWheatSimulationModelforOptimalWheatProduction
LocationsinAridRegions
143

2.4 Irrigation
Drip irrigation was used in the study. Ten drip lines
were crossing the plots with 20cm spacing between
the emitters. Water required was calculated based on
crop evapotranspiration for each stage of wheat
development. The historical data like daily
maximum and minimum soil temperature and
humidity, wind speed and the meteorological data
for Seeb weather station were used. Visual basic in
Excel sheet was used to create sheet for reference
water requirement (ETo). The sheet is based on
Penman – Monteith method. To determine the time
of irrigation, the discharge of water from meter was
recorded. Hence, the time of irrigation was
calculated by dividing volume of water required by
the discharge.
2.5 Sensors
The inputs parameters including water potential and
soil temperature, for wheat simulation model can be
obtained from the sensors installed in the field. A
229 heat dissipation sensor from Campbell Scientific
Company, USA, is used to measure water potential
indirectly using principle of heat dissipation. The
principle of heat dissipation is whenever there is
water potential gradient between sensors and the
surrounding soil, water movement between sensor
and soil take certain time to reach equilibrium.
Hydraulic Equilibration time depend on magnitude
of water potential gradient and hydraulic
conductivity. The changes in water content of sensor
ceramic matric lead to change in the thermal
conductivity of sensor/ soil complex. There is
exponential relationship between water content and
thermal conductivity. As water content in the
ceramic sensor increase, the thermal conductivity
increase. A 229 heat dissipation sensor is porous
ceramic cylindrical shaped with thermocouple and
heating element at the middle of the cylinder. It has
the ability to measure a wide range of matric
potential from -10 to -2500KPa and it is compatible
with most Campbell Scientific data logger and
multiplexer. Also, it is known by long lasting
without need for maintenance. The 229 should be
installed horizontally at the desired depth and good
contact between the ceramic cylinder and soil must
be exist (Instruction manual of model 229, Campbell
Scientific Inc.). Soil water potential can also be
measured by using MPS2 from Decagon Devices
Inc., USA. MPS2 is ideal sensor for a range of water
potential measurement between -0.01 and -0.5 MPa
and soil temperature between -40 and 60C (Decagon
Devices Inc.). A 5TE sensor from Decagon devices,
USA, is used to measure volumetric water content,
soil temperature and electrical conductivity. It
measures the three parameters independently. The
volumetric water content is obtained by measuring
the dielectric constant of the media using
electromagnetic field supplied from the sensor with
70 MHz while the soil temperature is obtained from
thermistor which is installed at surface of the sensor
with a range of readings of -40 to 50°C. Electrical
conductivity is obtained by using stainless steel
electrode array and the reading is taking within the
range of 0 to 23 ds/m. The sensor is easily installed
in the field through pushing it directly to
undisturbed. EC is measured by applying alternating
current to two electrodes and measuring the
resistance between them soil (Decagon Devices
Inc.).
2.6 Linking WSM to GIS
To link the wheat simulation model in GIS, soil
temperature and volumetric water content raster
layers were required as input for the model and they
were extracted from the European Centre for
Medium-Range Weather Forecasts (ECMWF)
website which is an independent intergovernmental
organization established in 1975. The Centre
provides a catalogue of forecast data worldwide that
can be purchased by businesses and other
commercial customers for national community.
Different spatial analysis tools in GIS were used to
create the final emergence map mainly rater
calculator and reclassifying tools (Figure 2).
2.7 Statistical Analysis of Physical
Characteristics of Wheat
Physical characteristics of wheat like length of plant,
number of spikes per plant, number of seeds per
spike and weight of 100 seeds of each variety were
examined at the late season of each planting time.
Plant height was measured by taking average length
of random selection of plants using meter tab from
the soil surface to the begging of the spike. The
average plant length in each plot was recorded.
Random plants were also selected to find out
number of spikes in it and average numbers of seed
in each spike were counted. After the seeds removed
from its spike, 100 seeds from each plot was
weighed using digital scale. For statistical analysis,
ANOVA for single factor was used to examine the
differences among each factor.
GISTAM2015-1stInternationalConferenceonGeographicalInformationSystemsTheory,ApplicationsandManagement
144
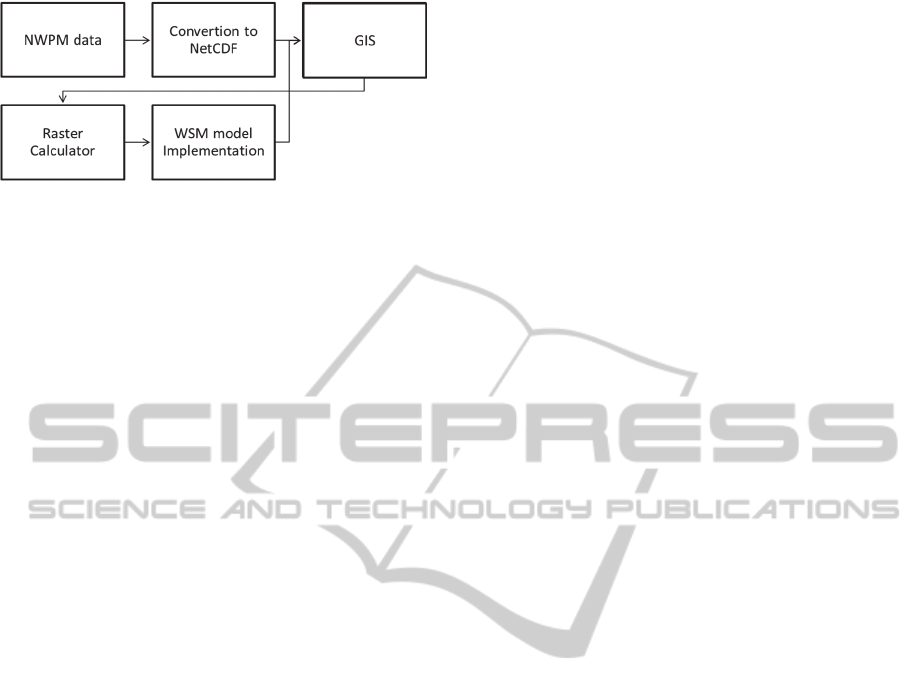
Figure 2: Flowchart of Creating Wheat Prediction Model
in GIS.
3 RESULTS AND DISCUSSION
Germination was started after second day of
planting. For local variety (Coli) germination was
99% in second day and 100% in third day. For
KW1, germination was 46% in second day and after
second day till day six of planting, germination was
stopped at 60%.
Soil Texture Class for planting field is silt loam
which is medium textured soil. For wheat
production, the best soil type is well drained fertile
loamy soil to sandy loam soil (DAFF, 2010).
Electrical conductivity for paste soil extract is 478
µS\cm, Sodium absorption ratio (SAR) is 2.35 and
pH is 8. The best range of soil pH for wheat
production is between 6 and 7.5 (DAFF, 2010). The
pH value in this study exceeded the optimum range a
little bit. Alkalinity affects wheat production
negatively in two ways by decreasing water
infiltration and decreasing availability of
micronutrients. Since that the solubility of Iron (Fe),
manganese (Mn), copper (Cu) and zinc (Zn)
decrease with increasing soil pH. However,
deficiency of the last three ions due to alkalinity has
not severe effect in wheat production area (Heyne,
1987). Based on the EC and SAR values, soil was
classified as non-saline and non sodic soil. It was
normal soil and suitable for wheat production.
Crop evapotranspiration and Irrigation
Scheduling for each plant stage are presented in
Table 1 for planting time one and two. As expected,
for first time of planting, crop coefficient (Kc)
started with small value but it increased as plant
grown and developed and then decreased at late
season as plant senesce. The crop water requirement
(ETc) followed the same pattern of the Kc. Because
the plant need more water at growth and developing
stages, the duration of irrigation increased until the
late season where it decreased and stopped for one
week before harvesting. The ET₀ and ETc values
increased during time two of planting than time one
due to the increase of air temperature. That resulted
in increasing the duration of irrigation supply in time
tow more than in time one.
Since WSM requires soil water potential as one
of the input data and since both sensors the 5TE and
MPS-2 measure volumetric water content for, there
was a need to convert these sensors data into water
potential. A relationship between soil’s volumetric
water content and water potential were obtained. By
which a regression equation of calculating water
potential from volumetric water content was found
as follows:
20.208
11.747 1.7176
(10)
Where Ψ is soil water potential (MPa) and wc is soil
water content (%).
The time of emergence equation of the WSM has
a probit parameter. It is a value that is used to
indicate the number of standard deviation away from
the mean that any fraction of seed population lies.
Also, it is used to linearize a cumulative normal
distribution which makes the model easy to work
(Al Mulla et al., 2014; Bauer et al., 1998). Since it is
not possible to calculate the probit value in GIS
directly, relationship was found between emergence
percentage and the probit value which can be
expressed in the following equation:
0.3383 ln
1.996
(11)
where Probit is probit value and E is emergence
percentage (%).
Figure 3 shows emergence results from time one.
Emergence started after day 4 from planting for all
treatments and reached maximum emergence at day
12 after planting. The maximum percentage was
achieved for Coli variety at 2.5 cm planting depth
which was 75 % at day 12 after planting while at
planting 5 cm depth, the maximum emergence was
62 %. For KW variety, at planting depth 2.5 cm, the
maximum emergence was achieved after day 12
with 53 % and at planting depth of 5 cm, the
maximum emergence was 36 %. Emergence results
of time 2 are presented in figure 4. The emergence
of both varieties started after day 5 from planting
and reached the maximum at day 12 from planting.
Coli variety had higher percentage of emergence
than KW variety where at 2.5cm planting depth it
reached the highest percentage among other
treatments with 77%. The KW variety reached its
higher emergence percentage at shallow planting
depth (50%) in comparison to deep planting depth
(44%).
The WSM predictions for the wheat to start
emerging were 5 days after planting (DAP) in time
one and 5 DAP in time two. While in the field it
IntegratingGISandNumericWeatherPredictionModelwithWheatSimulationModelforOptimalWheatProduction
LocationsinAridRegions
145
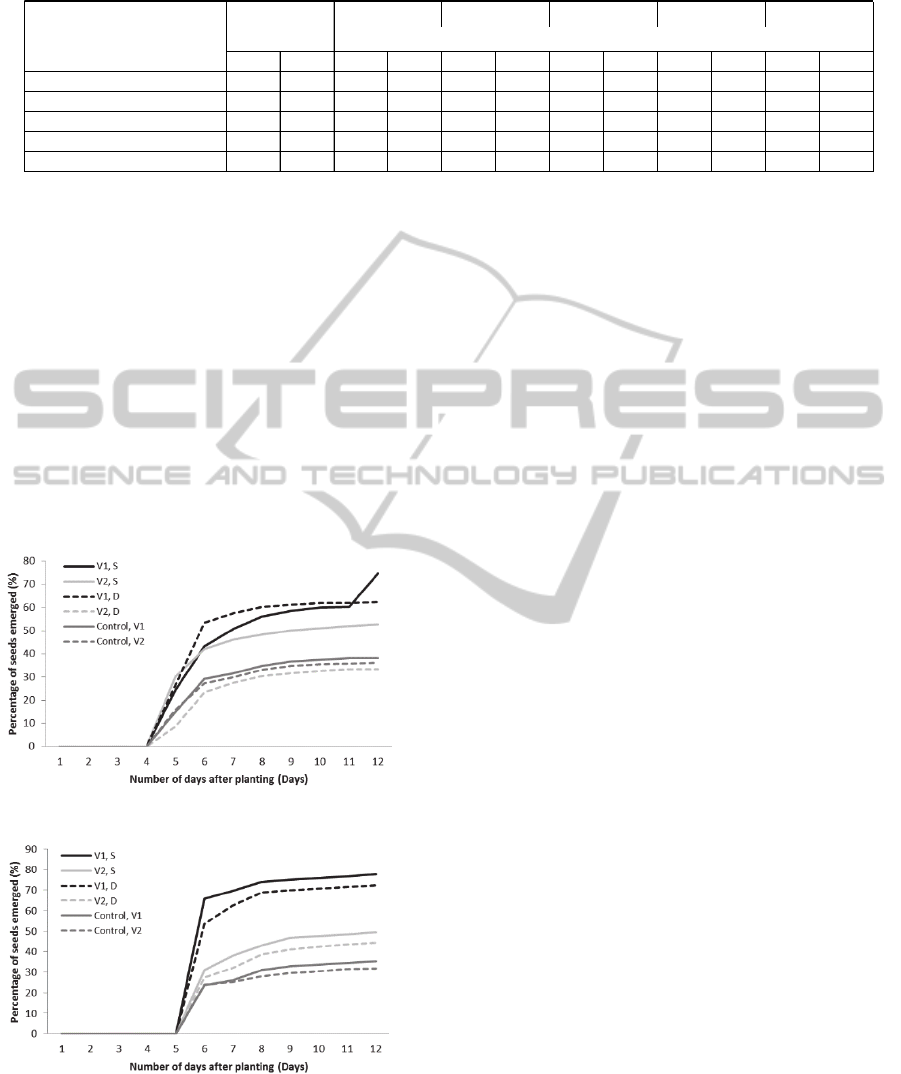
Table 1: Evapotranspiration and Irrigation Scheduling for Times one and two.
took 4 DAP in time one and 5 DAP in time two. The
DAP to reach 50% emergence was predicted by
WSM as 6 DAP and 6 DAP in both times one and
two. In the field, the wheat reached 50% emergence
after 7 DAP and 6 DAP in time one and time two.
The maximum percentage achieved in the field, for
time 1, was 74% whereas WS
prediction was 67%
while for time 2, the maximum percentage was
achieved in the field was 77% whereas WSM
prediction was 80%. The DAPs to reach maximum
emergence was predicted by the WSM as 7 DAP
while in the field it was achieved after 11 DAP for
time 1. For time 2, the SWM prediction was 6 DAP
in the field it was achieved after two more days
which was 8 DAP.
Figure 3: Wheat seed Emergence for Time one.
Figure 4: Wheat seed Emergence for Time two M.
The soil temperature and volumetric water content
data at level 1were extracted from ECMWF by
selecting a month long (October 2013) of the
required data with time steps of 24 hours. Equation
12 was used in the raster calculator to find soil water
potential from the volumetric water content layer
extracted from ECMWF. The data format was in
Network Common Data Form (NetCDF), so they
needed to be converted to raster data format for GIS.
That was done by selecting “Make NetCDF Raster
Layer” which is a sub menu under Multidimintion
menu of ArcToolbox.
After raster layers of soil temperature and water
potential were created from NetCDF file, coding the
equations of hydrothermal time and maximum
emergence was done using raster calculator.
Equations of maximum emergences are based on
certain range of temperature and water potential with
a total of 23 conditions. Hence, 23 raster layers of
pixels that match with emergence conditions have
certain values of maximum emergences and
therefore they made to appear in colored pixel.
However, the other pixels that do not match the
emergence conditions of emergence have no data.
To merge all emergence raster layers in one layer to
be used in the final equation of time of emergence,
the no data pixels were converted to zero value using
Reclassify tools from spatial analysis. All
reclassified emergence raster layers were combined
in one raster layer using addition tool in raster
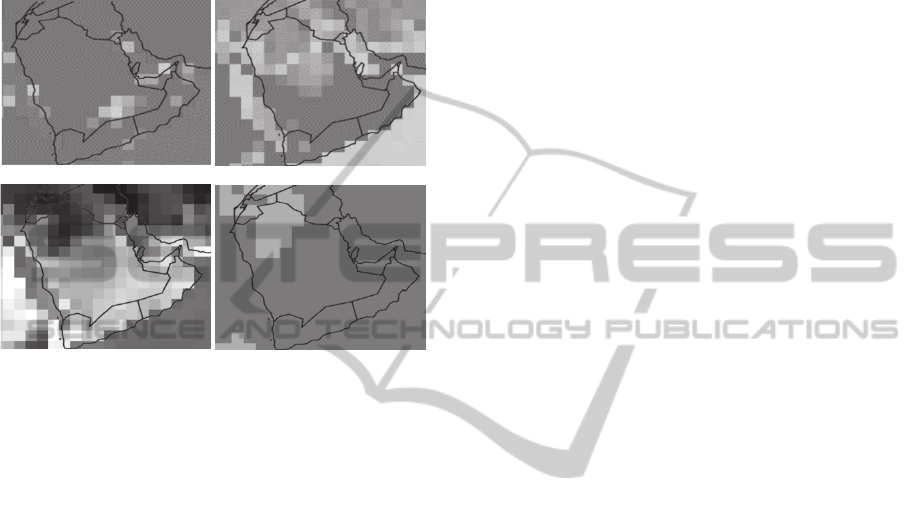
calculator producing a single layer map. Figure 5
shows the outcome of the GIS-Linked WSM
modified model for the Arabian Peninsula region
after extracting the NWMP data from the ECMWF.
4 CONCLUSIONS
Wheat is one of the most important crops for food in
the world including arid regions as the Sultanate of
Oman. For arid regions, It would be especially
useful to develop a method that can increase wheat
production location but with minimum possible
water consumption. By integrating GIS technology,
a Wheat Simulation Model (WSM) was further
developed for optimal wheat production location in
arid regions. WSM was tested with field data and the
effectiveness of the model was proven. The study
Satge Duration
K
c
Average ET
₀
Average Etc Volume Irrigation Time
Stage Name Days mm/day mm/day
m
3
min
Time 1 Time 2 Time 1 Time 2 Time 1 Time 2 Time 1 Time 2 Time 1 Time 2 Time 1 Time 2
Initial Stage 20 20 0.4 0.4 3.3 3.6 1.32 1.4 0.07 0.08 1.3 1.4
Growth and Branching 30 30 1 1 3.1 4.5 3.1 4.5 0.17 0.25 3.1 4.6
Completion of growth and Flowering 30 30 1.2 1.2 3.5 5.4 4.2 6.5 0.24 0.36 4.3 6.7
Compos itio n and Grain Filling 30 30 1 1 4.7 6.7 4.7 6.8 0.26 0.38 4.8 7
Late Season 15 15 0.4 0.4 5.3 8.8 2.12 3.5 0.12 0.20 2.1 3.6
GISTAM2015-1stInternationalConferenceonGeographicalInformationSystemsTheory,ApplicationsandManagement
146
illustrates a good example of GIS application for
solving spatial and temporal crop production
optimization problem. By which, it becomes
possible to delineate (map) the WSM outcome that
can cover any part of world including arid regions
by eliminating the need of using any sensors to run
the simulation.
(a) (b)
(c) (d)
Figure 5: GIS linked WSM outcome: (a) soil Water
Potential, (b) Soil temperature, (c) Hydrothermal time
factor and (d) Time to emergence.
ACKNOWLEDGEMENTS
The corresponding author, as a PI, appreciates the
financial support for this research provided by
Sultan Qaboos University (IG/AGR/SWAE/12/02).
REFERENCES
Al-Mulla, Y. A., Huggins, D. R., Stöckle, C. O., 2014.
Modeling the Emergence of Winter Wheat in
Response to Soil Temperature, Water Potential and
Planting Depth. Transactions of the ASABE, 57(3):
761-775.
Bauer, M. C., Meyer, S. E., Allen, P. S., 1998. A
simulation model to predict seed dormancy loss in the
field for Bromus tectorum L. J. Exp. Bot. 49:1235-
1244.
Bradford, K. J., 1990. A water relations analysis of seed
germination rates. Plant phys. 94:840-849.
Bradford, K. J., 1995. Water relations in seed germination.
In: Seed Development and Germination. Marcel
Dekker Inc. New York: 351-396.
Bushuk, W., Rasper, V. F., 1994. Wheat production,
properties and quality. Blakie Academic and
professional an imprint Chapman and Hall 273-310.
Carver, B. F., 2009. Wheat Science and Trade. World
Agriculture Series. Wiley-Blackwell. Ames, Iowa, 1
st
edition.
Cheng, Z., Bradford, K. J., 1999. Hydrothermal time
analysis of tomato seed germination responses to
priming treatments. J. Exp. Bot. 50:89–99.
DAFF (Department of Agriculture, Forestry and
Fisheries). 2010. Wheat Production Guideline, Public
of South Africa.
Gummerson, R. J., 1986. The effect of constant
temperatures and osmotic potentials on the
germination of sugar beet. J. Exp. Bot. 37, 729-741.
Heyne, E. G., 1987. Wheat and Wheat Improvement,
Second Edition, Publisher: Madison, Wisconsin, USA.
MAF (Ministry of Agriculture and Fisheries)., 2009.
Wheat Production in the Sultanate of Oman: Reality,
Challenges, and Future Vision. Wheat Production
Project National Committee Report. SQU. Oman.
Stensrud, D., 2007. Parameterization Schemes Keys to
Understand Numerical Weather Prediction Model,
Cambridge.
IntegratingGISandNumericWeatherPredictionModelwithWheatSimulationModelforOptimalWheatProduction
LocationsinAridRegions
147
