
A Tool for the Analysis of Change Management Processes in Software
Development Cycles
Mario P´erez
1
, Alvaro Navas
1
, Hugo A. Parada
1
and Juan C. Due˜nas
1
1
Center for Open Middleware, Universidad Polit´ecnica de Madrid, Madrid, Spain
Keywords:
Change Management Process, Software Release, Tools, RFC.
Abstract:
Change management processes theory specifies the life cycle of a change through an organization. It is a well-
known process present in day-to-day operations, with up to hundreds of changes passing through its phases
each day. There is a broad range of tools that help with keeping track of each of those changes. However,
the use of these tools, and hence the process itself, is not always translated perfectly into an organization.
Therefore, it is necessary to analyse how the process has been implemented and how to correct it. Change
management systems often offer some degree of analysis, but it is either too little or too obtuse. In this paper
we present a tool that can help analyse the data gathered by these systems in order to detect bottle-necks and
irregularities in a visual way tailored to the special time needs of the data.
1 INTRODUCTION
Today, change management process is being adopted
by most IT organizations to manage continuous
change of customer requirements and technologies.
It is a well-defined process by standards bodies such
ISO/IEC and ITIL which is considered a de facto stan-
dard (Lahtela and Jantti, 2011). Thus, organizations
are focused on customize their change process and
adopt a tool or change management system to trace
of each of those changes. These changes involve a set
of activities to plan, asses, approve, build, package,
test and deploysoftware in multiple environments and
with different technologies. Then changes takes place
in a complex scenario; and both managers and de-
velopers wish to make these activities light weighted
as possible by monitoring and improving the change
process. Therefore process managers require tools
provide information in order for change process to be
monitored, controlled, maintained and changed when
required.
Existing management systems provide mainly in-
formation to monitor the change process and to foster
collaboration among parts involved in change lifecy-
cle, but organizations also require information to ana-
lyze the process and then make decisions intended to
improve or change it. Thus in this work we focus on
analyze the change management process to determine
the useful information to detect bottlenecks and irreg-
ularities in a visual way tailored to the special time
needs of the data. Then make informed decisions in
order to modify or change the process.
Hence, in this paper we present an insdustrial
study case which use a graphic tool that allow man-
agers to better analize the temporal evolution of the
change management process by providing dynamic
information on it. We believe that graphical interface
makes easier detect loops or bottlenecks between dif-
ferent process stages.
The rest of this paper is organized as described
next. Section 2 describe briefly some relevants works
related with our propossal. In section 3 describe the
too, it includes requirements it satisfy and the criteria
we used to desing it. Section 4 deals with the descrip-
tion of industrial case used; and finally in section 5
provides the conclusions and some entries about of
future works.
2 RELATED WORKS
Change management process starts tipically when a
request for change (RFC) is produced as a conse-
quence of fixing a bug, updating a new software ver-
sion or satisfying a customer requirement. Then IT
organizations are permanently moving on change and
the need of process automation is felt such as is
pointed out by (Danesh, Amir Seyed and Saybani,
Mahmoud Reza and Danesh, Seyed Yahya Seyed).
As regards, in their work (Keller, A, 2011) propose
482
Pérez M., Navas Á., A. Parada H. and C. Dueñas J..
A Tool for the Analysis of Change Management Processes in Software Development Cycles.
DOI: 10.5220/0005468604820485
In Proceedings of the 17th International Conference on Enterprise Information Systems (ICEIS-2015), pages 482-485
ISBN: 978-989-758-097-0
Copyright
c
2015 SCITEPRESS (Science and Technology Publications, Lda.)

the automation of the change management process by
representing the RFC information as a task graph into
a set of steps and establishing how they will be car-
ried out. This work provides evidence about of how
graphic information on RFC helps to understand and
manage a complex process. In this sense the tool we
propose allows to any user understand the process by
processing the information produced by change man-
agement system, but it also allows traceability of RFC
which is one of the main challenges in change man-
agement process pointed out by (Lahtela and Jantti,
2011).
3 TOOL DESCRIPTION
This tool has been designed in order to make a graph-
ical analysis of the temporal evolution of change re-
quests. When studying change requests, it is difficult
to detect abnormalities in their behavior if the analyst
is not using a graphical interface. So, for this rea-
son, it would not be possible to observe bottlenecks
or loops between different states.
On the other hand, this tool provides an evolutive
vision about a set of requests for change. Although
it is possible to perform an static analysis in a given
time, its main purpose is to show the temporal devel-
opment of an individual request or several requests.
3.1 Requirements: Analysis of RFC
Transitions and Times
The data used by this tool to analyze the processes is
read from a CSV format file, which has to be loaded
to the tool by the analyst. Besides, there is no need to
use a CSV file because the data could also be loaded
from a Change Management System or another data
source. The only requirement to be met is to provide
information about 5 fields:
• id: request identifier.
• time: arrival time to a certain stage.
• durationtime: time the change request remains in
the stage.
• origin: request origin stage.
• destination: request destination stage.
These fields can be extended in order to provide
more information about the request for change that is
being analyzed. For instance, some extra fields could
be type or priority.
3.2 Tool Design
As can be seen in the figure 1, the graphical user
interface is divided into three parts. The central
area is the most important one because it shows
most of the information available at a glance. The
footer contains information about a certain selected
stage. There is also a left column which contains the
controls of the view.
Central Area. The purpose of this area is to show the
progress made by the RFC between different stages.
Due to the need to be a dynamic tool, it has been im-
plemented a slider that allows the user to move for-
ward or backward in the analysis period. Moreover a
progress bar has been placed under the slider because
the user needs to know the total time that an individual
request for change is in a certain stage. This progress
bar is used by the analyst when they are filtering a
single RFC.
The starting time of the slider corresponds to the
first RFC and the ending time corresponds to the last
RFC. Both are variable and depend on the data. With
this slider, the user can control the execution time to
inspect the progress of the change requests in detail.
Talking about the progress bar, it is possible to filter
and analyze a single RFC. As seen in figure 2, the
progress bar is showing the time of the filtered RFC in
different colors depending on the stage. This progress
bar is only used when the analyst is filtering a single
change request. This is a very important feature of the
tool because allows the user to check at a glance if a
RFC is in a certain stage during a lot of time just by
using colors. There is also a coloured table which has
been developed to complement the temporal progress
bar.
By using the colors the analyst is allowed to
use this tool in a more visual way, making easier
the process of analysing requests for change and
detecting bottlenecks and loops.
Footer. The footer area shows the information of the
simulation in a certain stage. These data are very
important for knowing the behaviour of a change re-
quest. As figure 1 shows, if the user clicks on a stage,
they will be able to view information about the re-
quests that are on it, which is shown in tables with
different columns. The first one shows the id, priority
or type of a change request. The filter column shows
if the object is filtered or not. The user can also tog-
gle the checkbox to filter or unfilter. This checkbox
makes the filtering process easier. Furthermore, the
arrival time is the time a certain change request has
arrived to the selected stage. Finally, total duration
AToolfortheAnalysisofChangeManagementProcessesinSoftwareDevelopmentCycles
483
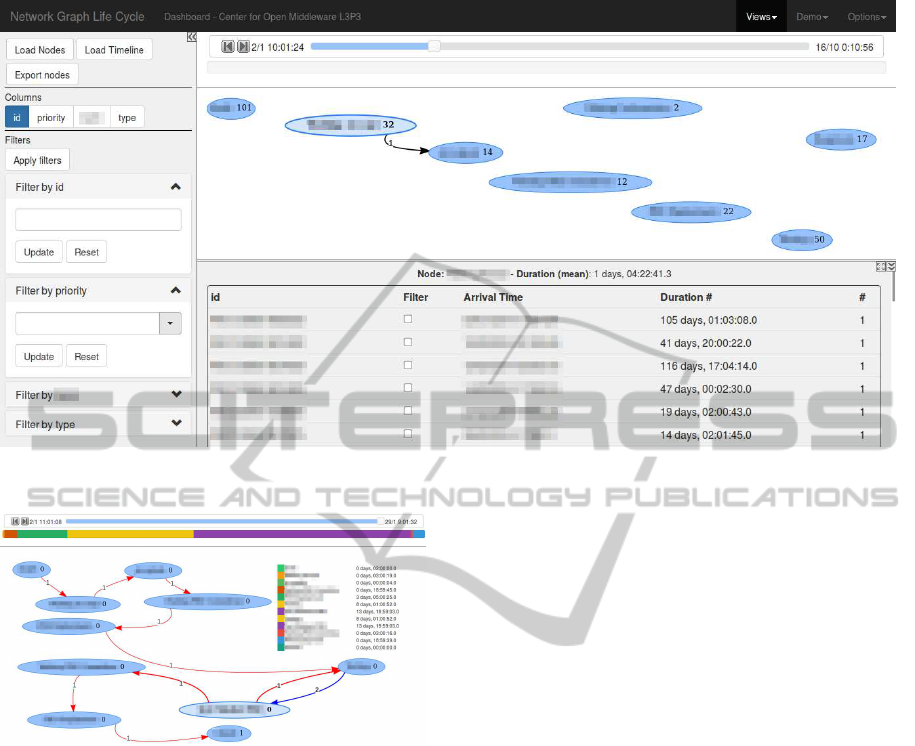
Figure 1: Tool overview.
Figure 2: Individual analysis.
field shows the mean duration time of all of the re-
quests in the selected stage.
The footer provides valuable and important
statistical information about the analysis and without
it, this tool would only be a node network.
Left Column. The left column, which is composed
by different buttons and text areas, has three different
parts which are used in order to configure the simula-
tion and load data.
The purpose of the import and export data buttons
is to import and export the data in the format previ-
ously seen in 3.1. These buttons placed in the left
column interact with the tables in the footer. For in-
stance, if the user selects the id column the id table
will be shown.
Moreover, the visualizer allows the user to filter by
id, type and priority. For instance, if the user is filter-
ing by id with ”RFC123456”, the visualizer will just
show that RFC. When the user adds an item, a green
button will appear in order to show what the user is
filtering. We have developed this because when the
analyst works with a huge amount of data, they can
simplificate the task by selecting an id or RFC prior-
ity.
Technology Used. We have used a Javascript based
library called Vis.js to draw the nodes and the con-
nections between them. Vis.js is a dynamic, browser
based visualization library which has been designed
to be easy to use and to handle large amounts of dy-
namic data. It is also possible to manipulate and in-
teract with the data with this library.
4 CONCLUSIONS
Monitoring, analyzing and improving the change pro-
cess is a difficult task. Organizations need to make
decisions in order to improve their efficiency. For this
reason, we have presented in this paper a graphical
tool that helps companies to detect problems in the
change process.
It is possible to analyze the change management
process with this tool based on historical information
retrieved from logs. Through the use of this informa-
tion, the user is able to analyze useful data in order to
improve the change management process and detect
problems such as bottlenecks, loops, irregularities or
processes that are longer than necessary in one stage.
As the data contains information about each process
and its origin, destination, arrival time and duration
ICEIS2015-17thInternationalConferenceonEnterpriseInformationSystems
484

time, it is possible to know why, when and where the
error has been produced. These problems could not
be easily detected without using this tool.
One of the main advantages of this tool is that it
can import and analyze the information from various
sources. Not only from CSV files, but from whatever
data source that met with the requirements in 3.1. Fur-
thermore, it is possible to use the tool with any pro-
cess that has a source, a destination and a series of
nodes or states for a temporal analysis.
As a future work, it will be implemented various
new features to provide more statistical information,
apart from the automatic detection of bottlenecks or
loops. On the other hand, with a previous knowl-
edge of the maximum time that a process can be in
a certain stage, the analyst could detect automatically
which process does not satisfy the requirements.
ACKNOWLEDGEMENTS
The authors would like to express their gratitude to
PRODUBAN who inspired and motivated this chal-
lenge as a real business case and provided all neces-
sary assistance to carry out this work.
REFERENCES
Lahtela, A. and Jantti, M. (2011). Challenges and prob-
lems in release management process: A case study. In
Software Engineering and Service Science (ICSESS),
2011 IEEE 2nd International Conference on. IEEE
pages 10-13
Danesh et al. (2011). Software release management chal-
lenges in industry: An exploratory study African
Journal of Business Management. Vol. 5, number 20,
pages 8050-8056
Keller, A. (2011). Automating the change management
process with electronic contracts E-Commerce Tech-
nology Workshops, 2005. Seventh IEEE International
Conference on. pages 99-107
AToolfortheAnalysisofChangeManagementProcessesinSoftwareDevelopmentCycles
485
