
Finding the Right Needles in Hay
Helping Program Comprehension of Large Software Systems
Ioana S¸ora
Department of Computer and Software Engineering,
University Politehnica of Timisoara, Timisoara, Romania
Keywords:
Reverse Engineering, Program Comprehension, Recommender System, Key Classes.
Abstract:
Maintenance of complex software systems can be done by software engineers only after they understand well
the existing code. Program comprehension is supported by documentation - either developer documentation
or reverse engineered. What is most often missing is a short document providing the new user with useful
information to start with - an executive summary. In this work we propose a tool to automatically extract such
a summary, by identifying the most important classes of a system. Our approach relies on techniques of static
analysis of dependencies and graph-based ranking. Experiments on a set of real systems show good results.
1 INTRODUCTION
Reverse engineering a large software system often
produces a huge amount of information, whose com-
prehension or further processing would take a long
time. Lets imagine that a class diagram has been re-
verse engineered from a system withhundreds or even
thousands of classes. Such a class diagram is of little
use when trying to understand the system in absence
of any documentation. Even when documentation is
available, it may be too detailed and scattered - such
as the one generated by javadoc from all the classes
and packages of the system. What is most often miss-
ing is a short document providing the new user with
useful information to start with - an executive sum-
mary.
A summary of a document can be obtained in
two ways: abstractive summarization or extractive
summarization, as it is usually classified in the the
field of language processing (Erkan and Radev, 2004).
Extractive summarization produces summaries by
choosing a subset of the sentences in the original
document. Abstractive summarization produces sum-
maries by rephrasing sentences in the original docu-
ment.
In the field of reverse software engineering, pro-
gram comprehension can be enhanced by both types
of summaries. Architecture reconstruction (Ducasse
and Pollet, 2009) is a form of abstractive summa-
rization, generating higher-level software abstractions
out of the primary software artifacts that have been
reverse engineered. The reconstructed architectures
are usually described by new abstract artifacts created
from the existing software artifacts. However, when
program comprehension is the first step of mainte-
nance or evolution of the system, extractive sum-
maries pointing directly to the important concrete
software artifacts of the real system are more useful.
There are several approaches trying to identify the
important software artifacts (classes, modules, func-
tions) from a software system. The input of this pro-
cess can be given by primary information extracted
either by static analysis (Osman et al., 2013), (Steidl
et al., 2012) or by dynamic analysis (Zaidman et al.,
2005). The techniques for identifying the key classes
are mostly based on webmining techniques (Zaidman
and Demeyer, 2008), network analysis (Steidl et al.,
2012), and more recently machine learning (Osman
et al., 2013), (Thung et al., 2014).
In this paper we propose a way to build extrac-
tive summaries of software projects by identifying the
most important classes of the project, enabling pruned
class-diagrams of the systems core. In order to be ef-
fective, the automatic tool support must propose a set
of candidates which is small and highly reliable. It
is more useful for a start in program comprehension
to be given a very short list of classes which are sure
to be from the relevant ones, instead a longer list of
candidates that probably contains some more relevant
classes but also a lot of classes which are not relevant.
Our approach of identifying the most important
classes of a software project is based on ranking them
129
¸Sora I..
Finding the Right Needles in Hay - Helping Program Comprehension of Large Software Systems.
DOI: 10.5220/0005465901290140
In Proceedings of the 10th International Conference on Evaluation of Novel Approaches to Software Engineering (ENASE-2015), pages 129-140
ISBN: 978-989-758-100-7
Copyright
c
2015 SCITEPRESS (Science and Technology Publications, Lda.)

with a graph-ranking algorithm which adapts Page-
Rank (Page et al., 1999). The key here for obtain-
ing a ranking which is indeed effective for the goal of
program comprehension is to use an adequate graph
model of the system. Section 2 describes our ap-
proach of modeling the structure of software systems
by static dependencies and the way we use this for
identifying the most important classes of the system.
Section 3 presents experimental results of applying
our approach to a set of relevant open-source projects
and discusses them by comparing with related work.
Section 4 draws the conclusions of this paper.
2 DETECTION OF KEY CLASSES
The goal of this work is to build extractive executive
summaries of software systems by identifying their
most important classes. In brief, we model the soft-
ware system as a graph and use PageRank to rank its
nodes corresponding to classes. A cut threshold is
later used to delimit the top ranked classes which are
the recommended summary.
2.1 The PageRank Algorithm
A graph-based ranking algorithm is a way of deciding
on the importance of a vertex within a graph, by tak-
ing into account global information computed from
the entire graph
PageRank (Page et al., 1999) is a graph-based
ranking algorithm made popular by its key contribu-
tion to the Web search technology, by providing a
Web page ranking mechanism.
The basic idea of the algorithm is that of voting
or recommendation. When one node links to another
one, it is considered that it gives a recommendation
(a vote) for that other node. The higher the number
of votes that are cast for a node, the higher the im-
portance of the node. Also, not all votes are equal:
the importance of the node casting the vote deter-
mines how important the vote itself is. It results that
the score associated with a node, reflecting its impor-
tance, is given by both the votes that are cast for it and
the scores of the nodes casting these votes.
Although the original PageRank definition (Page
et al., 1999) works on unweighted graphs, there are
subsequent versions that have adapted it to work as
well on weighted graphs.
Besides its well known usage in web search en-
gines, PageRank has been used in many other appli-
cations: in the bibliometrics field for citation ranking
and journal impact factors, and in the field of natural
language processing for unsupervised automatic sum-
marization of text (Erkan and Radev, 2004), (Mihal-
cea and Tarau, 2004)
In the field of software engineering, there have
been studies applying PageRank or other graph-based
ranking mechanisms to software entities: Coderank
(Neate et al., 2006) advocates the concept of calcu-
lating PageRank values for software artifacts such as
classes of a project. However, there is little experi-
mental validation that supports the claims about their
ability to help program comprehension by identifying
relevant components of real software systems. Com-
ponentrank (Inoue et al., 2005) uses PageRank values
for retrieving the most useful software components
from multiple software libraries. These most useful
components (components with the highest reuse po-
tential) from a library are these that are used by many
clients. Although presenting some similarities, this is
a different problem from that of retrieving the most
important classes of a software system: an important
class is one that is well connected with many other
important classes from the system, thus it both uses
and is also used be other classes.
Zaidman (Zaidman et al., 2005) uses another web
ranking algorithm, HITS, to identify key classes ei-
ther from traces obtained by dynamic analysis or by
coupling metrics obtained by static analysis. We
extensively compare their work with our approach
and results in the Section 3.3.2. Also (Steidl et al.,
2012) experiment with different algorithms for net-
work analysis in order to identify central classes of a
system. We also compare them with our results in the
Section 3.3.2.
2.2 Our Approach
2.2.1 Building the Right Model
The software system is modeled as a graph having as
nodes classes or interfaces. If an edge exists from
node A to node B, this means that node A recom-
mends node B as important. Applying the right strat-
egy for determining where and how to place the rec-
ommendation edges is the crucial element for the ef-
fectiveness of the ranking approach.
In our model, the recommendations derive from
the program dependencies identified by static analysis
with help of the model extractorsof the ART tool suite
(Sora, 2013). If A depends on B, this means both that
A gives a recommendation to B but also that B gives
a recommendation to A. We call the edge from A to
B a forward recommendation, while the edge from B
to A is a back recommendation.
The forward recommendation, resulting directly
ENASE2015-10thInternationalConferenceonEvaluationofNovelSoftwareApproachestoSoftwareEngineering
130

from a dependency, is obvious: a class which is used
by many other classes has good chances to be an im-
portant one, representing a fundamental data or busi-
ness model. But also the reverse is true: a class
which is using a lot of other important classes may
be an important one, such as a class containing a lot
of control of the application or an important front-
end class. If only the directed dependency would be
considered as a recommendation, then library classes
would rank very high while the classes containing the
control would remain unacknowledged. Thus the rea-
son for having back recommendations.
Recommendations also have weights. A class
is not necessarily recommending all its dependency
classes with an equal number of votes. It will give
more recommendation votes to those classes that of-
fer it more services. Thus recommendation weights
are derived from the type and amount of dependen-
cies.
Static dependencies in object oriented languages
are produced by various situations. There are differ-
ent classifications of the mechanisms that constitute
dependencies (Briand et al., 1999). In accordance
with these, we distinguish between following cate-
gories of dependencies between two classes or inter-
faces A and B :
• inheritance: A extends B
• realization: A implements B
• field: A has at least one member of type B
• member access: A member of B is accessed from
code belonging to A
• method call: A calls a method of B. We can fur-
ther distinguish if it is a static method call or a
method call on a class instance. Every distinct
method of B which is called is counted as a new
dependency.
• parameter: A method of A has at least one param-
eter of type B
• return type: A method of A has the return type B
• local variable: A local variable of type B is de-
clared in code belonging to A
• instantiation: An instance of B is code belonging
to A
• cast: A type-cast to B occurs in code belonging to
A
Two classes A and B can be at the same time in
several dependency relationships: for example, A can
have members of type B, but in the same time it can
have a method with parameters of type B and overall
it can call several different methods of B.
The strength of the recommendation is propor-
tional with the strength of the dependencywhich takes
into account both the number of dependency relation-
ships and the types of dependency relationships be-
tween the two classes.
In this work, we estimate the strength of a de-
pendency using an approach based on an ordering of
dependency types according to their relative impor-
tance. Establishing the relative importance of static
dependency types is a subject of empirical estimation
and different authors use different frameworks for this
(Briand et al., 1999). In this work, we continue to
use the ordering of dependency types used previously
in the context of architectural reconstruction by clus-
tering in (Sora et al., 2010). In summary, we take
as reference for the weakest type of dependencies the
local variables dependency type and assign it weight
1. On the next level of importance, level 2, we put
the dependency strength given by one distinct method
that is called. Usually several distinct methods of a
class are called, thus these weights will sum up to a
significant value. Also on level 2 are dependencies
generated from creating instances. Dependencies due
to parameters, return values or having a member de-
pendency is assigned weight 3 while inheritance and
realization have weights 4.
The weight of the forward recommendation from
A to B is given by the dependency strength of the cu-
mulated dependencies from A to B. The weight of the
back recommendation from B to A is a fraction F of
the weight of the forward recommendation from A to
B. We identified that, while a class is important if it
is both used by other classes and it is also using other
classes, the second argument should have a smaller
weight in the global reasoning, only a fraction F of
the dependency strength. We illustrate this idea with
the simple example presented in subsection 2.2.2 and
we also empirically investigate values for this fraction
in section 3.1.
2.2.2 A Simple Example
We illustrate the idea of our approach using as an ex-
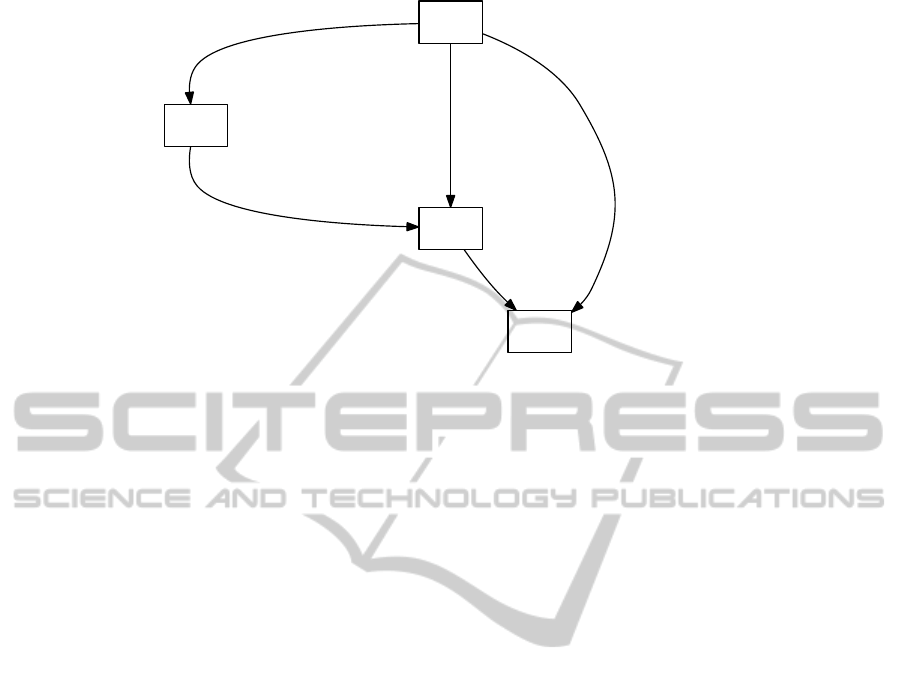
ample a simplified programstructure with four classes
A, B, C, D. Class A is the front-end component of the
application, B is the main business component, C a
helper, and D some utility or library class. Figure 1
depicts the dependencies between the 4 classes. Class
A has a member of type B, it instantiates objects of
type B and calls five different methods of class B.
Also, class A has a local variable of type C and in-
stantiates an object of type C. Class B has a mem-
ber of type C, has member functions with parameters
of type C, and calls 2 different methods of C. Both
classes A and C call one static method of class D.
FindingtheRightNeedlesinHay-HelpingProgramComprehensionofLargeSoftwareSystems
131
A
B
member, instantiate, calls 5 methods
C
localvar, instantiate
D
calls 1 methodmember, parameter, calls 2 methods
calls 1 method
Figure 1: Example: graph of program dependencies.
We use this simple example to explain the im-
portance of using a weighted dependency graph, tak-
ing into account the dependency strengths induced by
different dependency types, and also of using back-
recommendations.
In a first try, we consider the dependency graph
directed and unweighted. If PageRank is applied
on the directed graph of figure 1, without back-
recommendations, we obtain following the ranking:
D(0.41), C(0.29), B(0.16), A(0.12). This ranking
places the deepest classes on a top level, bringing the
utility class D on the top position. The utility class D
can be considered a library class with high reuse po-
tential. It is the goal of ComponentRank (Inoue et al.,
2005) to find such reusable components. However, D
is not the most important class of the system and not
so important for program comprehension. This shows
that simply applying PageRank on the directed graph
defined by the dependencies is not a valid method of
identifying the classes that are important for program
comprehension.
In a second try, back-recommendations are in-
cluded and the unweighted graph from figure 1 will
be completed with a reverse edge for every original
edge present. Applying PageRank on this new graph
results in a new ranking: A(0.29) C(0.29) B(0.21)
D(0.21). This order brings on top two classes of
medium importance (A and C), while ranking the key
class B as low as the utility class D.
In a third try, we introduce weights reflecting the
type and amount of dependencies, using the empir-
ical values defined in the previous section. Follow-
ing weights result: AB=15, AC=3, AD=3, BC=11,
CD=2. Back-recommendations are given a fraction
F of the weight of the forward recommendation. We
experiment with different values for F. If F=0 (no
back-recommendations) the ranking results D(0.38),
C(0.3), B(0.19), A(0.11), which is wrong since it
brings the utility class on top. If F=1, the ranking
is B(0.36), A(0.29), C(0.24), D(0.08). If F=1/2, the
ranking is B(0.34), C(0.29), A(0.24), D(0.11). These
last two rankings reflect very well the situation of B
being the most important class, while D plays only a
small role as a utility class. A and C are of medium
importance. Since this example is generic and small,
we cannot argue whether A should be ranked above C
or not.
More experiments on real-life systems are de-
scribed in Section 3.1 and they will show that PageR-
ank can be used as an effective means to identify
key classes for program comprehension if it is ap-
plied to a correct model of recommendations. We ar-
gue that this model has to take into account both the
strength of the dependencies and also include back-
recommendations, with a fraction 0 < F < 1 bringing
the best results.
3 VALIDATION
In order to validate the proposed ranking tool, we ap-
ply it on a set of relevant open source systems. We
run our tool that implements the ranking approach de-
scribed in section 2.2, using weighted recommenda-
tions, according to the type and amount of dependen-
cies as well as back-recommendations.
In all the experiments, we limit the examination of
the tool produced ranking to the top 30 ranked classes,
independent from the size of the system. We consider
that a percentage limit of 15% or even 10% of the
system size would result in candidate sets which are
too big for the purpose of the tool, that of facilitating
ENASE2015-10thInternationalConferenceonEvaluationofNovelSoftwareApproachestoSoftwareEngineering
132

an easy start in program comprehension.
Thus we have to experimentally prove that the
top 30 ranked classes are indeed the most important
classes of the analyzed systems.
Unfortunately, the identification of the most im-
portant classes of a system may be, up to a certain
degree, subjective to different opinions of different
experts. The reference solution will be the reduced
set resulting from the intersection of different expert
opinions. In order to validate the tool, we could do an
experiment asking different software experts to judge
the top rankings produced by the tool. This scenario
requires a big effort and, in the end, the objectivity of
our experts may be questionable.
We chose to rely for the validation of the tool out-
put on the comparison with reference solutions ex-
tracted from developers documentation. The kind of
developer documentation that is useful for our valida-
tion is usually found in documents described as “ar-
chitectural overview”, “core of the system”, “intro-
duction for developers”, etc. It may consist either in
pruned diagrams or even free text descriptions. Of
course, developers documentations may be outdated
or not accurate. In order to reduce these risks, we pre-
ferred as case studies systems that provide both devel-
opers documentation and documentation from other
sources. Some systems were subjects of other studies
in reverse engineering that provide us with informa-
tion about their structure. In this way we establish
unbiased reference solutions to compare the solutions
produced by our tool.
In the next subsection we present the detailed
analysis and discussion of two systems. We use
these systems to perform the empirical validation
of the value of fraction F representing the back-
recommendations.
Some more systems are then analyzed and pre-
sented in subsection 3.2.
In the last subsection 3.3 we discuss our results
and compare with related work.
3.1 Detailed Analysis of Two Case
Studies
In this subsection we present the detailed analysis and
discussion of two systems, JHotDraw and Ant. Both
are included in the Qualitas Corpus - a curated collec-
tion of software systems intended to be used for em-
pirical studies on code artifacts. These systems have
been also analyzed in other works and their structure
has been discussed by several sources, thus we can de-
fine as reference solution an intersection of different
expert opinions.
In this set of experiments we analyzed also
the influence of the back-recommendations, tak-
ing into accountthe following cases: no back-
recommendations (F=0), back-recommendations are
assigned the same strength as the forward recommen-
dations (F=1), back-recommendations are assigned
half of the strength of the corresponding forward rec-
ommendations (F=1/2) and back-recommendations
are assigned a quarter of the strength of the corre-
sponding forward recommendations (F=1/4).
3.1.1 Extracting the Key Classes of JHotDraw
JHotDraw
1
is a highly customizable graphic frame-
work for structured drawing editors. Its source code
and binaries are freely available.
We analyze here JHotDraw, release 6.0b.1. We
take advantage of the capabilities of our ART model
extractor tools (Sora, 2013) that can handle compiled
code, and directly feed it as input the
jhotdraw.jar
file from the binary distribution, which proves to con-
tain 398 implementation classes. The architecture of
the system is documented by its developers, the doc-
umentation provides a short description of the core
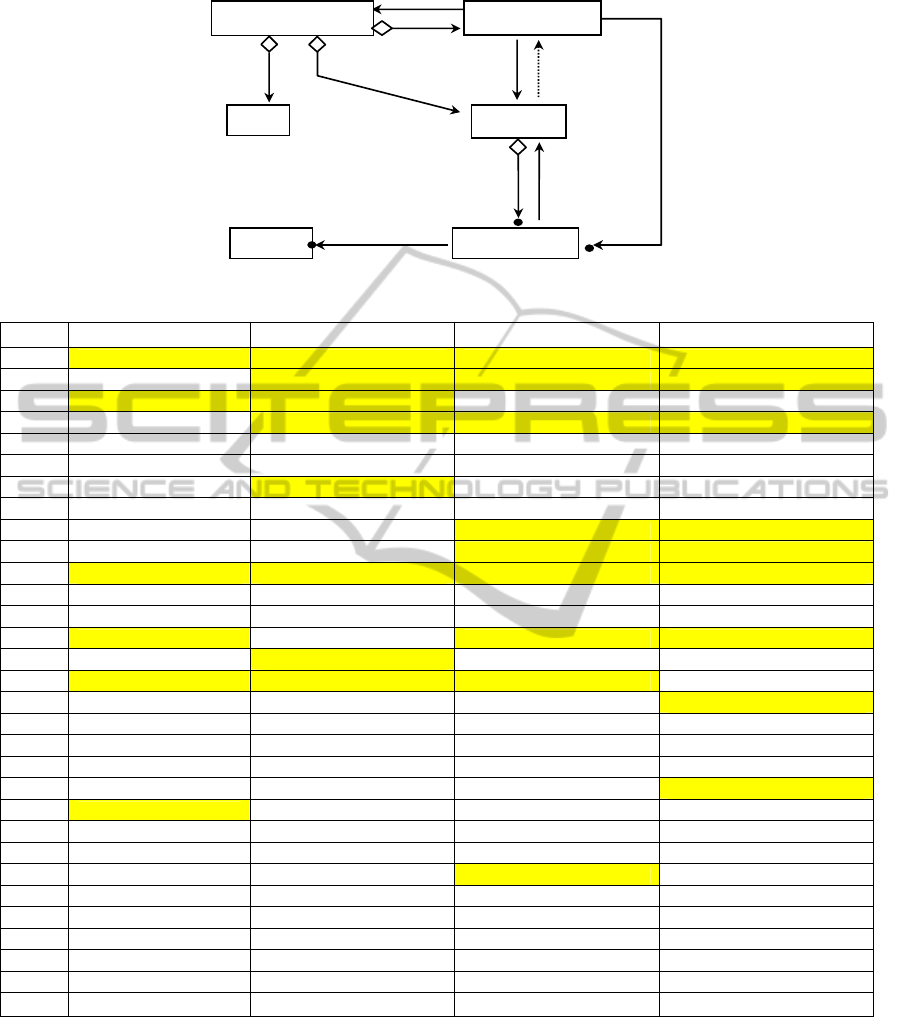
architectural classes and interfaces as depicted in Fig-
ure 2. This diagram is a massive simplification of the
JHotDraw framework, enumerating the most impor-
tant artifacts in the opinion of the system developers.
The case study of JHotDraw has been analyzed
also in (Gu´eh´eneuc, 2004), in order to produce a
more precise class diagram, in terms of relation-
ships, than the one provided by the authors of JHot-
Draw. We noticed a couple of classes considered im-
portant and added to the diagram:
DrawingEditor
,
StandardDrawingView
,
CompositeFigure
.
Thus we conclude that the set of important arti-
facts (classes and interfaces) for an executive sum-
mary of JHotDraw is formed by these pointed out
by the developers, completed with the three classes
added in the study of (Gu´eh´eneuc, 2004):
Figure
,
Drawing
,
DrawingView
,
DrawApplication
,
Tool
,
Handle
,
DrawingEditor
,
StandardDrawingView
,
CompositeFigure
. This set of 9 classes is further
considered the reference summary of the whole sys-
tem comprising 398 classes.
Figure 3 presents the top 30 ranked classes when
analyzing JHotDraw with our tool.
We can see that with F=0, only 6 out of the 9
classes of the reference set are found. Introducing
back-recommendations brings an improvement: with
F=1, 8 out of 9 classes are found, while with F=1/2
and F=1/4, all the 9 classes are found in the top 30
ranking.
1
http://www.jhotdraw.org/
FindingtheRightNeedlesinHay-HelpingProgramComprehensionofLargeSoftwareSystems
133
Drawing
Handle
Figure
Tool
DrawApplication DrawingView
handles
notification
selection
current
tool
figure
container
Figure 2: Core classes of JHotDraw described in the developers documentation.
F=0 F=1 F=1/2 F=1/4
1 Figure Figure Figure Figure
2 Storable DrawingView DrawingView DrawingView
3 DrawingView DrawingEditor FigureEnumeration FigureEnumeration
4 JHotDrawRuntimeExc DrawApplication DrawingEditor DrawingEditor
5 FigureEnumeration FigureEnumeration Undoable Undoable
6 StorableOutput Undoable StorableInput StorableInput
7 StorableInput Drawing StorableOutput StorableOutput
8 CollectionsFactory StorableInput CollectionsFactory CollectionsFactory
9 FigureChangeListener StorableOutput Drawing Drawing
10 FigureChangeEvent CollectionsFactory DrawApplication StandardDrawingView
11 Handle StandardDrawingView StandardDrawingView DrawApplication
12 ConnectionFigure ConnectionFigure ConnectionFigure ConnectionFigure
13 Connector DrawApplet Command Command
14 Drawing AbstractCommand Tool Tool
15 Undoable CompositeFigure AbstractCommand Connector
16 DrawingEditor Tool CompositeFigure Storable
17 Locator Command DrawApplet CompositeFigure
18 HandleEnumeration HTMLTextAreaFigure AbstractTool AbstractCommand
19 FigureAttributeConsta AbstractTool Connector AbstractTool
20 TextHolder JavaDrawApp HTMLTextAreaFigure FigureChangeListener
21 FigureVisitor TextFigure TextFigure Handle
22 Tool DesktopEventService ConnectionTool HandleEnumeration
23 Cursor ConnectionTool HandleEnumeration Locator
24 Painter MDIDesktopPane PolyLineFigure DrawApplet
25 PointConstrainer Connector Handle TextFigure
26 PaletteButton PolyLineFigure RelativeLocator ConnectionTool
27 PaletteListener PolygonFigure Locator PolyLineFigure
28 DrawingChangeEvent HandleEnumeration FigureChangeListener FigureAttributeConstant
29 ScalingGraphics RelativeLocator DesktopEventService HTMLTextAreaFigure
30 DoubleBufferImage LineConnection DecoratorFigure RelativeLocator
Found:
6/9 8/9 9/9 9/9
Figure 3: Top fragment of the ranking of JHotDraw classes.
By examining the classes that occupy top posi-
tions in all rankings, we notice the constant presence
of certain classes that were not included in the refer-
ence solution, so we manually analyzed them in order
to decide if their high ranking can be considered dan-
gerous false positives or if they should be rightfully
included in the set of key classes.
The interface
Connector
locates connection
points on a figure. A
Connector
can determine the
start or end points of a connection figure. The in-
terface
ConnectionFigure
respresents figures used
to connect connectors provided by
Figures
, in or-
der to compose a
Drawing
. Thus
Connector
and
ConnectionFigure
must be part of the set of key
ENASE2015-10thInternationalConferenceonEvaluationofNovelSoftwareApproachestoSoftwareEngineering
134

classes, although they are not included in the refer-
ence solution originated in the developers documen-
tation.
The interface
Command
represents actions that can
be executed and is implemented by 20 concrete com-
mand classes and is associated with command menus
and buttons. It is also an important part and should be
part of the set of key classes.
The interface
Storable
and the classes
StorableInput
and
StorableOutput
, although
being included in the utilities package, have an
important role to flatten and resurrect objects, the
Storable
interface is implemented by a number of
67 classes representing all concrete types of figures
and connectors handled by the graphical editor. It
is also the case of the
Undoable
interface, the base
for all undo types of actions. They are certainly
important classes, although they are not necessarily
to be included in the set of key classes describing the
architectural overview of JHotDraw.
We conclude the analysis of JHotDraw with fol-
lowing facts: if we use back-recommendations hav-
ing as weights a fraction F=1/2 or F=1/4 of the corre-
sponding forward recommendations, all the 9 classes
of the reference solution are found in the top 30 rank-
ing. Also, manual analysis of the other classes in-
cluded in the top ranking shows that they are impor-
tant classes and some of them must be actually in-
cluded in the set of key classes.
3.1.2 Extracting the Key Classes of Ant
Apache Ant
2
is a Java library and command-line tool
to compile, build, test and run Java applications. We
analyze release 1.6.1, feeding as input ant.jar contain-
ing the core part of ant. It contains 524 classes. A de-
veloper tutorial
3
indicates the following key classes
to understand the design of the Ant core:
Project
,
Target
,
UnknownElement
,
RuntimeConfigurable
,
Task
, as depicted in Figure 4. Besides these main
classes,
IntrospectionHelper
,
ProjectHelper2
and
ProjectHelperImpl
are mentioned in the doc-
umentation as important. Ant has been also analyzed
for the detection of key classes in (Zaidman et al.,
2005), with the same reference set mentioned in this
documentation .
Figure 5 presents the top 30 ranked classes when
analyzing Ant with our tool.
We can see that with F=0, only 6 out of the 8
classes of the reference set are found. Introducing
back-recommendations brings an improvement: with
F=1, 7 out of 8 classes are found, while with F=1/2
2
http://ant.apache.org/
3
http://codefeed.com/tutorial/ant
config.html
and F=1/4, all the 8 classes are found in the top 30
ranking.
The detailed analysis of JHotDraw and Ant vali-
dates our assumption, described on hand of the simple
example in Section 2.2.2, that back-recommendations
are needed but they should be assigned weaker
strengths than their forward recommendation coun-
terparts. Taking F=1/2 and F=1/4, all classes of the
reference set are found in the top 30 ranking for both
analyzed systems. In the case of JHotDraw, F=1/4
enables to get the last hit on position 21 compared to
F=1/2 where the last hit is found at position 25. In the
case of Ant, it is F=1/2 the value that allowsfinding all
classes in the top 18, while F=1/4 finds them in top 21.
In future work, more experiments could be done to
fine-tune the value of the back-recommendation frac-
tion F. In this work, the following experiments use the
value F=1/2.
3.2 More Experimental Results
We completed a series of experiments on an addi-
tional set of systems. In the experiments described
in this section we use the value F=1/2 for the back-
recommendations, as it resulted from the set of exper-
iments described in the previous subsection.
The analyzed systems are: JEdit, ArgoUML,
wro4j.
3.2.1 Analysis of JEdit
JEdit
4
is a cross platform programmer’s text editor
written in Java. We analyze the code of release 5.1.0,
with 1266 classes.
Developer documentation is available
5
and it
gives the following introductory overviewof jEdit im-
plementation: The main class of jEdit is
jEdit
, which
is the starting point for accessing various components
and changing preferences. Each window in jEdit is
an instance of the
View
class. Each text area you see
in a View is an instance of
JEditTextArea
, each of
which is contained in its own
EditPane
. Files are
represented by the
Buffer
class. The
Log
class is
used to print out debugging messages to the activity
log. Plugin developers have to extend
EBPlugin
.
In summary, the developers documentation point
out the following classes of interest:
jEdit
,
View
,
EditPane
,
Buffer
,
JEditTextArea
,
Log
,
EBMessage
. We take this set of 7 classes as the refer-
ence solution.
4
http://jedit.org/
5
http://community.jedit.org/cgi-bin/TWiki/view/Main/
JEditSourceCodeIntro
FindingtheRightNeedlesinHay-HelpingProgramComprehensionofLargeSoftwareSystems
135
RuntimeConfigurable
UnknownElement
Task
Target
Project
Figure 4: Core classes of Ant described in the developers tutorial.
F=0 F=1 F=1/2 F=1/4
1 Project Project Project Project
2 FileUtils Task Task Task
3 Location Path BuildException BuildException
4 BuildException BuildException Path Path
5 Task FileUtils FileUtils FileUtils
6 FilterSet Commandline Commandline Parameter
7 Target AbstractFileSet Parameter Commandline
8 ChainReaderHelper Execute AbstractFileSet Reference
9 ProjectComponent Parameter Execute Target
10 BuildEvent ProjectHelper2 Reference AbstractFileSet
11 RuntimeConfigurable Java Target Execute
12 Path Zip UnknownElement UnknownElement
13 Reference UnknownElement DirectoryScanner RuntimeConfigurable
14 FilterSetCollection DirectoryScanner ComponentHelper ComponentHelper
15 ComponentHelper ProjectHelperImpl ProjectHelper2 IntrospectionHelper
16 PropertyHelper Target IntrospectionHelper ProjectComponent
17 DataType DefaultCompilerAdapter ProjectHelperImpl DirectoryScanner
18 UnknownElement Reference RuntimeConfigurable ProjectHelperImpl
19 Parameter ComponentHelper ProjectComponent Location
20 Os Javadoc Zip BuildEvent
21 BuildListener IntrospectionHelper TokenFilter ProjectHelper2
22 Condition TokenFilter ModifiedSelector TarEntry
23 IntrospectionHelper Ant Javadoc ModifiedSelector
24 LineTokenizer Javac Javac Condition
25 JavaEnvUtils CommandlineJava DefaultCompilerAdapter EnumeratedAttribute
26 Watchdog MatchingTask Ant ZipShort
27 Commandline Rmic EnumeratedAttribute Resource
28 InputRequest FilterChain BuildEvent MailMessage
29 TimeoutObserver ModifiedSelector Java TokenFilter
30 AbstractFileSet ExecTask Rmic FileSelector
Found:
6/8 7/8 8/8 8/8
Figure 5: Top fragment of the ranking of Ant classes.
The top 30 classes in the ranking produced
by our tool are:
jEdit
,
View
,
JEditBuffer
,
Buffer
,
TextArea
,
Log
,
Interpreter
,
NameSpace
,
SimpleNode
,
GUIUtilities
,
EditPane
,
Token-
Marker
,
CallStack
,
ParserRuleSet
,
Misc-
Utilities
,
VFS
,
VFSBrowser PluginJAR
,
JEditTextArea
,
TextAreaPainter
,
VFSFile
,
Selection
,
Mode
,
Primitive
,
DisplayManager
,
Gutter
,
SearchAndReplace
,
EditBus
,
EBMessage
,
Parser
.
We can see that all the seven classes which are in
the reference are ranked in the top 30. This means
that our tool finds all the classes of the reference so-
lution, ranking them in the top 2.5% classes of the
ENASE2015-10thInternationalConferenceonEvaluationofNovelSoftwareApproachestoSoftwareEngineering
136

1266 examined. Out of these, six classes from the
reference set are ranked in the top 20. Actually, the
only class which did not make it into the top 20, class
EBMessage
, is not so much a core class but it is men-
tioned in the summary as important for plugin devel-
opers, being important only in this context. Four of
the classes in the reference set are found the top 10.
The first places of the ranking are also taken by the
most important classes.
3.2.2 Analysis of ArgoUML
ArgoUML
6
is a well-known open source UML mod-
eling tool. In this work we analyze its release 0.9.5,
having detailed architectural descriptions in Jason
Robbins’s dissertation
7
which created the fundamen-
tal layer for ArgoUML. The analyzed jar contains a
total of 852 classes.
As it is described in the architectural descrip-
tion, the kernel of ArgoUML focuses on representa-
tion and algorithms that support design critics, crit-
icism control mechanisms, checklists, the dynamic
ToDo list, clarifiers, non-modal wizards, design his-
tory, and a user model. The set of key classes
as identified from the architectural description is
composed by the following 12 classes:
Designer
,
Critic
,
CrUML
,
ToDoItem
,
ToDoList
,
History
,
ControlMech
,
ProjectBrowser
,
Project
,
Wizard
,
Configuration
,
Argo
.
Our analysis resulted in the following top 30
ranked classes:
ProjectBrowser
,
Designer
,
ToDoItem
,
ColumnDescriptor
,
CrUML
,
Project
,
UMLUserInterfaceContainer
,
TreeModel-
Prereqs
,
Critic
,
UMLAction
,
MMUtil
,
FigNode-
ModelElement
,
NavPerspective
,
Notation
,
Wizard
,
UMLModelElementListModel
,
PropPanel
,
Configuration
,
TableModelComposite
,
ToDo-
List
,
Argo
,
PropPanelModelElement
,
Parser-
Display
,
CodePiece
,
FigEdgeModelElement
,
UMLChecklist
,
ModuleLoader
,
Selection-
WButtons
,
ArgoEventPump
,
NotationName
.
We notice that 6 out of the 12 classes in the refer-
ence solution are ranked in the top 10, while 9 classes
are found in the top 20 and 10 classes are found in the
top 30.
3.2.3 Analysis of Wro4j
Wro4j
8
is an open source web resource optimizer
for Java. We have used release 1.6.3, contain-
ing 337 classes. The design overview
9
identifies
6
http://argouml.tigris.org
7
http://argouml.tigris.org/docs/robbins
dissertation
8
https://code.google.com/p/wro4j/
9
https://code.google.com/p/wro4j/wiki/DesignOverview
as the building blocks of wro4j the following ele-
ments: Model, Locators, Processors and WroMan-
ager. The model is a data structure containing in-
formation about client resources and how they are
grouped. The class holding the model is
WroModel
and is used by
WroManager
to identify which re-
sources should be merged and processed. The cre-
ation of the model is a responsibility of a factory inter-
face called
WroModelFactory
. Locators are used to
retrieve the resources from many possible locations,
interface
uriLocator
represents a locator. The actual
resource processing is done by the resource proces-
sors. A processing can be any kind of transformation.
There are two types of processors: PreProcessors, ex-
ecuted on each resource before it is merged with other
resources from the Group, and PostProcessors, exe-
cuted on the post merge phase.
The classes that are mentioned in the de-
sign overview as important for understanding
the design of the system, and which are further
considered as the reference solution in our exper-
iment, are the following 12 classes:
WroModel
,
WroModelFactory
,
Group
,
Resource
,
WroManager
,
WroManagerfactory
,
ResourcePreProcessor
,
ResourcePostProcessor
,
uriLocator
,
uriLocatorFactory
,
WroFilter
,
resourceType
.
The first 30 classes as ranked by our tool
are, in order:
WroManager
,
Resource
,
Wro-
Configuration
,
BaseWroManagerFactory
,
ResourcePreProcessor
,
WroTestUtils
,
WroUtil
,
WroModelFactory
,
InjectorBuilder
,
Resource-
Type
,
Context
,
HashStrategy
,
Resource-
PostProcessor
,
WroModel
,
WroFilter
,
Wro-
RuntimeException
,
ProcessorDecorator
,
UriLocatorFactory
,
WroManagerFactory
,
CacheStrategy
,
PreProcessorExecutor
,
ReadOnlyContext
,
LifecycleCallbackRegistry
,
Injector
,
LifecycleCallback
,
Wildcard-
ExpanderModelTransformer
,
ResourceWatcher
,
DefaultWroModelFactoryDecorator
,
Group
,
UriLocator
.
We observe that 5 out of the 12 classes in the ref-
erence solution are found in the top 10 ranked, while
10 classes are found in the top 20 and all 12 classes
are found in the top 30.
3.3 Discussion and Comparison with
Related Work
3.3.1 Summary of Experimental Results
In table 1 we summarize the results obtained in our
experiments. For each one of the five analyzed sys-
tems, we represent in this table the raw data describ-
FindingtheRightNeedlesinHay-HelpingProgramComprehensionofLargeSoftwareSystems
137
Table 1: Experimental results summary.
JHotDraw Ant jEdit ArgoUML wro4j
System size 398 524 1266 852 337
Reference set 9 8 7 12 12
Hits in Top 10 5 2 4 6 5
Hits in Top 15 7 5 5 6 8
Hits in Top 20 8 8 6 9 10
Hits in Top 30 9 8 7 10 12
Execution time 1 min 2 min 3 min 2.5 min 1 min
ing it: its size, the size of the reference solution, the
number of classes found if the cut threshold is placed
after the first 10, 15, 20 or respectively the first 30
ranked classes. The execution time includes both the
analysis of dependencies and building the model of
the system and the applying of the ranking.
We compute the recall and precision for our ap-
proach, defined as in (Zaidman and Demeyer, 2008):
The recall, showing the techniques retrieval
power, is computed as the percentage of key classes
retrieved by the technique versus the total number of
key classes present in the reference set.
The precision, showing the techniques retrieval
quality, is computed as the percentage of key classes
retrieved versus the total size of the result set.
Table 2 presents the average values of recall and
precision computed from our experimental data con-
cerning the five analyzed systems.
Table 2: Evaluation summary.
Precision Recall
Top 10 44% 45%
Top 15 42% 65%
Top 20 41% 86%
Top 30 30% 96%
We consider this a good result, since the mea-
sured recall guarantees the user a good start for pro-
gram comprehension, having assured two thirds of the
relevant classes by examining a very small number
of classes (only 10-15 classes), independently on the
size of the whole system. Also, in case of 4 systems
out of the 5 analyzed, all the relevant classes have
been found in the top 30.
The precision values in our experiments are disad-
vantaged by the very small size of the reference solu-
tion, which is in average 10 classes. However, we did
not add further classes to these reference sets, in order
to keep them fair by avoiding subjectivity. Also, while
in most systems it would be difficult to rank with pre-
cision all classes, this reduced top set is that which
is unanimously agreed as the most important. On the
other hand, a user which uses our tool to analyze a
new system does not know the exact size of this top
set. He or she will use the tool with the expectation
to find the top 10 or top 20 classes. If we examine the
top fragments of the rankings produced by the tool,
we notice there several classes that are certainly not
irrelevant, although they were not included in the ref-
erence top set.
In our opinion, program comprehension is effec-
tively supported by the tool in the following scenario:
the tool identifies a small number of classes as key
classes. These classes give the starting points for the
examination of the system by a software engineer do-
ing maintenance or evolution activities. For practi-
cal effectiveness, most often is not worth to move the
cut threshold below the top 20 ranked classes, due to
the increased effort of manual investigation. The very
short and general executive summary of the system is
quickly and easy retrieved in this top set. After get-
ting this executivesummary, the user can continue the
analysis tasks either by parsing the documentation,
beginning from the discovered key classes, or he/she
may apply other techniques such as feature localiza-
tion (Dit et al., 2013) to track more localized areas of
interest.
3.3.2 Comparison with Related Work
Zaidman (Zaidman and Demeyer, 2008), (Zaidman
et al., 2006), (Zaidman et al., 2005), uses another
graph-ranking algorithm, HITS, in order to detect key
classes of a software system. They combine this web-
mining technique with dynamic and static analysis,
and perform experiments on two systems. With dy-
namic analysis they attain an average recall of 92%
and precision 46%. However, a major drawback of
this approach is that dynamic analysis relies very
much on the user finding good execution scenarios. It
also presents scalability issues and has a high execu-
tion time (1h45). Zaidman also combined this web-
mining technique with static analysis but concluded
that the static analysis was not able to achieve a rea-
sonable precision and recall. Here their best reported
results were an average recall of 50% and precision
8%, while the execution time is still high (over 1
hour).
ENASE2015-10thInternationalConferenceonEvaluationofNovelSoftwareApproachestoSoftwareEngineering
138

In our work we have proven that static analysis
can be used to successfully and efficiently identify
key classes, our results near the values obtained by
(Zaidman and Demeyer, 2008) with dynamic analy-
sis, while the execution time in our case is just a cou-
ple of minutes. We think that a major enabling fac-
tor for our positive result here is our recommendation
model, which takes into account all possible types of
static dependencies with appropriate weights, while
Zaidman uses coupling metrics that take into account
only method calls.
Another approach that starts from static analysis
to retrieve important classes of a system is described
in (Steidl et al., 2012). Their algorithm calculates
a centrality index for the nodes of the dependency
graph obtained by static analysis. They performed an
empirical study to find the best combination of cen-
trality measurement of dependency graph. They used
as baseline for validation of results opinions of sev-
eral software developers. They found out that cen-
trality indices work best on an undirected dependency
graph including information about inheritance, pa-
rameter and return dependencies. Using the Markov
centrality leads to the best results, with a precision
between 60% and 80% in the top 10 recommendation
set. Their experiments were performed on a set of
4 systems. However, they do not compute the recall
of their method, nor do they mention the members
or the sizes of the reference sets. From the data pre-
sented, one could conclude that the baseline sets for
each system were larger, being reunions of different
expert opinion instead of intersection of such, result-
ing in more that 10 classes in the baseline. Theses
larger baseline solutions may have favored the count
of hits in the top 10, as opposed to the smaller refer-
ence solutions used in our experiments. We appreci-
ate that the retrieval power of this technique is similar
with ours.
Another work on condensing class diagrams is
presented in (Osman et al., 2013) and uses a very dif-
ferent approach, based on machine learning. They use
design metrics extracted from available forward de-
sign diagrams to learn and then to validate the quality
of prediction algorithms. Nine small to medium size
open source case studies are analyzed, taking as base-
line available forward design diagrams which contain
from 11 to 57 classes, representing between 4% and
47% of the project size. A follow-up of their work,
(Thung et al., 2014) uses machine learning combin-
ing design metrics and network metrics in the learn-
ing process. Introducing network metrics besides the
design metrics improves their results by almost 10%.
However, in (Thung et al., 2014) network metrics and
design metrics are computed as distinct and indepen-
dent attributes and used in the learning process. In our
approach, the network metric (PageRank) is adapted
to be computed on the weighted graph resulting after
the design metrics (measuring dependency strengths
and coupling) are applied, and thus we believe that
the concept of recommendationis better adapted to its
particular purpose. It will be very interesting to com-
pare the results of this approach with ours, although
difficult since the results are discussed only in terms
of the particular metric Area Under the Receiver Op-
erating Characteristic Curve (AUC).
4 CONCLUSIONS
Being able to quickly obtain an executive summary
formed by the most important classes of a software
system is essential for a good and easy start in a pro-
gram comprehension activity.
In this paper, we propose a method of obtaining
such summaries by applying a ranking algorithm on a
graph built by static analysis.
The key for the effectiveness of our approach is
how the graph is built: it takes into account all types
of static dependencies between classes, but weighted
according to the relative importance given by the de-
pendency type and number of occurrences. Also, it
is important to have edges for both forward and back-
ward recommendations. Future work may experiment
more with the empirical values of the weights that are
used here, also investigating whether the dependency
model could be simplified by eliminating certain de-
pendency types without affecting the ranking result.
The experiments done on a set of systems show
good results. All systems chosen as case-studies
are representative open source real life systems, their
sizes ranging from 337 to 1266 classes. Independent
from the size of the system, almost all (a recall of
96%) of the key classes classes forming the executive
summary have been found among the top 30 highest
ranked classes. Two thirds of the key classes (a re-
call of 65%) are often found even in the top 15 high-
est ranked classes. This proves the practical effec-
tiveness of our tool, which gives the user a good start
for program comprehension, providing him easy and
quickly with a trustworthy and short recommendation
set including the key classes which form the executive
summary of the system.
REFERENCES
Briand, L., Daly, J., and Wust, J. (1999). A unified frame-
work for coupling measurement in object-oriented
FindingtheRightNeedlesinHay-HelpingProgramComprehensionofLargeSoftwareSystems
139

systems. Software Engineering, IEEE Transactions
on, 25(1):91–121.
Dit, B., Revelle, M., Gethers, M., and Poshyvanyk, D.
(2013). Feature location in source code: a taxonomy
and survey. Journal of Software: Evolution and Pro-
cess, 25(1):53–95.
Ducasse, S. and Pollet, D. (2009). Software architecture re-
construction: A process-oriented taxonomy. Software
Engineering, IEEE Transactions on, 35(4):573–591.
Erkan, G. and Radev, D. R. (2004). Lexrank: Graph-based
lexical centrality as salience in text summarization. J.
Artif. Intell. Res.(JAIR), 22(1):457–479.
Gu´eh´eneuc, Y.-G. (2004). A reverse engineering tool for
precise class diagrams. In Proceedings of the 2004
Conference of the Centre for Advanced Studies on
Collaborative Research, CASCON ’04, pages 28–41.
IBM Press.
Inoue, K., Yokomori, R., Yamamoto, T., Matsushita, M.,
and Kusumoto, S. (2005). Ranking significance of
software components based on use relations. Software
Engineering, IEEE Transactions on, 31(3):213–225.
Mihalcea, R. and Tarau, P. (2004). Textrank: Bringing order
into texts. In Lin, D. and Wu, D., editors, Proceedings
of EMNLP 2004, pages 404–411, Barcelona, Spain.
Association for Computational Linguistics.
Neate, B., Irwin, W., and Churcher, N. (2006). Coderank: a
new family of software metrics. In Software Engineer-
ing Conference, 2006. Australian, pages 10 pp.–378.
Osman, M. H., Chaudron, M. R. V., and Putten, P. v. d.
(2013). An analysis of machine learning algorithms
for condensing reverse engineered class diagrams. In
Proceedings of the 2013 IEEE International Confer-
ence on Software Maintenance, ICSM ’13, pages 140–
149, Washington, DC, USA. IEEE Computer Society.
Page, L., Brin, S., Motwani, R., and Winograd, T. (1999).
The pagerank citation ranking: Bringing order to the
web. Technical Report 1999-66, Stanford InfoLab.
Previous number = SIDL-WP-1999-0120.
Sora, I. (2013). Unified modeling of static relationships be-
tween program elements. In Maciaszek, L. and Filipe,
J., editors, Evaluation of Novel Approaches to Soft-
ware Engineering, volume 410 of Communications
in Computer and Information Science, pages 95–109.
Springer Berlin Heidelberg.
Sora, I., Glodean, G., and Gligor, M. (2010). Soft-
ware architecture reconstruction: An approach based
on combining graph clustering and partitioning. In
Computational Cybernetics and Technical Informatics
(ICCC-CONTI), 2010 International Joint Conference
on, pages 259–264.
Steidl, D., Hummel, B., and Juergens, E. (2012). Using net-
work analysis for recommendation of central software
classes. In Reverse Engineering (WCRE), 2012 19th
Working Conference on, pages 93–102.
Thung, F., Lo, D., Osman, M. H., and Chaudron, M.
R. V. (2014). Condensing class diagrams by analyz-
ing design and network metrics using optimistic clas-
sification. In Proceedings of the 22Nd International
Conference on Program Comprehension, ICPC 2014,
pages 110–121, New York, NY, USA. ACM.
Zaidman, A., Calders, T., Demeyer, S., and Paredaens, J.
(2005). Applying webmining techniques to execution
traces to support the program comprehension process.
In Software Maintenance and Reengineering, 2005.
CSMR 2005. Ninth European Conference on, pages
134–142.
Zaidman, A. and Demeyer, S. (2008). Automatic identifica-
tion of key classes in a software system using webmin-
ing techniques. Journal of Software Maintenance and
Evolution: Research and Practice, 20(6):387–417.
Zaidman, A., Du Bois, B., and Demeyer, S. (2006). How
webmining and coupling metrics improve early pro-
gram comprehension. In Program Comprehension,
2006. ICPC 2006. 14th IEEE International Confer-
ence on, pages 74–78.
ENASE2015-10thInternationalConferenceonEvaluationofNovelSoftwareApproachestoSoftwareEngineering
140
