
The mqr-tree for Very Large Object Sets
Wendy Osborn and Marc Moreau
Department of Mathematics and Computer Science, University of Lethbridge,
4401 University Drive West, Lethbridge, Alberta, T1K 3M4, Canada
Keywords:
Spatial Access Methods, Very Large Object Sets, Performance.
Abstract:
This paper presents an evaluation of the mqr-tree for indexing a database containing a very large number
of objects. Many spatial access methods have been proposed for handling either point and/or region data,
with the vast majority able to handle a limited number of instances of these data types efficiently. However,
many established and emerging application areas, such as recommender systems, require the management
and indexing of very large object sets, such as a million places of interest that are each represented with a
point. Using between one and five million points and objects, a comparison of both index construction and
spatial query evaluation is performed versus a benchmark spatial indexing strategy. We show that the mqr-tree
achieves significantly lower overlap and overcoverage when used to index a very large collection of objects.
Also, the mqr-tree achieves significantly improved query processing performance in many cases. Therefore,
the mqr-tree is a significant candidate for handling very large object sets for emerging applications.
1 INTRODUCTION
Many applications exist that store and manipulate
spatial data such as objects, points and lines. A
spatial database (Samet, 1990; Shekhar and Chawla,
2003; Rigaux et al., 2001) contains a large collec-
tion of objects that are located in multidimensional
space. For example, the Geological Survey of Canada
maintains a repository of spatial data for many geo-
science applications (Geological Survey of Canada,
2006), while the Protein Data Bank (Research Collab-
oratory For Structural Bioinformatics, 2004) contains
many three-dimensional protein structures. More re-
cent applications that utilize spatial data include rec-
ommender systems such as a mobile tourist informa-
tion provider (Hinze et al., 2009; Osborn and Hinze,
2014). Recommender systems must fetch information
for a user on their mobile divide based on their chang-
ing current location. All of the above applications
must manage a significantly large amount of data.
Regardless of the application that utilizes spatial
data, an important issue in spatial data management
is the ability to efficiently retrieve a subset of objects
from these very large data sets based on their location
by using a spatial access method (i.e., spatial index).
Many spatial access methods have been proposed in
the literature ((Nievergeltet al., 1984; Guttman, 1984;
Sellis et al., 1987; Beckmann et al., 1990; Kamel
and Faloutsos, 1994; Berchtold et al., 1996; Koudas,
2000), see (Gaede and G¨unther, 1998; Rigaux et al.,
2001; Shekhar and Chawla, 2003) for comprehen-
sive surveys). Most proposed spatial access methods
are approximation techniques. They manage objects
of arbitrary shape by utilizing for each a minimum
bounding rectangle (MBR), which estimates the ex-
tent of the object over all of its dimensions. The min-
imum bounding rectangle also works well for point
data (a minimum bounding rectangle of zero area). In
addition, the minimum bounding rectangles are also
used to approximate regions of space that contain ob-
jects. This is done in a hierarchical fashion. The
use of minimum bounding rectangles allows for faster
testing and filtering of objects that will not qualify for
a spatial query, such as a region query or point query.
However, the use of minimum bounding rectan-
gles in approximation-based methods also leads to
some issues. The first is the coverage of whitespace
by the index (known as overcoverage). The second is
the multiple overlap of the same region of space by
many minimum bounding rectangles. Both issues can
lead to unnecessary searching in the index structure
for objects that qualify for region and point queries.
These issues may be exacerbated when dealing with
a significantly large number of spatial objects - say,
in the millions. Therefore, the evaluation of spatial
access methods with very large object sets is required
to ensure that the efficient retrieval and querying of
spatial data is still being accomplished.
367
Osborn W. and Moreau M..
The mqr-tree for Very Large Object Sets.
DOI: 10.5220/0005463203670373
In Proceedings of the 17th International Conference on Enterprise Information Systems (ICEIS-2015), pages 367-373
ISBN: 978-989-758-096-3
Copyright
c
2015 SCITEPRESS (Science and Technology Publications, Lda.)

A
x
= B
x
A
x
> B
x
A
y
= B
y
A
y
> B
y
Placement
0 0 0 0
SW
0 0 1 0
SW
0 0 0 1
NW
1 0 0 1
NW
0 1 0 0
SE
1 0 0 0
SE
0 1 0 1
NE
0 1 1 0
NE
1 0 1 0
EQ
Figure 1: Relative orientation of A with respect to B.
A recently proposed spatial access method, the
mqr-tree (Moreau et al., 2009; Moreau and Osborn,
2012), focuses on minimizing overcoverageand over-
lap when indexing arbitrary objects, while keeping
space utilization at 50% or more. In addition to ef-
ficiently handling objects of non-zero area, the mqr-
tree was shown to achieve zero overlap when solely
indexing point data. This leads to point queries that
can be executed without the need to search the same
regions of space several times.
Therefore, we investigate further the ability of the
mqr-tree to efficiently index a significantly larger set
of objects and to provide a means to efficiently per-
form region and point queries on a very large ob-
ject set. A comparison versus a benchmark strat-
egy shows that: 1) the mqr-tree achieves significantly
lower overlap and overcoverage, and 2) the mqr-tree
also achieves performance improvements when used
to execute region and point queries. This makes the
mqr-tree a significant candidate for indexing the very
large object and point sets required for spatial appli-
cation, and in particular emerging applications such
as recommender systems.
This paper proceeds as follows. Section 2 presents
some background information on the mqr-tree. Sec-
tion 3 overviews the factors that affect the perfor-
mance of spatial access methods. Section 4 presents
the framework and results of our performance eval-
uation. Finally, Section 5 concludes this paper and
provides some directions of future research.
2 BACKGROUND
In this section, we present some background on the
mqr-tree (Moreau et al., 2009; Moreau and Osborn,
2012) approximation-based spatial access method.
Due to space limitations, more details the insertion
and region search strategies can be found in (Moreau
and Osborn, 2012).
The mqr-tree is a hierarchical spatial access
method. Unlike other proposed hierarchical spatial
access methods (Nievergelt et al., 1984; Guttman,
1984; Sellis et al., 1987; Beckmann et al., 1990;
Kamel and Faloutsos, 1994; Berchtold et al., 1996;
Koudas, 2000), the mqr-tree utilizes two-dimensional
nodes. These nodes allow spatial objects and points
to be inserted in a way that maintain the spatial rela-
tionships between them and exploit them when per-
forming spatial queries. Both the minimum bounding
rectangles that represent objects and those covering
regions that contain objects are organized in the same
manner. Another difference between other proposed
structures and the mqr-tree is that the mqr-tree is not a
balanced data structure. However, the cost in balance
is made up by significant savings in other cost factors,
such as overcoverage and overlap (see Section 3).
The relative placement of a minimum bounding
rectangle with respect to other minimum bounding
rectangles in the mqr-tree is determined by using the
centroids of their corresponding minimum bounding
rectangles. Figure 1 depicts the defined relationships,
where A refers to the centroid of a new minimum
bounding rectangle, and B refers to the centre of a
node region that contains other objects. The orienta-
tions (NE, SE, SW, NW) are defined to include cen-
troids that fall on the axes (E, S, W, N, respectively).
Also, an equals (EQ) orientation is included, to han-
dle two centroids that overlap.
Figure 2 depicts the two-dimensional layout of a
node. A node contains 5 locations, each of which
correspond to one of the orientations (NE, SE, SW,
NW, EQ) defined above. Each location can contain a
pointer to either an object or another node. A node
must have at least two locations that reference either
an object or a subtree. The origin of the node is its
centre. The centre is defined by the centroid of the
minimum bounding rectangle for the node (called the
node MBR). A node MBR contains the minimum
bounding rectangles for all objects and subtrees that
can be reached from the node. As objects are added
to and removed from the node, the node MBR is ad-
justed to accommodate the new and removed objects.
Also depicted in Figure 2 are three objects that are
indexed by the node. The node MBR is depicted by
the dashed box. Object 1 is located in the NW loca-
tion of the node because its centroid is located north-
west of the centroid for the node MBR. Similarly, the
centroid of Object 2 is located northeast of the cen-
troid of the node MBR, so it is place in the NE lo-
cation of the node. Finally, the centroid of Object 3
is located directly south of the centroid of the node
MBR, so it is placed in the SE location in the node.
Figure 3 (from (Osborn and Hinze, 2014)) de-
picts an mqr-tree that contains points representing
a selection of locations in New Zealand. The root
node, which is highlighted in bold lines on the in-
ICEIS2015-17thInternationalConferenceonEnterpriseInformationSystems
368
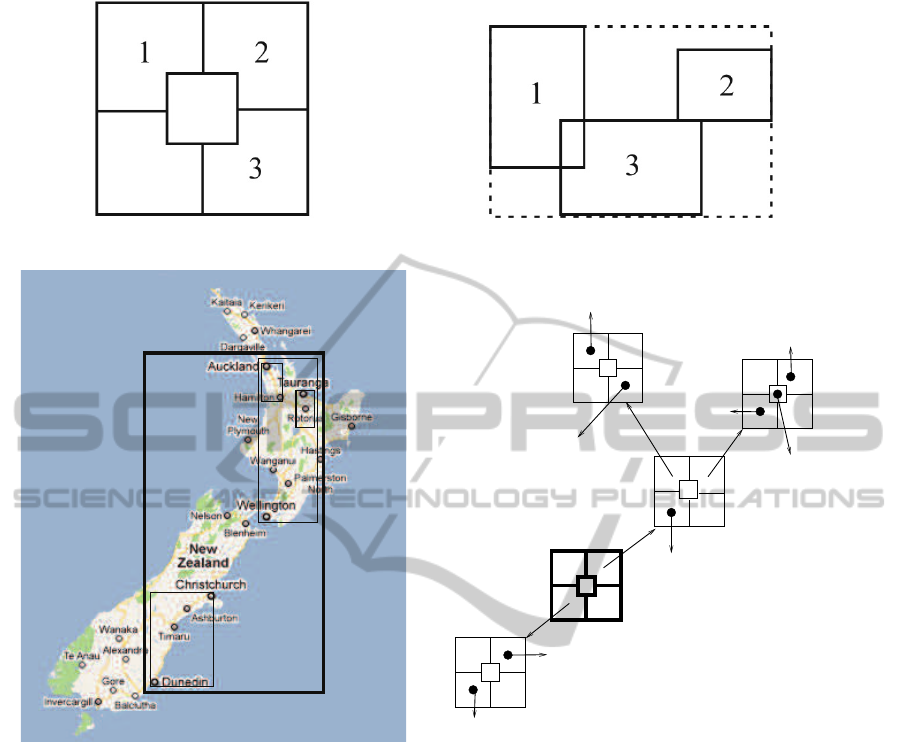
Figure 2: Node with Objects.
Christchurch
Bay of Plenty
Dunedin
Taupo
Rotorua
Auckland
Hamilton
Wellington
Figure 3: mqr-tree example.
dex, represents the node MBR that encompasses all
other minimum bounding rectangles on the map (and
also highlighted in bold lines). The root node refer-
ences two minimum bounding rectangles with corre-
sponding subtrees,which contain points for commu-
nities on the North Island and South Island respec-
tively. Since the South Island subtree is southwest of
the centroid of the root node MBR, it is placed in loca-
tion SW. Similarly, the North Island subtree is north-
east of the centroid of the root node MBR, and there-
fore is placed in location NE. Dunedin is located SW,
and Christchurch is located NE (respectively) of the
node MBR containing them, and therefore are placed
SW and NE (respectively) in the node. Rotorua over-
laps the centre of the node MBR containing it, and
is placed in location CTR. Finally, the node contain-
ing Wellington also contains references to two other
subtrees.
3 PERFORMANCE FACTORS
In an approximation-based spatial access method, the
performance of any spatial query is affected by differ-
ent factors, including the tree height, space utilization
in the nodes, overcoverage and overlap. We discuss
these performance factors below:
• Average space utilization is the average number of
minimum bounding rectangles per node. Ideally,
the higher the number of minimum bounding rect-
angles per node, the lower the number of nodes
and height of the tree.
• Overcoverage is the amount of whitespace (i.e.,
areas not containing any objects) containin in the
minimum bounding rectangles of a spatial index.
Ideally, this value should be very low. A higher
overcoverage will result in searches along paths
in the index that will lead to no objects.
Themqr-treeforVeryLargeObjectSets
369

Table 1: Indexing Object Data
#objs index #nodes height coverage overcoverage overlap sp. util
mqr-tree 576012 11(14) 1119513278 76605868 51278457 55
1,000,000
R-tree 392198 10 4082116307 808197010 793017305 70
mqr-tree 1155177 11(14) 2341881055 153502467 102799437 55
2,000,000
R-tree 783755 10 9551639075 1896621703 1868199636 71
mqr-tree 1730886 12(16) 3600613232 230207810 154241842 55
3,000,000
R-tree 1176238 11 13618377689 2641489767 2596676029 71
mqr-tree 2304733 12(16) 4877583581 306173488 205199188 55
4,000,000
R-tree 1568264 11 19244154175 3817950567 3759439628 71
mqr-tree 2883025 12(16) 6183271262 383337570 256843983 55
5,000,000
R-tree 1959231 11 30882512659 6256387504 6188027877 71
• Overlap is the amount of space covered by two
or more minimum bounding rectangles. Ideally,
overlap should minimal or even zero. Significant
amounts of overlap will cause searches to traverse
multiple paths that cover the same region of space,
with many of those times being unnecessary and
leading to no objects.
• Height is the number of nodes from the root to the
leaf node on the longest path of the index. Ide-
ally, the index should be shallow so that all paths
to the leaf nodes require few disk accesses. How-
ever, shorter paths may result in trees with higher
overlap and overcoverage.
4 EVALUATION
In this section, we present the methodology and re-
sults of our empirical evaluation of the mqr-tree for
very large data sets. We compare the mqr-tree against
the R-tree (Guttman, 1984), which is a benchmark for
spatial indexing. We first present the overall frame-
work for evaluation, the makeup of the data sets, and
the evaluation criteria. This is followed by the results
of our evaluation on these data sets.
4.1 Data Sets
All of our evaluations were performed using gener-
ated data sets. Altogether, 25 data sets were created -
15 for constructing the indices, and an additional 10
for evaluating the search performance of the mqr-tree.
We used generated data, instead of real-world data, so
that we could control the distribution of the data and
size of the objects in our preliminary evaluations.
We first describe the files for index creation, then
we describe the files for searching.
• Five data files contain between 1,000,000 and
5,000,000 points that were uniformly distributed
across a region that was 10 ∗
√
#points
2
in area.
• The next five data files contained between
1,000,000 and 5,000,000 squares that were 10
units each, and were uniformly distributed across
a region of the same size as that used for points.
• The remaining five data sets for creation contain
between 1,000,000 and 5,000,000 objects which
is a mixture of points and squares.
• In addition, 5 files were randomly generated to
evaluate the performance of region searching.
Each file contains 20 search regions that were 10
units each. Each search file corresponds to a data
set size mentioned above.
• Finally, 5 files were randomly generated to evalu-
ate the performance of point searching. Similarly,
each file contains 20 search points and correspond
to a data set size mentioned above.
4.2 Evaluation Framework
We perform evaluations on both the construction and
the search performance of the mqr-tree. The insertion
evaluation framework will be presented first, followed
by the framework for evaluating searching.
For both the mqr-tree and R-tree, we used a fanout
of 5 entries per node. This choice is due to the mqr-
tree having a 5-node fanout limit. Reducing the R-tree
to a 5-node fanout would guarantee a fair comparison.
For each data set, we created one mqr-tree and 10
R-trees by repeated insertion of every object in the
data set. Each tree was built using a random ordering
of the object set. The number of nodes, height (both
worst-case and average-case), average space utiliza-
tion in each node, total coverage of all minimum
bounding rectangles, total overcoverage of all mini-
mum bounding rectangles, and the total overlap be-
tween all minimum bounding rectangles was calcu-
lated for each tree. With respect to tree height, the
R-tree is balanced, so therefore all paths are the same
length and therefore the worst-case and average case
height will be the same. The mqr-tree, however, is
ICEIS2015-17thInternationalConferenceonEnterpriseInformationSystems
370

Table 2: Indexing Point Data.
#objs index #nodes height coverage overcoverage overlap sp. util
mqr-tree 575993 11(14) 899829674 99999647 0 55
1,000,000
R-tree 385331 10 3471592309 775006290 675006640 71
mqr-tree 1155314 11(14) 1902010284 200221974 0 55
2,000,000
R-tree 770889 10 8034028888 1761219524 1560997542 71
mqr-tree 1729328 12(14) 2940363153 300328747 0 55
3,000,000
R-tree 1156297 11 12881506927 2814777938 2514449189 71
mqr-tree 2304621 12(16) 3999071988 399999680 0 55
4,000,000
R-tree 1541392 11 21209175398 4670080750 4270081079 71
mqr-tree 2883030 12(16) 5083956406 500416712 0 55
5,000,000
R-tree 1927280 11 26404730270 5829899230 5329482524 71
Table 3: Indexing Mixed Object and Point Data.
#objs index #nodes height coverage overcoverage overlap sp. util
mqr-tree 587209 11(14) 566623167 40418311 29935198 54
1,000,000
R-tree 393018 10 2072809600 418732883 411397435 70
mqr-tree 1178897 11(16) 1181198140 80525151 60011758 54
2,000,000
R-tree 785851 10 4213706283 833688678 819272092 70
mqr-tree 1767303 12(16) 1816095721 120919999 89841540 54
3,000,000
R-tree 1178270 11 7281617131 1469500615 1448862536 70
mqr-tree 2348069 12(16) 2464062205 161339416 119849135 54
4,000,000
R-tree 1570870 11 10140414556 2036878811 2009435617 70
mqr-tree 2932339 12(16) 3119947706 201588891 149992043 54
5,000,000
R-tree 1962555 11 13755635004 2788853267 2755657374 70
not balanced. Therefore, both the longest path and the
average path length will need to be recorded. On all
result tables, this will be indicated by the average path
length, followed by the longest length in parentheses.
For the R-trees, an average for each performance
factor was calculated because each R-tree will vary
based on insertion order. This is not the case for the
mqr-tree - the same index will be created regardless
of the insertion order (Moreau and Osborn, 2012).
In addition to index construction, each index will
be evaluated for the performance of both region
searching and point searching. After each tree is con-
structed, both the corresponding region search and
point search query sets will be applied. The perfor-
mance criteria for both types of search is the number
of nodes that must be accessed (i.e. page hits) in or-
der to find all overlapping points or objects (or find
the lack thereof). We assume the worst-case scenario
of one disk access per node in our work. After all re-
gion and point queries have been executed, an average
number of page hits is calculated for each query type.
4.3 Index Construction Results
Table 1 depicts the results of the performance eval-
uation for index construction using the object data.
With respect to coverage, overcoverage and overlap,
that the mqr-tree achieves significant improvements
over the R-tree for all object set sizes, especially for
overcoverage and overlap. We see an improvement
of between 90-94% for overcoverage, a 93-96% im-
provement for overlap, and a 72-80% improvement
in coverage. In all cases, the improvement in cover-
age, overcoverage and overlap improves as the num-
ber of points in the index increases. The R-tree does
achieves higher space utilization, a lower number of
notes and a lower maximum tree height over the mqr-
tree. However, the following must be noted. First,
the improvement in height of the R-tree over the mqr-
tree is between 21-23%. In addition, the improve-
ment in the number of nodes of the R-tree is approx-
imately 33%. Both are significantly lower increases
than those achieved in coverage, overlap and over-
coverage by the mqr-tree. Finally, the mqr-tree still
achieves over 50% space utilization for all cases. Fi-
nally, the average height of the mqrtree, at approxi-
mately 75% of the maximum height, is almost identi-
cal to that for the R-tree. These are more minor sacri-
fices to make for the other significant improvements.
Table 2 depicts the performance evaluation results
when point data is used to construct the indices. Be-
cause the mqr-tree is only indexing point data here,
we achieve the expected zero overlap.We also observe
an improvement of between 87-92% in overcoverage
Themqr-treeforVeryLargeObjectSets
371
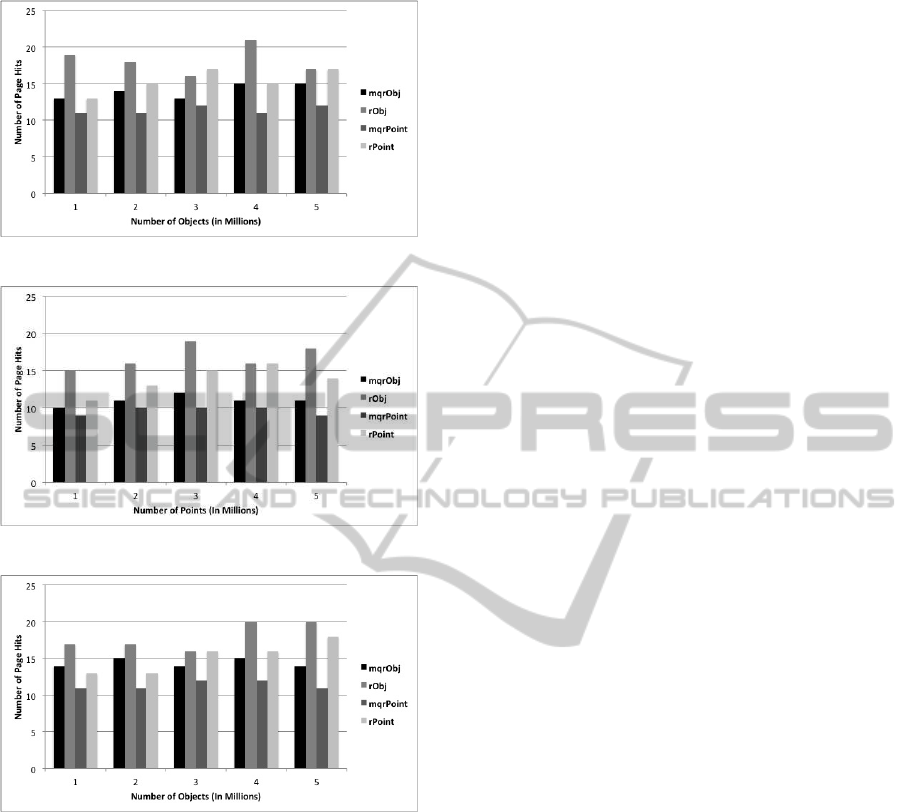
Figure 4: Search - Indexed Object Data.
Figure 5: Search - Indexed Point Data.
Figure 6: Search - Indexed Mixed Object and Point Data.
and between 74-81% in coverage. It should be noted
here that the values for coverage, overlap and over-
coverage are lower for both the mqr-tree and R-tree
over those found when both structures were index-
ing object data. Also, the space utilization and tree
heights are almost identical to those found for the
mqr-tree and R-tree when object data was indexed.
In Table 3 we present the results of the final
construction performance evaluation when the mixed
data set was used to construct the indexes. Here for all
performance factors, we find improvement trends that
are similar to those found for the object-indexed data.
The improvement in coverage is between 72-78%,
while the improvements for overcoverage and overlap
are between 90-93% and 92-95% respectively.
A very surprising find, however, is with the val-
ues overall when compared to the object-indexed and
point-indexed data above. When indexing data that
is a mix of points and objects, the lowest coverage
and overcoverage are achieved for both the mqr-tree
and R-tree, and the overlap for the R-tree is also the
lowest. It would be expected that a mixed data set
would achieve lower values over the object data set,
but not over the data set consisting entirely of points!
We feel the reason for this lies in how the data is or-
ganized. For a mixed data set, many points may be
enclosed by another object, and therefore will not re-
sult in extra overcoverage or overlap. For a point data
set, because the points have no objects to cover them,
the point set will generate additional whitespace (and
therefore, overcoverage) and possibly overlap as well.
4.4 Search Results
As mentioned, after each index was constructed, each
was evaluated for search performance using 20 region
queries and 20 point queries. Figures 4 to 6 depict
the results of the search evaluation. On all charts,
mbrObj and rObj are the average number of node ac-
cesses (i.e. page hits) required for the mqr-tree and R-
tree, respectively, to process the region queries, while
mqrPoint and rPoint are the average number of node
accesses required for the mqr-tree and R-tree, respec-
tively, to process point queries. Across all figures, we
see that the mqr-tree has a lower number of node ac-
cesses required for processing all spatial queries. In
particular, for region queries, the mqr-tree achieves
between 30-40% less node accesses than the R-tree.
For point queries, the mqr-tree still outperforms the
R-tree, but the decrease in node accesses are not as
significant in many cases. The exception to this is
when a point search is performed in point and mixed
object data when the number of objects in the index
is around 4 to 5 million. Then some more significant
results are achieved
We also make the following observations. First,
although the mqr-tree requires a number of node ac-
cess that is larger than the average tree height, it is
always lower than the maximum height. Therefore,
even if extra paths are being searched, it involves very
few nodes. Second, in every case (both for region and
point queries), the R-tree has a number of node ac-
cesses that is larger than its tree height. In particular,
for object queries, the number of node accesses is also
larger than the maximum height for the mqr-tree. This
shows that the R-tree needs to search many paths to
locate required objects that satisfy the queries. This
is the drawback in the R-tree of having a significant
amount of overcoverage and overlap. Conversely, this
is the advantage of the mqr-tree of having a signifi-
cantly lower overlap and overcoverage.
ICEIS2015-17thInternationalConferenceonEnterpriseInformationSystems
372

5 CONCLUSIONS AND FUTURE
WORK
In this paper, we present an evaluation of the ability of
the mqr-tree to handle significantly large amounts of
object data. We evaluated index construction, region
queries and point queries. Our experiments showed
that the mqr-tree achieved significantly lower cover-
age, overcoverage and overlap than the benchmark
R-tree strategy. In addition, the when the mqr-tree
was used for performing region and point queries, the
mqr-tree outperformed the R-tree in all cases, espe-
cially for all region queries.
Some future research include the following. The
first is to extend the mqr-tree to support nearest neigh-
bour and continuous spatial queries. The second is
to investigate strategies to decrease the height and in-
crease the node size of the mqr-tree without increas-
ing its overlap and overcoverage. The third is to com-
pare the mqr-tree against other spatial indexes such
as the R
∗
-tree, and also with real-world data sets. Fi-
nally, it is desirable to explore the notion of a dis-
tribute mqr-tree. This would further increase its abil-
ity to index more data.
REFERENCES
Beckmann, N., Kriegel, H.-P., Schneider, R., and Seeger,
B. (1990). The R
∗
-tree: an efficient and robust access
method for points and rectangles. In Proc. ACM SIG-
MOD Int’l Conf. Management of Data, pages 322–31.
Berchtold, S., Keim, D., and Kriegel, H.-P. (1996). The X-
tree: an index structure for high-dimensional data. In
Proceedings of the 22nd International Conference on
Very Large Databases.
Gaede, V. and G¨unther, O. (1998). Multidimensional access
methods. ACM Computing Surveys, 30:170–231.
Geological Survey of Canada (2006). Geoscience Data
Repository, http://gdr.nrcan.gc.ca/index
e.php. (vis-
ited March 2006).
Guttman, A. (1984). R-trees: a dynamic index structure
for spatial searching. In Proceedings of the ACM
SIGMOD International Conference on Management
of Data, pages 47–57.
Hinze, A., Voisard, A., and Buchanan, G. (2009). TIP: Per-
sonalizing information delivery in a tourist informa-
tion system. Journal of IT & Tourism, 11(3):247–264.
Kamel, I. and Faloutsos, C. (1994). Hilbert r-tree: An im-
proved r-treeusing fractals. In Proceedings of the 20th
International Conference on Very Large Databases,
pages 500–509.
Koudas, N. (2000). Indexing support for spatial joins. Data
and Knowledge Engineering, 34:99–124.
Moreau, M. and Osborn, W. (2012). mqr-tree: a two-
dimensional spatial access method. Journal for Com-
puter Science and Engineering, 15.
Moreau, M., Osborn, W., and Anderson, B. (2009). The
mqr-tree: Improving upon a 2-dimensional spatial ac-
cess method. In Proceedings of the 4th IEEE Inter-
national Conference on Digital Information Manage-
ment (ICDIM 2009).
Nievergelt, J., Hinterberger, H., and Sevcik, K. C. (1984).
The grid file: An adaptable, symmetric multikey file
structure. ACM Trans. Database Syst., 9(1):38–71.
Osborn, W. and Hinze, A. (2014). Tip-tree: a spatial in-
dex for traversing locations in context-aware mobile
access to digital libraries. Pervasive and Mobile Com-
puting, 15:26–47.
Research Collaboratory For Structural Bioinformatics
(2004). Protein data bank, http://www.rcsb.org/pdb.
(visited May 2004).
Rigaux, P., Scholl, M., and Voisard, A. (2001). Spa-
tial databases: with application to GIS. Morgan-
Kauffman.
Samet, H. (1990). The design and analysis of spatial data
structures. Addison-Wesley.
Sellis, T., Roussopoulos, N., and Faloutsos, C. (1987). The
R
+
-tree: a dynamic index for multi-dimensional ob-
jects. In Proc. 13th Int’l Conf. Very Large Data Bases.
Shekhar, S. and Chawla, S. (2003). Spatial databases: a
tour. Prentice Hall.
Themqr-treeforVeryLargeObjectSets
373
