
An Empirical Study of Real-time Feedback and Dynamic Pricing
Effects on Electric Power Consumption
Field Experiment on a Remote Island in Japan
Koji Shimada
1
, Yuki Ochi
2
, Takuya Matsumoto
3
, Hiroshi Matsugi
4
and Takao Awata
5
1
Faculty of Economics, Ritsumeikan University, 1-1-1 Nojihigashi, Kusatsu, Shiga 525-8577, Japan
2
E-konzal, #304 Maison Toan, 541 Asakura-cho, Nakagyo-ku, Kyoto 604-8074, Japan
3
Graduate School of System Informatics, Kobe University, 1-1 Rokkodai-cho, Nada-ku, Kobe 657-8501, Japan
4
Hyogo Prefectural Institute of Technology, 3-1-12 Yukihira-cho, Suma-ku, Kobe 654-0037, Japan
5
Kei Communication Technology Inc., Shinko Building 8F, 8 Kaigandori, Chuo-ku, Kobe 650-0024, Japan
Keywords: Electric Power Demand Control, Real-time Feedback, Dynamic Pricing, Field Experiment, Econometrics.
Abstract: The management of electric power demand is a key element in the creation of smart-energy communities.
We are engaged in a field experiment with the participation of 51 households on Nushima Island, one of the
remote islands of Japan, to study the effects of real-time feedback and dynamic pricing on electric power
consumption using smart meters and tablet PCs. From the results of panel data analysis, we have found that
these measures achieve an estimated saving of 22 percent in electric power consumption when the tablet
PCs are accessed three times per day.
1 INTRODUCTION
Management of energy demand through feedback of
power consumption and dynamic pricing will play a
significant role in the creation of smart-energy
communities that are both environmentally
conscious and resilient to disasters.
These informational and economic interventions
to households would contribute to climate change
mitigation substantially through not only reducing
the overall electric power demand but also
controlling the demand so as to follow the renewable
energy supply fluctuation.
Reductions of up to 20 percent in residential
energy consumption have been reported through the
technical innovations of real-time information
feedback and dynamic pricing, with the actual
energy savings achieved depending on the
experimental conditions.
We have been focusing our efforts on the
development of an effective feedback and pricing
method for power demand management appropriate
to regional conditions, and have been conducting a
field experiment for this purpose on Nushima Island
in Hyogo Prefecture, Japan.
In this paper, we outline the design of our
real-time feedback and dynamic pricing experiment
and present the findings obtained from an empirical
analysis.
2 LITERATURE REVIEW AND
THE ORIGINALITY OF THIS
STUDY
A number of field experiments have been conducted
by various researchers aimed at estimating the
effects of demand response by real-time information
feedback and dynamic pricing.
2.1 Real-time Information Feedback
Experiments
Faruqui et al. (2010a) conducted a review of a dozen
utility pilot programs that were focused on either the
energy conservation effects of in-home displays
(IHDs) or demand-side management technologies.
Their study revealed that the power demand of
consumers who actively used an IHD was reduced
by an average of approximately 7 percent excluding
cases in which prepayment for electric power was
201
Shimada K., Ochi Y., Matsumoto T., Matsugi H. and Awata T..
An Empirical Study of Real-time Feedback and Dynamic Pricing Effects on Electric Power Consumption - Field Experiment on a Remote Island in Japan.
DOI: 10.5220/0005434402010208
In Proceedings of the 4th International Conference on Smart Cities and Green ICT Systems (SMARTGREENS-2015), pages 201-208
ISBN: 978-989-758-105-2
Copyright
c
2015 SCITEPRESS (Science and Technology Publications, Lda.)

involved. They also found that consumers reduced
their electric power consumption by double that
amount when they were both using an IHD and in an
electric power payment system.
On the other hand, Houde et al. (2013) found that
access to real-time feedback resulted in a 5.7 percent
average reduction in household electric power
consumption, with significant declines continuing
for up to four weeks. However, they only included
few factors such as temperature and precipitation
into their models.
Real-time information feedback has therefore
been demonstrated to be an effective tool to reduce
electric power consumption by 6 to 7 percent.
2.2 Dynamic Pricing Experiments
Faruqui et al. (2010b) reported the results of 15
experimental surveys showing that time-of-use
(TOU) rates induce a drop in peak demand ranging
from 3 to 6 percent and that critical-peak pricing
(CPP) tariffs induce a drop in peak demand of
between 13 and 20 percent.
On the other hand, Thorsnes et. al. (2012)
conducted an experiment on time-varying prices in
New Zealand and found that, in winter, participating
households reduced electric power consumption by
at least 10 percent. They also pointed out that the
response varied with house and household size.
These pricing effects are dependent on peak/off-
peak price differentials, with reductions ranging
from several percent to 20 percent.
2.3 Originality of This Study
Having reviewed those existing studies, this study
puts an emphasis on methodological development to
achieve overall electric power demand reduction
rather than aiming at peak cut or peak shift by using
informational and economic intervention.
Additionally, this study takes into account a wide
variety of factors that affect electric power
consumption level: not only weather conditions such
as temperature and wind speed but also the number
of electric appliances in use and living conditions
such as housing structures and electric power contact
types.
Our model can take into account the impacts of
various surrounding factors so as to estimate the
real-time feedback and dynamic pricing effects more
sharply than previous studies such as Houde et al.
(2013).
3 METHOD AND DATA
3.1 Outline of the Experiment
Considering both the experiences in the previous
experiments and the fragile condition of electric
power supply on remote islands, we designed a field
experiment on Nushima Island with the following
objectives:
1) to estimate the effects of both real-time
information feedback and dynamic pricing on
electric power consumption;
2) to investigate the sustainable long-term
effect obtainable by these measures in terms of
climate change mitigation, rather than focusing only
on short-term demand response;
3) to develop an effective pricing method in
accordance with the daily fluctuations of solar
photovoltaic power generation on the island.
With regard to item 3) above, the pricing signal
may be reversed when compared with the usual
practice of peak load pricing because the price on a
hot and sunny day will be high.
This empirical study being carried out on
Nushima Island is a three-year project that
commenced in 2012. In that year, smart meters were
installed in the dwellings of 51 households. In May
2013, tablet PCs were distributed to the participants
to provide them with feedback on their electric
power consumption. In addition, dynamic pricing
was introduced on a trial basis in the summer of
2014.
3.1.1 Real-time Feedback
We have presented three patterns of feedback
information to the participating households related
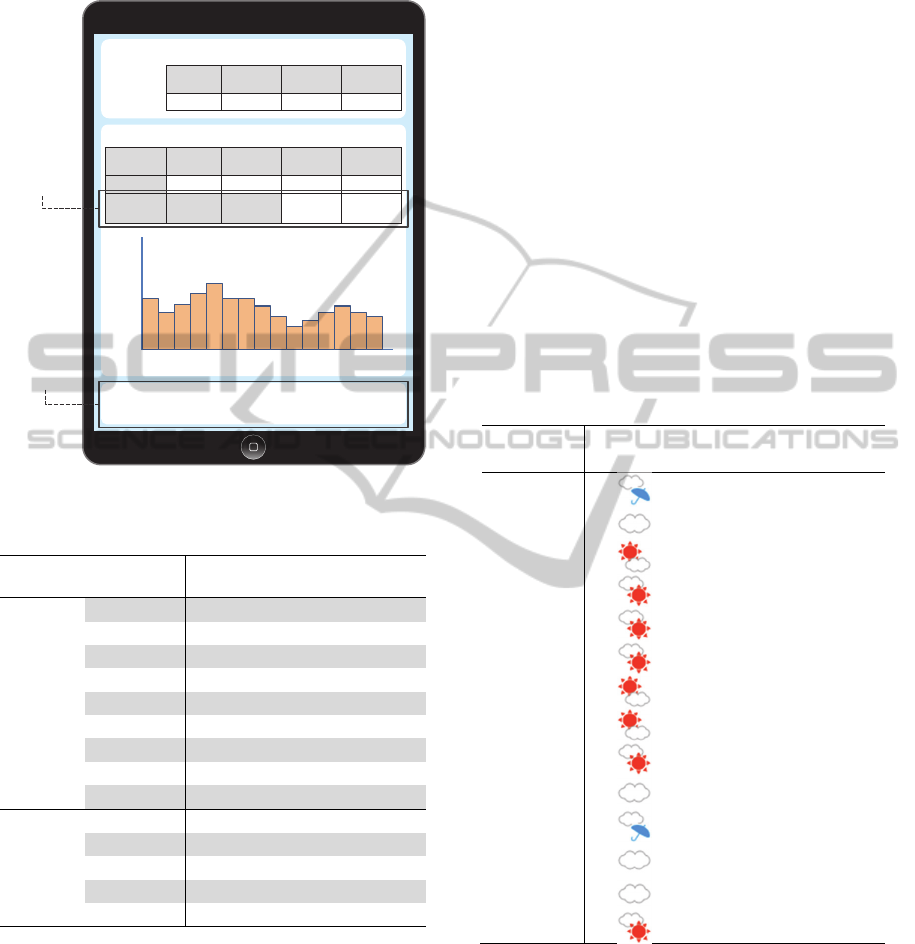
to their electric power consumption. Figure 1 shows
the various types of information displayed on a
tablet PC. Each household can view its electric
power consumption and per-capita consumption in
real time PC in Pattern 1. In Pattern 2, they can also
compare their consumption with the average
consumption of the participating households.
Furthermore, in Patten 3, a ranking of the levels of
power consumption of the participating households
is displayed.
Table 1 shows the schedule of the feedback
patterns. The patterns were rotated monthly from
Pattern 1 to Pattern 3 in succession until April 2014,
and then remained in Pattern 3 from May 2014
onward in preparation for the dynamic pricing
experiment in the summer. This was based on the
principle that the effect of dynamic pricing would be
SMARTGREENS2015-4thInternationalConferenceonSmartCitiesandGreenICTSystems
202
able to be assessed most clearly when the type of
feedback information was fixed.
Figure 1: Information displayed on a tablet PC.
Table 1: Schedule of feedback patterns.
Pattern
1 2 3
2013
Jan.-Apr.
May
○
Jun.
○
Jul.
○
Aug.
○
Sep.
○
Oct.
○
Nov.
○
Dec.
○
2014
Jan.
○
Feb.
○
Mar.
○
Apr.
○
May-Oct.
○
3.1.2 Dynamic Pricing
The dynamic pricing experiment was implemented
from August 26 to September 8, 2014. Each of the
participating households was allocated 7,000 points
at the beginning of the experiment, and points were
deducted based on their electric power consumption.
Participants could exchange the remaining balance
of points into real money at the end of the
experiment.
We prepared three types of deduction rates and
changed the rate daily according to the weather
forecast. The rate, calculated in terms of
points/(kWh/person), was 20 when the weather
forecast for both the preceding and current days
included “sunny,” 30 when the forecast for either the
preceding or current days included “sunny,” and 40
when the forecast for neither the preceding nor
current days included “sunny.” The reason why the
deduction rate on cloudy or rainy days was higher
than on sunny days was that we assumed a smart-
energy community where electric power is supplied
by renewable energy such as solar power and energy
stored in batteries. Energy stored in the batteries
would decrease on cloudy or rainy days because the
photovoltaic power generation system would
produce less energy. Table 2 shows the daily
weather forecast and the deduction rates during the
period of the dynamic pricing experiment.
Table 2: Schedule of deduction rates.
Weather
forecast
Deduction rate
[points/(kWh/person)]
Aug. 26 30
Aug. 27 40
Aug. 28 30
Aug. 29 20
Aug. 30 20
Aug. 31 20
Sep. 1 20
Sep. 2 20
Sep. 3 20
Sep. 4 30
Sep. 5 40
Sep. 6 40
Sep. 7 40
Sep. 8 30
3.2 Analysis Method
3.2.1 Panel Data Analysis
We have been conducting panel data analysis in this
study to assess the effects of real-time feedback and
dynamic pricing on the management of electric
power demand. In view of the fact that power
demand varies according to various factors,
Electric power consumption in your home
Per-capita electric power consumption
Now
(W/person)
Today
(Wh/person)
Yesterday
(Wh/person)
This month
(Wh/person)
Your house
150 1,000 2,500 9,000
Average of
all houses
3,625 10,756
Lowest electric power consumption ranking
Your rank : 14
th
(yesterday)
Time
Per-capita consumption
(Wh/person)
Now
(W)
Today
(Wh)
Yesterday
(Wh)
This month
(Wh)
450 3,000 7,500 27,000
Only in
Patterns
2 and 3
Only in
Pattern 3
AnEmpiricalStudyofReal-timeFeedbackandDynamicPricingEffectsonElectricPowerConsumption-Field
ExperimentonaRemoteIslandinJapan
203

including temperature, household size, and types of
household electrical appliances used, the effects of
feedback and dynamic pricing should be estimated
separately from other factors that may have an
influence on electric power consumption taking the
diversity of the participating households into
consideration.
3.2.2 Analysis of All Households
We performed an analysis of the daily electric power
consumption of the 51 participating households.
Equation (1) is the estimating equation used to
determine the effects of real-time feedback and
dynamic pricing on daily power demand. The
equation defines daily electric power consumption in
terms of an explained variable and four types of
factors as explanatory variables; namely, factors
related to the external environment, internal
environment, feedback, and dynamic pricing. The
formula was originally developed for this study
based on the authors’ investigations.
The external environmental factors refer to the
weather conditions; namely, the cooling degree-
hours, heating degree-hours, and daily mean wind
speed. The cooling/heating degree-hours describe to
what extent (in degrees) and for how long (in hours)
the outside air temperature is higher/lower than a
specific base temperature. The base temperature for
cooling degree-hours was set at 24°C and that for
heating degree-hours was set at 18°C.
The internal environmental factors were
composed of the number of household members, air
conditioners, refrigerators, and commercial freezers
in the case of households engaged in fishery;
whether all of the energy in a household was
supplied by electricity; whether non-electrical
heating equipment was used; whether the household
was living in a timber house; and whether the
targeted period was the summer vacation season.
The factors related to feedback consisted of the
feedback pattern and the frequency of viewing
electric power consumption on the tablet PC.
Finally, the factors related to dynamic pricing
comprised three deduction rates according to the
weather conditions.
We adopted a cross-sectional seemingly
unrelated regression (SUR) model in order to take a
large number of explanatory variables into
consideration. The number of samples obtained
excluding missing values amounted to 28,347,
which were collected from the 51 households over a
period of 664 days from January 1, 2013 to October
31, 2014.
,
,
,
,
,
,
,
,
,
,
,
,
,
,
,
1_1305
,
⋯
1_1403
,
2_1307
,
⋯
2_1404
,
1_1308
,
⋯
3_1410
,
ln
,
1 1_1305
,
⋯
ln
,
1 3_1410
,
20
,
30
,
40
,
ln
,
1 20
,
ln
,
1 30
,
ln
,
1 40
,
(1)
EC Daily electric power consumption
[Wh⁄day]
C Constant
HH Number of household members
[persons]
CDH Cooling degree-hours [degree-hours]
HDH Heating degree-hours [degree-hours]
WS Daily mean wind speed [m⁄s]
AC Number of air conditioners [units]
RF Number of refrigerators [units]
CF Number of commercial freezers [units]
DUME Dummy variable for households where
all energy is supplied by electric power
DUMK Dummy variable for use of non-
electrical heating equipment such as a
kerosene heater
DUMT Dummy variable for living in a timber
house
DUMV Dummy variable for summer vacation
season
DUMX_Y Dummy variable for feedback period
(X: pattern of feedback, Y: month)
VC Daily frequency of viewing electric
power consumption on the tablet PC
[times/day]
DUMZP Dummy variable for days of dynamic
pricing (Z: deduction rate)
α Partial regression coefficient
d Date
i ID number of each household
SMARTGREENS2015-4thInternationalConferenceonSmartCitiesandGreenICTSystems
204

3.2.3 Analysis by District
There are five districts on Nushima Island, and the
characteristics of and attitudes toward this
experimental study differ among them. We therefore
assessed the impact of real-time feedback and
dynamic pricing by district. The analysis was
performed using Equation (2).
Equation (2) has fewer variables than Equation
(1) because it has constraints based on the cross-
sectional sample volume for panel data analysis.
This analysis focused on feedback of the Pattern
3 type and dynamic pricing. We also adopted a
cross-sectional SUR model here. The number of
samples obtained excluding missing values was
3,396 in Minami District, 3,480 in Naka District,
4,424 in Kita District, 3,342 in Higashi District, and
2,591 in Tomari District.
,
,
,
,
,
,
,
,
,
,
,
,
,
,
3
,
ln
,
13
,
20
,
30
,
40
,
ln
,
1 20
,
ln
,
1 30
,
ln
,
1 40
,
(2)
DUM3 Dummy variable for feedback period in
Pattern 3
3.3 Data
We are assessing the impacts of feedback and
dynamic pricing on the actual electric power demand
by using data collected via smart meters. Smart
meters are also gathering data on the frequency of
viewing power consumption feedback on the tablet
PCs. Data regarding the external environmental
factors for the present study were obtained or
calculated from the Climate Statistics provided
online by the Japan Meteorological Agency. Data on
the internal environmental factors such as the
number of electrical appliances were based on
questionnaires targeting the participating households.
4 RESULTS AND DISCUSSION
4.1 Results of Dynamic Pricing
The average electric power consumption of the
participating households during the period of the
dynamic pricing experiment was reduced by 2.7
percent compared with the same period in the
preceding year. Figure 2 shows the changes in power
consumption compared with the preceding year by
district. Reductions in power consumption were seen
in all of the districts except Tomari, with the Kita
District achieving the largest reduction.
Figure 2: Changes in electric power consumption
compared with the preceding year by district.
4.2 Results of Panel Data Analysis
4.2.1 Analysis of All Households
From the results of the panel data analysis of all of
the participating households, the adjusted R squared
value was 0.9142 and the Durbin-Watson statistic
was 1.183. As shown in Table 3, real-time feedback
had the effect of reducing electric power
consumption in many of the months studied, because
the coefficients of DUM1_1305, DUM1_1306,
DUM1_1309, DUM2_1307, DUM2_1310,
DUM2_1404, DUM3_1311, DUM3_1405,
DUM3_1406, DUM3_1407, DUM3_1409, and
DUM3_1410 are statistically significant at the 1
percent level and have negative value. The symbols
*, **, and *** in Table 3 indicate statistical
significance at the 10%, 5%, and 1% levels,
respectively.
Additionally, the coefficients of the cross terms
-7%
-6%
-5%
-4%
-3%
-2%
-1%
0%
1%
2%
3%
4%
Change in electric power consumption
(%)
AnEmpiricalStudyofReal-timeFeedbackandDynamicPricingEffectsonElectricPowerConsumption-Field
ExperimentonaRemoteIslandinJapan
205

Table 3: Main results of analysis of all participating
households.
Variable Coefficient t value
DUM1_1305 (*1) -1,838 *** -9.212
DUM1_1306 (*1) -2,632 *** -12.06
DUM1_1309 (*1) -1,992 *** -9.230
DUM1_1312 138.0 0.7339
DUM1_1403 -87.23 -0.693
DUM2_1307 (*1) -1,898 *** -6.437
DUM2_1310 (*1) -2,267 *** -14.51
DUM2_1401 343.3 ** 1.961
DUM2_1404 -1,852 *** -12.57
DUM3_1308 118.6 0.3208
DUM3_1311 -1,027 *** -8.146
DUM3_1402 285.4 * 1.753
DUM3_1405 (*2) -2,510 *** -16.72
DUM3_1406 (*2) -2,612 *** -14.52
DUM3_1407 (*2) -1,623 *** -6.625
DUM3_1408 -344.6 -1.296
DUM3_1409 (*2) -2,600 *** -13.06
DUM3_1410 (*2) -2,662 *** -15.32
ln(VC+1)×DUM1_1305 59.94 0.8199
ln(VC+1)×DUM1_1306 59.31 0.8148
ln(VC+1)×DUM1_1309 -151.4 -1.457
ln(VC+1)×DUM1_1312 661.9 *** 3.476
ln(VC+1)×DUM1_1403 601.3 ** 4.175
ln(VC+1)×DUM2_1307 -497.9 *** -4.127
ln(VC+1)×DUM2_1310 21.97 0.1480
ln(VC+1)×DUM2_1401 342.5 1.498
ln(VC+1)×DUM2_1404 949.6 *** 5.801
ln(VC+1)×DUM3_1308 -189.4 -1.251
ln(VC+1)×DUM3_1311 468.8 ** 2.565
ln(VC+1)×DUM3_1402 646.4 *** 3.919
ln(VC+1)×DUM3_1405 805.6 *** 5.213
ln(VC+1)×DUM3_1406 -14.78 -0.1529
ln(VC+1)×DUM3_1407 (*3) -640.4 *** -4.173
ln(VC+1)×DUM3_1408 (*3) -1,303 *** -8.063
ln(VC+1)×DUM3_1409 (*3) -382.4 *** -3.384
ln(VC+1)×DUM3_1410 (*3) -560.1 *** -5.152
DUM20P 29.51 0.0766
DUM30P 281.1 0.9736
DUM40P (*4) 1,123 *** 4.998
ln(VC+1)×DUM20P 150.7 0.5276
ln(VC+1)×DUM30P -123.2 -0.444
ln(VC+1)×DUM40P (*4) -1,049 *** -3,653
between the frequency of viewing a tablet PC and
the dummy variable for the feedback pattern are
statistically significant at the 1 percent level and
have negative value from July to October, 2014,
which are indicated in (*3) in Table 3. Those
coefficients range from approximately -380 to -
1,300.
However, particularly in the winter and spring
seasons, the significant coefficients of the same
cross terms are sometimes positive. It is considered
to be difficult to reduce electric power consumption
in winter, despite the fact that the actively
participating households confirmed their
consumption level frequently via the tablet PCs. The
differing effects between summer and winter may be
related to consumers’ perception gap between
subjective savings and real savings, as reported by
Attari et al. (2010).
On the other hand, only the coefficients of
DUM40P and ln(VC+1)×DUM40P are statistically
significant among the variables related to dynamic
pricing, which are indicated in (*4) in Table 3. The
result in which DUM40P has a positive coefficient
and ln(VC+1)×DUM40P has a negative coefficient
indicates that households that viewed their tablet PC
frequently reduced electric power consumption
when the deduction rate was 40 points.
Table 4 shows the estimated effect of real-time
feedback and dynamic pricing compared with the
mean daily consumption of the participating
households during the dynamic pricing experiment.
Households viewing electric power consumption on
the tablet PC three times per day are estimated to
have reduced power consumption by 20.1 percent
through real-time feedback and 2.1 percent through
dynamic pricing.
Regarding the long-term effect of electric power
consumption reduction by real-time information
feedback, we confirmed almost the same level of
coefficients of feedback pattern dummy variables
between May/June/July/September/October of 2013
(DUM1_1305, DUM1_1306, DUM2_1307,
DUM1_1309, DUM2_1310: -1,838 to -2.632, which
are indicated in (*1) in Table 3) and the same
months of 2014 (DUM3_1405, DUM3_1406,
DUM3_1407, DUM3_1409, DUM3_1410: -1,623 to
-2,662, which are indicated in (*2) in Table 3). At
least for these two years, except in August, real-time
information feedback was found to work
continuously as an effective electric power demand
reduction measure. These results are quite different
from those of the previous studies such as Houde et
al. (2013) that indicated significant reductions
Table 4: Estimated reduction rate achieved by feedback
and dynamic pricing during the dynamic pricing
experiment.
Frequency of viewing
tablet PC per day
0 1 2 3
Real-time
feedback
Pattern 3
-
16.7%
-
18.4%
-
19.4%
-
20.1%
Dynamic
pricing
Deduction
rate: 40
+7.2% +2.5% -0.2% -2.1%
SMARTGREENS2015-4thInternationalConferenceonSmartCitiesandGreenICTSystems
206

continued only for four weeks.
On the other hand, there was no distinct
difference in electric power consumption reduction
effects among the feedback patterns (Patterns 1 to 3)
according to the coefficients of feed-back pattern’s
dummy variables (DUM1, DUM2, DUM3) in Table
3.
4.2.2 Analysis by District
The estimation results obtained from the panel data
analysis by district are shown in Table 5. The
coefficients of the dummy variable for feedback in
Pattern 3 and the cross terms between the frequency
of viewing a tablet PC and the dummy variable for
dynamic pricing when the deduction rate was 30/40
were statistically significant at the 1 percent level
and had negative values in the districts of Kita, Naka,
and Minami, which are indicated in (*1) in Table 5.
These districts are ranked in the top three for
reduction of electric power consumption, as shown
in Figure 2. This indicates that households in the top
three districts tended to reduce power consumption
when the deduction rate was high.
Particularly in the districts of Minami and Naka,
real-time feedback in Pattern 3 had the effect of
reducing power consumption by 11.4 percent
compared with the average consumption level of
those districts.
Moreover, in Minami District, the frequency of
viewing a tablet PC per day increased the power
consumption reduction rate as the deduction rate
increased, as shown in Table 6. The power
consumption reduction rate ranged from 8.7 percent
to 19.3 percent when the tablet PCs were accessed
three times per day.
Table 6: Estimated reduction rate by dynamic pricing
during the dynamic pricing experiment in Minami District.
Dynamic
pricing
Frequency of viewing
tablet PC per day
0 1 2 3
Deduction
rate: 20
5.2% -1.7% -5.8% -8.7%
Deduction
rate: 30
0.9% -6.0%
-
10.0%
-
12.8%
Deduction
rate: 40
8.6% -5.4%
-
13.5%
-
19.3%
5 CONCLUSIONS
This study investigated the effects of real-time
information feedback and dynamic pricing on
Table 5: Results of analysis by district.
Variable Coefficient t value
Minami District
DUM3 (*1)
-1,769 ***
-11.18
ln(VC+1)×DUM3
83.34
0.4733
DUM20P
763.3
1.188
DUM30P
133.4 0.3820
DUM40P 1,255 *
1.907
ln(VC+1)×DUM20P -1,464 ***
-3.127
ln(VC+1)×DUM30P (*1)
-1,449 ***
-2.726
ln(VC+1)×DUM40P (*1)
-2,943 ***
-4.812
Naka District
DUM3 (*1)
-1,747 ***
-7.213
ln(VC+1)×DUM3
-13.46
-0.1082
DUM20P
551.7
1.258
DUM30P
747.0 1.370
DUM40P 1,335 ***
5.247
ln(VC+1)×DUM20P -450
-1.578
ln(VC+1)×DUM30P
-420
-0.6579
ln(VC+1)×DUM40P (*1)
-1,314 ***
-6.045
Kita District
DUM3 (*1)
-520.6 ***
-3.324
ln(VC+1)×DUM3
204.5
1.700
DUM20P
136.8
0.3491
DUM30P
-27.76 -0.03656
DUM40P 408
0.8410
ln(VC+1)×DUM20P -318
-0.5738
ln(VC+1)×DUM30P (*1)
-1,160 ***
-4.115
ln(VC+1)×DUM40P
25.50
0.06106
Higashi District
DUM3
-98.05
-0.4563
ln(VC+1)×DUM3
-328.8
-1.344
DUM20P
932.5 *
1.857
DUM30P
847.6
1.301
DUM40P 573.9
1.540
ln(VC+1)×DUM20P -262.7
-0.6315
ln(VC+1)×DUM30P
30.80
0.1016
ln(VC+1)×DUM40P
-536.8
-0.5428
Tomari District
DUM3
727.3 ***
3.671
ln(VC+1)×DUM3
-41.71
-0.2359
DUM20P
-383.1
-0.5817
DUM30P
838.1 * 1.517
DUM40P 955.1
1.758
ln(VC+1)×DUM20P 239.7
0.3500
ln(VC+1)×DUM30P
-1,348 **
-2.198
ln(VC+1)×DUM40P
-667.0
-0.8523
Adjusted R-squared
DW statistic
Minami
0.7377
1.007
Naka
0.7782 0.7443
Kita
0.9660 1.026
Higashi
0.6906 0.7322
Tomari
0.7951 0.9711
AnEmpiricalStudyofReal-timeFeedbackandDynamicPricingEffectsonElectricPowerConsumption-Field
ExperimentonaRemoteIslandinJapan
207

residential electric power consumption based on the
results of a field experiment on Nushima Island in
Japan.
We obtained several interesting findings, as
follows:
1) Our estimate of the power demand reduction
effects for all of the participating households
revealed that real-time feedback achieved a
reduction of 20 percent in electric power
consumption and that the highest level of
dynamic pricing also achieved a saving of 2
percent when the tablet PCs were accessed three
times per day.
2) In two of the five districts, real-time information
feedback showed a substantial power reduction
effect of 11.4 percent. In one of these districts,
the highest pricing resulted in a 19.3 percent
reduction in residential electric power
consumption when the tablet PCs were accessed
three times per day.
3) The effect of real-time information feedback on
electric power demand has remained at the same
level for two years.
4) The real-time information feedback pattern
caused no difference in terms of changes in
electric power consumption.
Our findings would also be useful for demand-
side management system design in residential smart
grid that has been intensively developed in recent
years by several researchers such as Liu et. al.
(2014).
ACKNOWLEDGEMENTS
This study was supported by the technological
development and demonstration research project for
global warming countermeasures of the Ministry of
the Environment, Japan.
REFERENCES
Attari, S., Dekay, M. L., Davidson, C. I., de Bruin, W. B.,
2010. Public perception of energy consumption and
savings. In Proceedings of the National Academy of
Science of the United States of America; 107-37,
16054–16059.
Faruqui, A., Sergici, S., Sharif, A., 2010a. The Impact of
Informational Feedback on Energy Consumption–A
Survey of the Experimental Evidence. In Energy, 35-4,
1598–1608.
Faruqui, A., Sergici, S., Sharif, A., 2010b. Household
response to dynamic pricing of electricity: A survey of
15 experiments. In Journal of Regulatory Economics,
38,193–225.
Houde S., Todd A., Sudarshan A., Flora J. A., Armet K. C.,
2013. Real-time Feedback and Electricity
Consumption: A Field Experiment Assessing the
Potential for Savings and Persistence. In The Energy
Journal, 34-1, 87–102.
Japan Meteorological Agency, Climate Statistics
http://www.data.jma.go.jp/obd/stats/etrn/index.php?pr
ec_no=63&block_no=1337&year=&month=&day=&v
iew.
Liu Y., Yuen C., Huang S., Ul Hassan N., Wang X., Xie
S., 2014. Peak-to-Average Ratio Constrained
Demand-Side Management with Consumers
Preference in Residential Smart Grid. In IEEE Journal
of Selected Topics in Signal Processing. 8-6, 1084-
1097.
Thorsnes P., Williams, J., Lawson, R., 2012. Consumer
responses to time varying prices for electricity. In
Energy Policy, 49, 552–561.
SMARTGREENS2015-4thInternationalConferenceonSmartCitiesandGreenICTSystems
208
