
Interactive Mobile Data Visualization for Second Screen
Kerstin Blumenstein
IC\M/T - Institute of Creative\Media/Technologies, St. Poelten University of Applied Sciences,
Matthias Corvinus-Straße 15, St. Poelten, Austria
Faculty of Informatics, Vienna University of Technology, Erzherzog-Johann-Platz 1/180, Vienna, Austria
ABSTRACT
Traditional medial content was consumed with one
device at a time. With the increasing simultaneous
usage of several different devices like smartphone,
tablet, and connected TV new approaches for media
consumption are conceivable. One specific instance is
a Second Screen scenario where users complement in-
formation from unidirectional media broadcasts (i.e.
TV) with additional facts from a secondary Internet
connected source (e.g. smartphone or tablet). How-
ever Second Screen applications are still in its infancy
and very little is known on how to properly design
them. The focus in the thesis will be on the role of
data visualizations and how it can be used in Sec-
ond Screen application for both sides: for the viewer,
allowing interactive access to additional, visual, and
personalized information that is not included in the
broadcast TV content; but also for the TV stations,
in order to get richer data about their audience by
providing a direct backchannel. By answering the
research questions the complete process of design-
ing and developing interactive data visualization in
the context of Second Screen applications for mobile
touch devices will be investigated. In addition to sev-
eral state-of-the-art reports a tested framework, which
includes all relevant parts of a Second Screen applica-
tion (e.g. content creation, synchronization, different
types of visualization), and guidelines for designing
and developing mobile data visualization for Second
Screen applications, which are synchronized with the
broadcast, will be developed.
Keywords. Interactive Data Visualization, Mobile
Device, Second Screen.
1 RESEARCH PROBLEM
Smartphone, tablet and connected TV have revolu-
tionized the way we access the Internet. We not
only use several different devices throughout the day,
we increasingly use them simultaneously. In 2013
more than half of Germanys Internet users regu-
larly used more than one device at the same time
(United Internet Media and InteractiveMedia CCP
GmbH, 2013; SevenOne Media, 2013). A survey,
conducted by Microsoft in the US, Australia, Brazil,
Canada, and the UK, found that 57% of the par-
ticipants used multiscreen settings for investigative
spider-webbing (Micorosft Advertising, 2013) the si-
multaneous, information- and discovery driven activ-
ity related to TV-broadcasted information. That type
of multiscreen setting, where users complement in-
formation from unidirectional media broadcasts (i.e.
TV) with additional facts from a secondary Internet
connected source (e.g. smartphone or tablet) is the
relevant scenario for the thesis. It is called Second
Screen (2S).
Surveys show that 2S applications have rele-
vance (United Internet Media and InteractiveMedia
CCP GmbH, 2013; SevenOne Media, 2013; Mi-
corosft Advertising, 2013). Often numbers, data, and
graphics are used in broadcasts. Because of limited
time, editors have to reduce those data and cannot give
an extended description of the content. Interactive
data visualization can help here to provide an easy to
understand detailed description of the content (Ward
et al., 2010). Therefor, integrating data visualization
in a 2S application seems to be a promising approach.
Target devices for 2S applications are mainly lap-
top, smartphone and tablet (United Internet Media
and InteractiveMedia CCP GmbH, 2013). Because of
increasing sales figures for tablets and smartphones
and decreasing sales figures for laptops, which are
projected by IDC (2014) until 2018, the focus in this
research will be on mobile touch devices like tablet
and smartphone.
There are several research activities on data visu-
alization for mobile devices and a very limited num-
ber of projects for the usage of data visualization
within a 2S application (see section 3). Those 2S
projects are only documented technically but there is
currently no systematical research.
24
Blumenstein K..
Interactive Mobile Data Visualization for Second Screen.
Copyright
c
2015 SCITEPRESS (Science and Technology Publications, Lda.)
!"#$%&'!#(""%')**+,#)-,$%
.,-/',%-"()#-,0"'&)-)'0,12)+,3)-,$%
45
16%#/($%,3"&
7""&8)#9'#/)%%"+
#+,"%-'1"(0"('#$::2%,#)-,$%
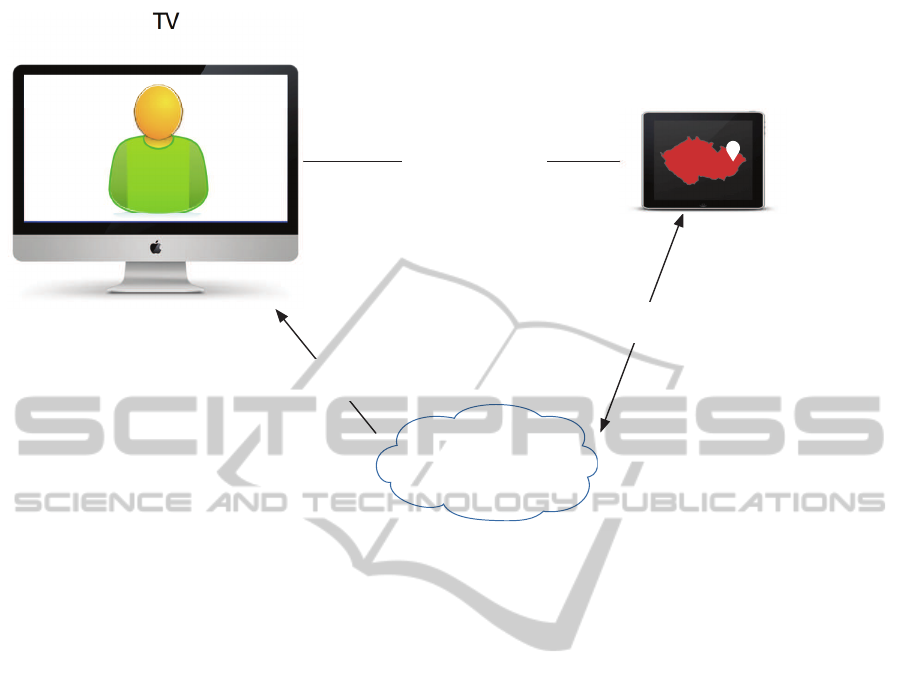
Figure 1: Overview of a Second Screen scenario.
Figure 1 shows an overview of a 2S application
scenario. In a basic setting, a broadcast is running
on a TV set. It could also be a laptop or a computer,
where a recorded broadcast is on air. The 2S appli-
cation with data visualization runs on tablet or smart-
phone and is synchronized with the TV (e.g. via au-
dio synchronization). A 2S application communicates
via the Internet with a server to receive and send data.
The server could also provide a feedback channel to
the TV station via the Internet. In doing so, broadcast-
ers or producers could benefit by using 2S application
e.g. for collecting user data or to integrate data in a
live program.
In the following, two possible scenarios for inte-
grating data visualization in a 2S application will be
described:
1. A documentary on wildlife is called “Killer
Whales - Fins of Change” (Wallis, 2014). It is
about the movement of killer whales to northern
regions. Data visualization within a 2S applica-
tion can provide a map view where you can fol-
low the killer whales to the Arctic. Interaction
with the map could offer the user additional infor-
mation e.g. geographical data about the affected
countries as well as distribution and population of
whales.
2. In a news program unemployment figures are a
regular topic. Data visualization about unemploy-
ment figures could offer the user within a 2S ap-
plication an easy to use overview about the count
of the last years e.g. filterable by month, year and
other relevant data. That visualization is reusable
and will grow with every month it is used.
Major challenges of 2S settings that include inter-
active data visualization on mobile devices are:
• User Interaction and Usability for Touch In-
put: One of the main advantages but also prob-
lems of touch devices is the usage of fingers. The
users cannot use their fingers in such an accu-
rate way they would do with a mouse as the ele-
ments are smaller than the finger (fat finger prob-
lem) (Wigdor et al., 2007). In addition the fingers
occlude the element itself while tapping on the el-
ement (occlusion problem) (Wigdor et al., 2007).
Because of these facts, visualization should have
an optimized user experience for touch usage.
• Possibility for Synchronizing Visualization
with Broadcasts: An interesting part of 2S ap-
plications is the option of synchronizing the addi-
tional content with the broadcast. The visualiza-
tion should show the relevantdata synchronizedto
the broadcast. It is also a challenge for this study
to find a way to synchronize the interactive visual-
ization in a way that is visible but not distracting.
A main problem is to get the users attention at the
right time on the right screen (TV or tablet/ smart-
phone).
InteractiveMobileDataVisualizationforSecondScreen
25

• Additional Value for Broadcaster (or Pro-
ducer) and User: By interacting with visualiza-
tions, users are not only actively engaging with
the exploration environment to gain insights for
themselves, but also generating usage data that
can be beneficial in other ways. First, such usage
data could be an additional value for broadcast-
ers (e.g. collecting data about usage) to influence
a live broadcast for example. Second, other users
could benefit from collective usage data for exam-
ple by being pointed to interesting other parts of
the visualization.
2 OUTLINE OF OBJECTIVES
The goal of this research is to study interactive data
visualization methods on mobile touch devices in the
context of 2S applications. This leads to the following
main research question:
• How can interactive data visualization in the con-
text of a Second Screen application be designed
and developed for mobile touch devices?
To achieve this goal the following sub research
questions will be answered:
2.1 Technical Questions
• Which touch gestures can be used for interacting
with data visualization?
• Which types of data visualization can best be used
for Second Screen applications related to scenar-
ios, which are chosen?
• Which libraries and frameworks are most suited
for developing interactive data visualization for
mobile touch devices?
• How can a framework be created which includes
all relevant parts of a Second Screen application
(e.g. content creation, synchronization, different
types of visualization)?
2.2 Conceptual Questions
• How should the interaction of the visualization be
designed in order to be visible but not distracting
if the app is synchronized with the unidirectional
media broadcast?
• Which advantages and disadvantages do Second
Screen applications have over traditional (unsyn-
chronized) knowledge sources like Wikipedia or
Google?
• How can content preparation process be supported
in the context of 2S scenarios?
• How can guidelines for creating Second Screen
applications with interactive data visualisation be
drafted?
3 STATE OF THE ART
During the last four years Natural User Interfaces
(NUIs) have become relevant for developing data vi-
sualizations (Reiterer, 2010; Kasik, 2011). Pike et al.
(2009) also point out the need for improved options
of interactions. Chittaro (2006) summarizes “[...] vi-
sualization applications developed for desktop com-
puters do not scale well to mobile devices.” Elmqvist
et al. (2011) demand the concept of fluid interfaces.
Fluid interface lets users touch and manipulate ele-
ments directly instead of interacting indirectly with
the user interface.
Isenberg and Isenberg (2013) recently published
a survey article for visualization on interactive sur-
faces. They have systematically analysed 100 inter-
active systems and tools for small and big displays.
The overview shows that most research projects work
with Multi Touch Table top devices. Smartphones are
only used in 6% of the analysed research projects al-
though smartphones are disseminated widely.
There are some relevant research projects of data
visualization on mobile devices but not related to Sec-
ond Screen applications. For example the visualiza-
tion type treemap is used by the project PRISMA
Mobile (de Jesus Nascimento da Silva Junior et al.,
2012) and Pinheiro et al. (2008) on mobile devices.
PRISMA Mobile is an android based information vi-
sualization tool for tablets (de Jesus Nascimento da
Silva Junior et al., 2012). It also uses zoom (e.g.
with pinch gesture), filters and details-on-demand.
The tourism information analysis tool for mobile
phones by Pinheiro et al. (2008) is a JavaME based
tool, which shows hierarchical data. In addition to
treemaps the tool uses georeferenced maps and filters.
Paul et al. (2012) implement the visualization type
Overview and Detail in their work. That project im-
plements an Electronic Health Record (EHR), which
shows medical reports and images on small displays
of mobile devices. They use fragmentationalgorithms
to achieve their aim.
There is also some first research about using touch
gestures in data visualization on mobile devices. Baur
et al. (2012) presented TouchWave (touchable stacked
graphs). They wanted to create a visualization, which
has kinetic manipulations and integrated interaction
without complex gestures. Two case studies were im-
VISIGRAPP2015-DoctoralConsortium
26

plemented but no user tests were conducted. Drucker
et al. (2013) compared a non touch-centric WIMP
(window, icon, menus and pointer) interface and a
touch-centric fluid interface on tablet through a user
test with 17 participants. Results show users prefer
the fluid interface. Touch gestures were not the main
focus on that research but the survey shows that touch
interfaces are relevant for tablet users.
Willett et al. (2014) did research about user-
elicited selection gestures on a non-mobile device
(32” multi-touch display). They found a strong pref-
erence for simple one-hand gestures, which is also im-
portant to know for implementing data visualization
for mobile devices.
Regarding research activities with 2S appli-
cations, the 2S is used, for example, for giv-
ing additional information e.g. in the projects
IntoNow (Castillo et al., 2013) and Story Map (Mur-
ray et al., 2012). Story Map includes data visual-
ization. A character map of the current episode is
shown. It is designed as a web app, which runs on
two screens (a large browser-equipped screen and a
smaller handheld device). The devices are time syn-
chronized. So the character map can auto update
the graph of all characters and relationships in real
time. IntoNow (Castillo et al., 2013) uses the mi-
crophone of the Second Screen device to synchronize
with the TV via audio-fingerprinting. If the finger-
print matches with a broadcast in the database, the
application shows the name of the program as well as
links to multiple online services.
Another facet is using the 2S for social interac-
tions. FanFeeds (Basapur et al., 2012) and Bubble-
TV (Huron et al., 2013a) are examples here. FanFeeds
allows authoring and consumption of secondary con-
tent around broadcasts. Users can generate secondary
content for their own social circle. Tests of FanFeeds
show that only a few persons are frequent content cre-
ators. The majority just consume “feed.” Huron et al.
(2013a) used in Bubble TV a live visualization of TV
viewers’ tweets that are integrated as a background
for a French TV show. As a result of that project they
introduced the new design metaphor Visual Sedimen-
tation (Huron et al., 2013b).
Moreover, 2S approaches are often only described
and not tested (Castillo et al., 2013; Murray et al.,
2012). Classical user interface design for non touch
devices follows the eight golden rules of interface de-
sign (Shneiderman and Plaisant, 2010). For designing
visualization there is for example the Visual Informa-
tion Seeking Mantra (Shneiderman, 1996). Addition-
ally there are still no relevant findings for NUIs in
data visualization (Lee et al., 2012). Because of that
guidelines or best practices for interactive data visual-
izations in the context of Second Screen applications
are currently not available (Lee et al., 2012).
4 METHODOLOGY
“Visual representations of objects are often
misinterpreted, either because they do not
match our perceptual system, or they were
intended to be misinterpreted.” (Ward et al.,
2010)
Therefore, visualizations have to be developed and
tested in the context of specific tasks, users, and appli-
cation domains (van Wijk, 2006; Munzner, 2009). To
use visual methods effectively one has to plan profes-
sionally (e.g. with user and task analysis) and eval-
uate empirically (e.g. with usability testing) (Lam
et al., 2012; Miksch and Aigner, 2014).
At the beginning, a desk research will be con-
ducted, which includes extensive literature and web
research. Topics like relevantdata visualization types,
touch gestures, data visualization libraries, and meth-
ods for synchronization will be researched, analysed,
and evaluated to get a detailed state-of-the-art analy-
ses. Evaluation is based on structured criteria.
To implement fully functional prototypes of 2S
applications with interactive data visualization the
study at hand uses the goal-oriented design pro-
cess (Cooper et al., 2007) and experimental prototyp-
ing with user-centered design. It will be an iterative
process. To decide which concrete scenarios will be
developed, possible facets of usage for data visual-
ization in 2S applications will be found as part of re-
search. Two conceivable facets are
• offering additional information, and
• user integration (especially - but not exclusively
- interesting for live broadcast to provide a feed-
back channel).
The actual number of implemented prototypes de-
pends on found facets. Currently three tested proto-
types are expected.
Concepts for visualization and interaction design
will be evaluated based on mock-ups with qualitative
user tests. Mock-ups will be improved by the re-
sults of the user tests and implemented as fully func-
tional prototypes. To improve these prototypes us-
ability tests will be conducted. Used methods will
be eye tracking, audio-visual observation, and semi-
structured interviews (Lazar et al., 2010).
At the end there will be a qualitative acceptance
test to evaluate the prototypes and obtain information
on the additional value of such applications. Ques-
InteractiveMobileDataVisualizationforSecondScreen
27
!"#$%&'!#(""%')**+,#)-,$%./
)0&,$'12%#3($%,4)-,$%
5,)'6%7"(*(,%-,%7
#+,"%-'1"(5"(
#$880%,#)-,$%
9)#:"%&
#+,"%-'1"(5"(
#$880%,#)-,$%
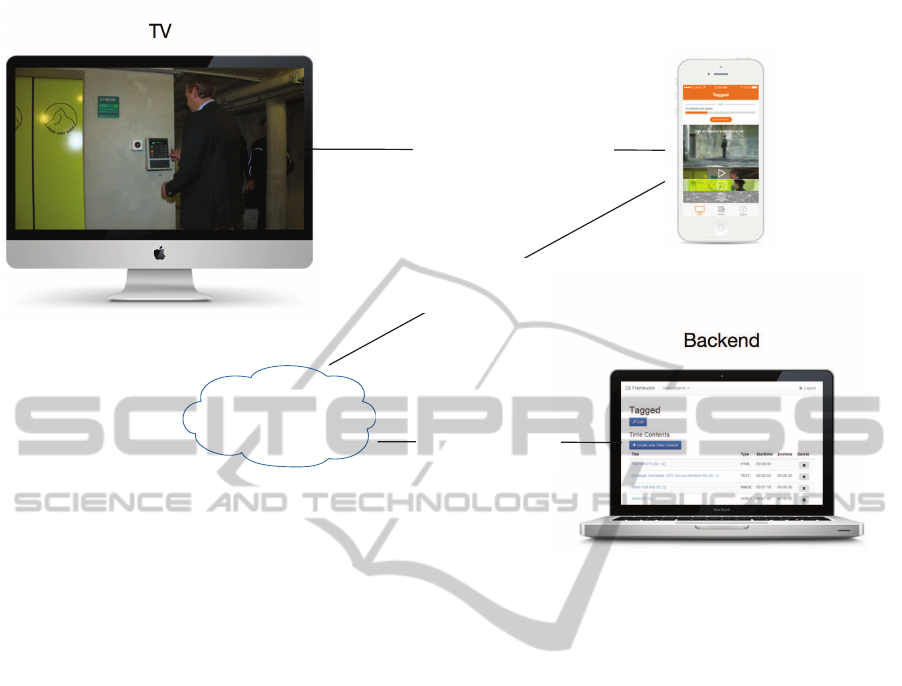
Figure 2: Overview of Second Screen Framework.
tions that need to be answered in that test are for ex-
ample:
• Will the offer be understood, accepted, and used
by the audience?
• How many steps of interaction can users handle
while watching TV without being distracted?
• Will users be too distracted by 2S application?
• Which advantages and disadvantages do 2S ap-
plications have over traditional (unsynchronized)
knowledge sources like Wikipedia or Google?
Tasks like finding the whale population in 2012
suitable for example in scenario 1 (see section 1) will
help to find results for those questions.
Another interesting aspect concerns the prepara-
tory work which is necessary for publishing a 2S ap-
plication with data visualization. A concept will be
developed and tested with experts of that field (e.g.
broadcaster and producer).
5 EXPECTED OUTCOME
By answering the research questions (see section 2)
the complete process of designing and developing in-
teractive data visualization in the context of 2S appli-
cations for mobile touch devices will be investigated.
The systematic processing of existing work will
be documented in detailed state-of-the-art reports for
relevant data visualization types, touch gestures, visu-
alization libraries and frameworks, as well as methods
for synchronization.
Afterwards relevant data visualization types, visu-
alization libraries and frameworks, as well as methods
for synchronization will be evaluated and tested based
on structured criteria. As a result evaluation reports
will be created.
To reach the overall goal, an overviewof facets for
integrating data visualization in 2S application will be
worked out. Building on that overview, concrete sce-
narios and concepts of data visualization for 2S appli-
cations have to be developed.
Furthermore mock-ups and fully functional pro-
totypes of tested data visualization within 2S appli-
cations of three broadcast genres (e.g. politics, sci-
ences, geographic) are expected. In addition to the
development process (see section 4) reports of usabil-
ity tests and an acceptance test will be conducted. In
addition to the report of the acceptance test, which
includes information about advantages and disadvan-
tages of 2S applications over traditional (unsynchro-
nized) knowledgesources like Wikipedia or Google, a
technical comparison of visualization prototypes and
traditional (unsynchronized) knowledge sources will
be conducted and summarized.
VISIGRAPP2015-DoctoralConsortium
28

A concept for preparation process for data visual-
ization in context of 2S scenarios will be created and
tested. As result of a test with expert of that field (e.g.
broadcaster and producer) there will be a report.
Finally a tested framework, which includes all rel-
evant parts of a Second Screen application (e.g. con-
tent creation, synchronization, different types of visu-
alization), and guidelines for designing and develop-
ing mobile data visualization for Second Screen appli-
cations, which are synchronized with the broadcast,
will complete the thesis.
6 STAGE OF THE RESEARCH
Before I started my doctoral studies in computer sci-
ence in January 2014, I had the chance to do research
in a project where we developed an online concept for
a science magazine including a concept for a 2S ap-
plication without focussing on data visualization as a
first step.
In summer 2014 a next step was to develop a
functional prototype for a second screen framework
with basic audio synchronization. Figure 2 shows an
overview of the 2S framework. We developed a back-
end where TV producers and editors can define the
2S content and a 2S application that runs on iOS de-
vices. The synchronisation between smartphone and
TV works with audio fingerprinting.
Currently I work on a detailed state-of-the-art
analysis for mobile interactive data visualization. Lit-
erature will be researched and evaluated based on
structured criteria.
At the moment I also prepare a proposal for get-
ting a research grant for this project together with col-
leagues.
6.1 Next Steps
A next step will be to determine data visualization
types for mobile touch usage. Therefor I have to get
an overview of relevant visualization types and eval-
uate them for mobile touch usage. The selection is
based on the chosen 2S scenarios. In addition a sur-
vey on touch gestures in context of the determined
visualization types is necessary. It is important to
know which gestures can be used with different visu-
alization types on mobile touch devices. To complete
the basic survey on data visualization for mobile de-
vices visualization libraries and frameworks have to
be evaluated whether they can be used for developing
data visualization for mobile touch devices.
ACKNOWLEDGEMENT
Many thanks to Wolfgang Aigner for being my thesis
advisor and supporting me in getting a funding for
this project as well as Grischa Schmiedl for pushing
me in doing my doctoral studies and offering critical
feedback.
REFERENCES
Basapur, S., Mandalia, H., Chaysinh, S., Lee, Y., Venki-
taraman, N., and Metcalf, C. (2012). FANFEEDS:
evaluation of socially generated information feed on
second screen as a TV show companion. In Proceed-
ings of the 10th European conference on Interactive
tv and video, EuroiTV ’12, pages 87–96, New York,
NY, USA. ACM.
Baur, D., Lee, B., and Carpendale, S. (2012). Touch-
Wave: kinetic multi-touch manipulation for hierarchi-
cal stacked graphs. In Proceedings of the 2012 ACM
international conference on Interactive tabletops and
surfaces, page 255. ACM Press.
Castillo, C., De Francisci Morales, G., and Shekhawat, A.
(2013). Online matching of web content to closed cap-
tions in IntoNow. In Proceedings of the 36th interna-
tional ACM SIGIR conference on Research and de-
velopment in information retrieval, SIGIR ’13, pages
1115–1116, New York, NY, USA. ACM.
Chittaro, L. (2006). Visualizing information on mobile de-
vices. Computer, 39(3):40–45.
Cooper, A., Reimann, R., and Cronin, D. (2007). About face
3: the essentials of interaction design. Wiley Pub.,
Indianapolis, IN, 3 edition.
de Jesus Nascimento da Silva Junior, J., Meiguins, B.,
Carneiro, N., Meiguins, A., da Silva Franco, R., and
Soares, A. (2012). PRISMA mobile: An information
visualization tool for tablets. In 2012 16th Interna-
tional Conf. on Information Visualisation (IV), pages
182–187.
Drucker, S. M., Fisher, D., Sadana, R., Herron, J., and
Schraefel, M. (2013). TouchViz: A case study com-
paring two interfaces for data analytics on tablets. In
Proceedings of the SIGCHI Conf. on Human Factors
in Computing Systems, CHI ’13, pages 2301–2310,
New York, NY, USA. ACM.
Elmqvist, N., Moere, A. V., Jetter, H.-C., Cernea, D., Reit-
erer, H., and Jankun-Kelly, T. (2011). Fluid interaction
for information visualization. Information Visualiza-
tion, 10(4):327–340.
Huron, S., Vuillemot, R., and Fekete, J.-D. (2013a).
Bubble-TV: Live visual feedback for social TV broad-
cast. In ACM CHI 2013 Workshop : Exploring and
enhancing the user experience for television.
Huron, S., Vuillemot, R., and Fekete, J.-D. (2013b). Vi-
sual sedimentation. IEEE Transactions on Visualiza-
tion and Computer Graphics, 19(12):2446–2455.
InteractiveMobileDataVisualizationforSecondScreen
29

IDC (2014). Tablets, PCs und Smartphones -
Prognostizierter Absatz bis 2018| Statis-
tik. Retrieved 2014-12-05, from http://de.
statista.com/statistik/daten/studie/183419/umfrage/
prognose-zum-weltweiten-absatz-von-pcs-nach-
kategorie/.
Isenberg, P. and Isenberg, T. (2013). Visualization on inter-
active surfaces: A research overview. I-COM, 12(3).
Kasik, D. J. (2011). The third wave in computer graphics
and interactive techniques. IEEE Computer Graphics
and Applications, 31(4):89–93.
Lam, H., Bertini, E., Isenberg, P., Plaisant, C., and Carpen-
dale, S. (2012). Empirical studies in information vi-
sualization: Seven scenarios. IEEE Transactions on
Visualization and Computer Graphics, 18(9):1520–
1536.
Lazar, J., Feng, J. H., and Hochheiser, H. (2010). Re-
search Methods in Human-Computer Interaction. Wi-
ley, Chichester, West Sussex, U.K, 1 edition edition.
Lee, B., Isenberg, P., Riche, N., and Carpendale, S. (2012).
Beyond mouse and keyboard: Expanding design con-
siderations for information visualization interactions.
IEEE Transactions on Visualization and Computer
Graphics, 18(12):2689–2698.
Micorosft Advertising (2013). Cross-screen engage-
ment. Retrieved 2014-09-20, from http:// advertis-
ing.microsoft.com/international/WWDocs/User/Euro
pe/ResearchLibrary/CaseStudy/Cross
ScreenWhite
paper.pdf.
Miksch, S. and Aigner, W. (2014). A matter of time: Ap-
plying a data-users-tasks design triangle to visual an-
alytics of time-oriented data. Computers & Graphics,
38:286–290.
Munzner, T. (2009). A nested model for visualization de-
sign and validation. IEEE Transactions on Visualiza-
tion and Computer Graphics, 15(6):921–928.
Murray, J., Goldenberg, S., Agarwal, K., Chakravorty, T.,
Cutrell, J., Doris-Down, A., and Kothandaraman, H.
(2012). Story-map: iPad companion for long form
TV narratives. In Proceedings of the 10th European
conference on Interactive tv and video, EuroiTV ’12,
pages 223–226, New York, NY, USA. ACM.
Paul, S., Mukhopadhyay, J., Majumdar, A. K., Majumdar,
B., and Bhattacharya, S. D. (2012). Methodology to
visualize electronic health record for chronic diseases
on small display screens. In Proceedings of the Inter-
national Conf. on Advances in Computing, Communi-
cations and Informatics, ICACCI ’12, pages 505–510,
New York, NY, USA. ACM.
Pike, W. A., Stasko, J., Chang, R., and O’Connell, T. A.
(2009). The science of interaction. Information Visu-
alization, 8(4):263–274.
Pinheiro, S., Meiguins, B., Meiguins, A., and Almeida, L.
(2008). A tourism information analysis tool for mo-
bile devices. In Information Visualisation, 2008. IV
’08. 12th International Conf., pages 264–269, Lon-
don, UK. IEEE.
Reiterer, H. (2010). New forms of human-computer in-
teraction for visualizing information. In Kerren, A.,
Plaisant, C., and Stasko, J. T., editors, Information Vi-
sualization, Dagstuhl Seminar Proceedings, Dagstuhl,
Germany. Schloss Dagstuhl - Leibniz-Zentrum fuer
Informatik, Germany.
SevenOne Media (2013). Der Second Screen
als Verst¨arker. Retrieved 2014-09-20, from
https://wirkstoff.tv/docs/default-source/second
screen verstaerker-pdf.
Shneiderman, B. (1996). The eyes have it: a task by
data type taxonomy for information visualizations. In
IEEE Symposium on Visual Languages, 1996. Pro-
ceedings, pages 336–343, Boulder, CO. IEEE.
Shneiderman, B. and Plaisant, C. (2010). Designing
the User Interface: Strategies for Effective Human-
Computer Interaction. Addison-Wesley Publ. Co.,
Reading, MA, fifth edition edition.
United Internet Media and InteractiveMedia CCP GmbH
(2013). Catch Me If You Can - Grundlagenstudie zur
Multi-Screen-Nutzung. Retrieved 2013-09-30, from
http://www.multi-screen.eu/.
van Wijk, J. (2006). Views on visualization. IEEE
Transactions on Visualization and Computer Graph-
ics, 12(4):421–432.
Wallis, B. (2014). Killer whales - fins of
change. Retrieved 2014-09-23, from
http://www.terramater.at/productions/killer-whales/.
Ward, M., Grinstein, G. G., and Keim, D. (2010). Interac-
tive data visualization: foundations, techniques, and
applications. A K Peters, Natick, Mass.
Wigdor, D., Forlines, C., Baudisch, P., Barnwell, J., and
Shen, C. (2007). Lucid touch: a see-through mobile
device. In 20th annual ACM symposium on User in-
terface software and technology, pages 269–278, New
York, NY, USA. ACM Press.
Willett, W., Lan, Q., and Isenberg, P. (2014). Elicit-
ing multi-touch selection gestures for interactive data
graphics. In EuroVis 2014 - The Eurographics Conf.
on Visualization, Swansea, Wales, UK.
VISIGRAPP2015-DoctoralConsortium
30
