
AHP-based Metric for Tie Strength of Online Friendships
Juliana de Melo Bezerra, Gabriel Chagas Marques and Celso Massaki Hirata
Computer Science Department, ITA, Sao Jose dos Campos, Brazil
Keywords: Tie Strength, Social Network, Friendship Maintenance.
Abstract: Not all friends have the same importance to an individual, and even the importance of a friend can vary over
time. In order to keep friends close, online relational maintenance strategies can be employed. The
knowledge about the tie strength of an online relation can be useful to social, technical or commercial
purposes. In this paper, we define a metric for tie strength in online friendships. We investigate variables
related to friendship maintenance as well as their relative importance. Analytic Hierarchy Process (AHP) is
a decision method used to find the relevance of the selected variables. We conduct experiments that show a
high acceptance of the metric based on assessments of real users.
1 INTRODUCTION
The importance of social relationships is associated
with individual physical and mental well-being,
mainly due to the sense of being secure and
supported (Baumeister and Leary, 1995). There are
different kinds of social relationships, such as
friendship, coworkers, and romantic relations. The
most frequent type of relationship is the friendship
(Argyle, 1987), and it is the focus of this paper. Not
all friendships have the same meaning and impact to
an individual, since it depends on many factors that
in general are difficult to consider. For instance, one
can have close friends, casual friends or mere
acquaintances. Friendships with weak ties can help
in generating ideas or finding jobs (Granovetter,
1973), while friendships with strong ties can offer
emotional support and trust in case of severe
changes or uncertainty (Krackhardt, 1992).
The salience of a friendship can vary over the
life course. In this way, efforts towards friendships’
maintenance are essential to keep their closeness
(Metts et al., 2009). Some maintenance strategies
include keeping in touch, offering emotional
support, and participating in shared activities
(Dindia and Canary, 1993). Communication
technologies have an important role in friendship
maintenance by providing easy and efficient means
of interaction. For instance, Schlovski et al. (2008)
investigate the use of email and telephone in social
relations after a residential move.
Online social networks provide an environment
to rescue old friends and find new ones. They allow
individuals to maintain friendships by using distinct
mechanisms, such as exchange messages, and share
comments, photos, and hobbies. To be able to
predict tie strength in social media is a particular
case of interest. Systems designers can use strength
tie information to explore the link prediction
problem (Krackhardt, 1992), in order to study new
associations between users or how such associations
evolve. Tie strength can be useful to detect security
frauds (Neville et al., 2005), to study answer quality
for questions (Panovich et al., 2012), and to improve
privacy settings (Kauer, 2013). Besides, the
knowledge about tie strength can have commercial
impact. For example, products and services can be
offered to individuals that trust in each other or have
similar preferences, which may be common to close
friends.
Our focus is friendship maintenance, so tie
strength must reveal how a friendship is in a
particular moment. The main motivation is to benefit
users to keep friendship alive, a phenomenon similar
to what occur in offline context (Flanigan, 2005).
So, a user, knowing about a weak friendship tie, can
make movements to change its status by
reestablishing contact with that friend. The usage of
friendship maintenance strategies can vary according
to individuals, for instance in terms of age as young
adults, middle age adults, and older adults (Metts et
al., 2009). The young adulthood is the phase of
interest to this study. We choose Facebook as the
investigated social network.
311
de Melo Bezerra J., Marques G. and Massaki Hirata C..
AHP-based Metric for Tie Strength of Online Friendships.
DOI: 10.5220/0005405003110320
In Proceedings of the 11th International Conference on Web Information Systems and Technologies (WEBIST-2015), pages 311-320
ISBN: 978-989-758-106-9
Copyright
c
2015 SCITEPRESS (Science and Technology Publications, Lda.)

In this paper, we define a metric to quantify tie
strength in online relationships. The metric is
composed by variables related to features that exist
in a social network to support friendship
maintenance. We use Analytic Hierarchy Process
(AHP) as a decision method to find the relevance of
the selected variables in the composition of the
metric. In order to evaluate the proposed metric, we
conduct experiments where users can search friends
and assess information about tie strength.
The paper is organized as follow. In the next
section, we present the background of this work. In
Section 3, we explain the proposed metric of tie
strength in online relations. Later we describe two
experiments used to evaluate our proposal, as well as
their results. In Section 5, we discuss benefits and
limitations of our proposal. In Section 6, we
compare our approach and results with related work.
Conclusions and future work are presented in the
last section.
2 BACKGROUND
In the next section, we present theories about
relationship maintenance. They are useful to reason
about maintenance strategies and later to be able to
identify these strategies in online environments. We
describe the main steps of the decision process
called AHP, which is used during the metric
definition.
2.1 Relationship Maintenance
Flanigan (2005) and Metts et al. (2009) provide
useful discussion about different maintenance
definitions and strategies that exist. They explain
that friendships have distinct functions to individuals
at different stages of life, and there are also
differences in how individuals maintain friendships
(Metts et al., 2009).
Dindia and Canary (1993) use four strategies to
define relational maintenance: continuity, stability,
satisfaction, and repair. Individuals maintain their
relation when they are continuing such relation and
not terminating it. Stability refers to keep particular
dimensions in a stable level, for instance when
individuals have interests or characteristics in
common. Satisfaction concept explains how satisfied
an individual is in keeping a relation. Repair is used
to define relation maintenance as keeping a
relationship in good condition by preventing decay.
Stafford and Canary (1991) propose five
relational maintenance strategies: positivity,
openness, assurances, network, and sharing tasks.
Positivity means being positive and enthusiastic
about a relation. Openness is related to self-
disclosure and being open to discuss a relation.
Assurances include behaviors that show
commitment to a relation. Networking means to
have and keep friends in common. Sharing tasks is
to share activities with your friend or to have
activities in common.
Other theories exist to explain relationship, for
instance Granovetter (1973) identifies four tie
strength dimensions: time, intimacy, intensity, and
reciprocal services. Time, for example, is an
interesting aspect that can represent the amount of
time spent together. Given the range of theories,
there can have some overlap, for instance positivity
(Stafford and Canary, 1991) can be understood as
satisfaction (Dindia and Canary, 1993), or continuity
(Dindia and Canary, 1993) can include time
(Granovetter, 1973) aspects.
2.2 Analytic Hierarchy Process (AHP)
Analytic Hierarchy Process (AHP) is a multi-criteria
decision analysis proposed by Saaty (1991). Based
on mathematics and psychology, it helps the analysis
of complex problems. Given a goal, possible
alternatives, and established criteria, AHP provides
numerical priorities to each alternative. Such
priorities represent the ability of each alternative in
achieving the goal. For example, the goal can be the
purchase of a car; the alternatives are car A, car B,
and car C; and the criteria can include aspects as
price, quality and delivery date.
Here we do not detail the AHP calculations, but
we present the main phases of the analysis:
a) We define the goal of the problem, alternatives
to reach the goal, and criteria to consider in the
analysis.
b) Decision makers indicate the relative
significance of criteria, by comparing them in
pairs. The objective is to find the decision
matrix of criteria. We normalize the matrix and
calculate the priority vector of criteria.
c) Decision makers indicate the relative
significance of alternatives, by comparing them
in pairs considering each criterion separately.
The objective is to find the decision matrix of
alternatives to each criterion. It is necessary to
normalize the matrix. Using it, we calculate the
priority vector of alternatives given a criterion.
d) Composing the priority vectors of alternatives
in a matrix, and multiplying it to the priority
WEBIST2015-11thInternationalConferenceonWebInformationSystemsandTechnologies
312

vector of criteria, we find the priority of each
alternative.
The comparison in pairs is made based on a
scale. Saaty has defined a useful scale using
numerical values and their associated meaning. It
varies from 1 (equal importance) to 9 (extreme
importance), and the reciprocal values. Decision
matrixes are then composed by numbers from 1/9 to
9. An additional step of AHP is to analyze the
consistence of each decision matrix after its
definition. If a matrix contains inconsistent data, the
data have to be revised with decision makers.
3 A TIE STRENGTH METRIC
Given a relation between two friends in a social
network, the metric M indicates how strong the tie
strength is. We have that 0 ≤ M ≤ 1. In terms of
percentage, M varies from 0 to 100%, where 0%
means no friendship maintenance, and 100%
indicates the existence of strong relationship
maintenance.
The proposed metric is basically the sum of
variables v
i
multiplied by their associated weights w
i
,
where 1 ≤ i ≤ N and N represents the quantity of
variables considered to the metric, as follow:
()
=
=
N
i
ii
wvCDFM
1
*)(
(1)
Variables are the aspects in the social network
that represent strategies of relationship maintenance.
Weights inform the relevance of the variables when
composing the metric, so 0 ≤ w
i
≤ 1 and w
i
=1. We
use multi-criteria decision analysis to find the
weights.
A variable can assume any value, for instance a
relation can have 10 friends in common, while other
relation has 100 friends in common. In order to be
able to compare two variables, we use the
cumulative distributed function (CDF) of each
variable, so we have 0 ≤ CDF(v
i
) ≤ 1. Later we
explain how we obtained such function.
Our work focuses on a specific public: the young
adulthood. So, when there was a need to involve real
users, we always selected different young adults,
students of a college, with age varying from 18 to
26.
3.1 Defining Variables
We used the theory about strategies of relationship
maintenance to support the identification of possible
variables in the social network. For instance, ‘time
spent in chat together’ is associated to satisfaction,
whereas ‘number of mutual friends’ is related to
network. Variables can even represent one or more
dimension, for example, ‘number of mutual friends’
can be understood as both stability and network
strategy. In the first brainstorming, we then found 27
variables in Facebook, as follows: number of mutual
friends (v
1
), number of messages exchanged (v
2
),
number of pages in common that the friends liked
(v
3
), number of photos that the friends were tagged
together (v
4
), number of likes made in comments of
a friend (v
5
), if a friend is following the other, time
online in common, number of apps in common,
number of checkins in common, age difference,
number of events in common, number of groups in
common, interests in common, family relationship,
number of links liked in common, number of
blocked pages in common, number of videos in
common, work history in common, religion
difference, politics difference, chat duration, chat
frequency, event frequency, number of posts
together, number of comments in common friend’s
posts, number of comments in common friend’s
photos, and number of comments in common
friend’s videos.
We submitted the list of variables, in a random
order, to the appreciation of ten Facebook users. Our
objective was to identify five relevant variables to
measure the maintenance of a relationship. So, we
have number of variables N equals to 5. The ten
users were invited to participate as they were active
Facebook users. By active users, we mean users that
access the account at least one time a day and have
more than 300 friends. The number of 300 friends is
intentionally greater than the Dunbar’s number.
Dunbar’s number (150) is an upper limit of relations
that a person can maintain in offline social networks
(Hill and Dunbar, 2003). Relations exceeding the
Dunbar's number are considered inactive or mere
acquaintances. So, by selecting the ten users, we
wanted to get the perception from people that
frequently use Facebook and also may experience
the problem of maintaining relations.
As AHP involves the pairwise analysis of
variables to find variables’ weights, we have the
precaution to give to the next users a feasible
evaluation to perform. It is difficult to estimate the
limits of human information processing capacity.
Halford et al. (2005) made experiments breaking
down problems into bite-size chunks to be solved by
academics. The interactions among variables varied
in complexity, considering two up to five variables.
They found a significant decline in accuracy and
AHP-basedMetricforTieStrengthofOnlineFriendships
313
speed of solution when problems got more complex.
Performance on a five-way interaction was at chance
level. They suggest that a structure defined on four
variables is at the limit of human processing
capacity. We decided to follow the directives of
Halford et al. (2005), and we selected only five top
Facebook variables to proceed with AHP.
One important decision was to determine a
period of time as one month to consider time
dependent variables. We then selected the following
variables: number of mutual friends (v
1
); number of
messages exchanged in the last month (v
2
); number
of pages in common that the friends liked in the last
month (v
3
); number of photos that the friends were
tagged together in the last month (v
4
); and number of
likes made in comments of a friend in the last month
(v
5
).
Once we have identified the variables, we need
to assign a standardized value within [0,1] to any
given absolute number of each variable. The
probability of random variable X being lower than a
given absolute number x would fit it perfectly, if we
exclude the zeros. We then decided to use
cumulative distribution function: CDF(x) =
P(X<=x). We need to respect the following limits
and constraints: a) The maximum tie strength (equal
1) should be when all the absolute numbers assume
its maximum value; b) The minimum tie strength
(equal 0) should be when all the absolute numbers
are zero; c) Any other combination of probabilities
should generate a tie strength in ]0,1[. These
directives are described in Eq. 2.
0
,0
0
,()0
()
1
,()1
()
,
i
i
i
i
i
if v
if CDFT v
CDF v
if CDFT v
CDFT v
otherwise
=
<
=
>
(2)
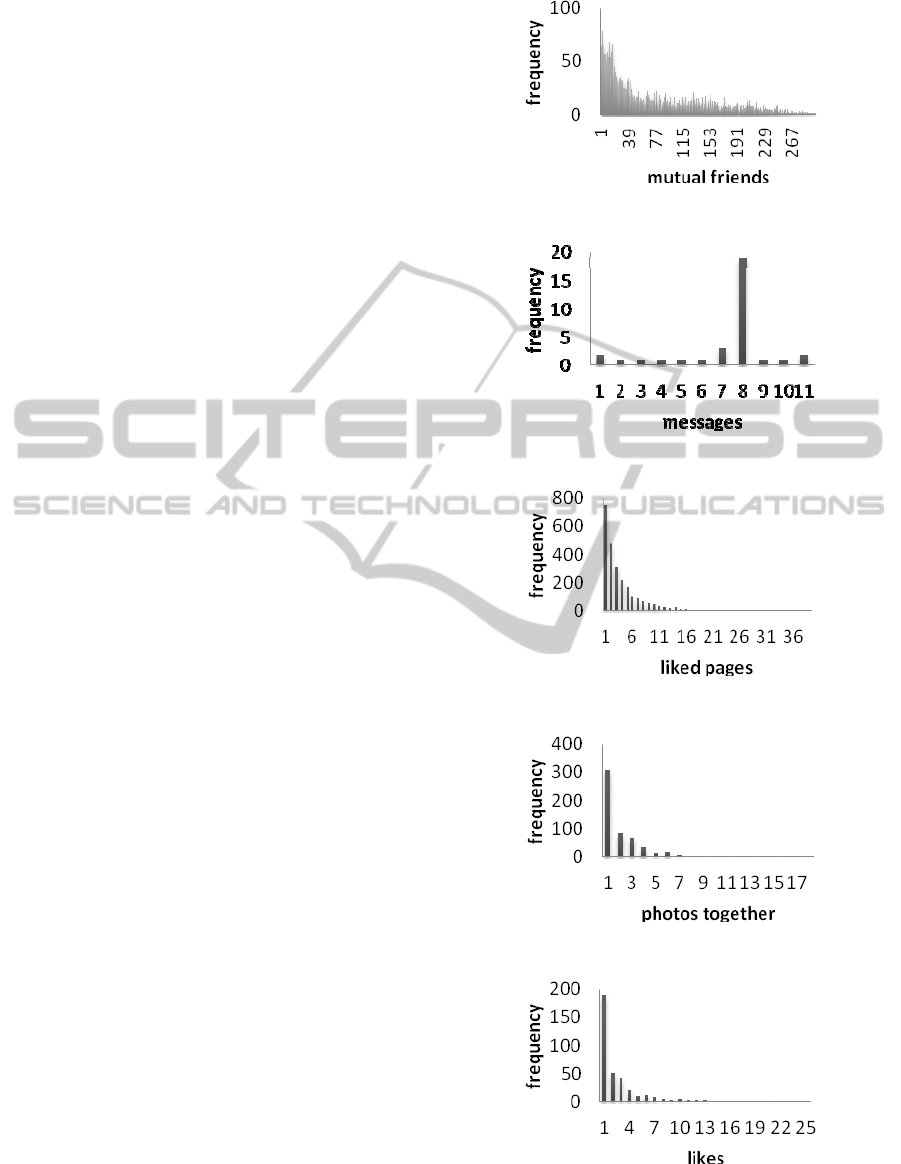
In order to build the CDF of each variable, we
need to retrieve real data. We invited ten Facebook
users and, using an application, we collected v
i
data
of all their connections with friends. The quantity of
connections assessed was 3855. From these
relationships, we were able to collect 7244 nonzero
data points that were used to plot the histograms.
The histograms are shown in Figure 1 to Figure 5.
We also provide the CDF plots of all variables
(Figure 6 to Figure 10).
Figure 1: Histogram of ‘mutual friends’ variable (v
1
).
Figure 2: Histogram of ‘messages’ variable (v
2
).
Figure 3: Histogram of ‘liked pages’ variable (v
3
).
Figure 4: Histogram of ‘photos together’ variable (v
4
).
Figure 5: Histogram of ‘likes’ variable (v
5
).
WEBIST2015-11thInternationalConferenceonWebInformationSystemsandTechnologies
314
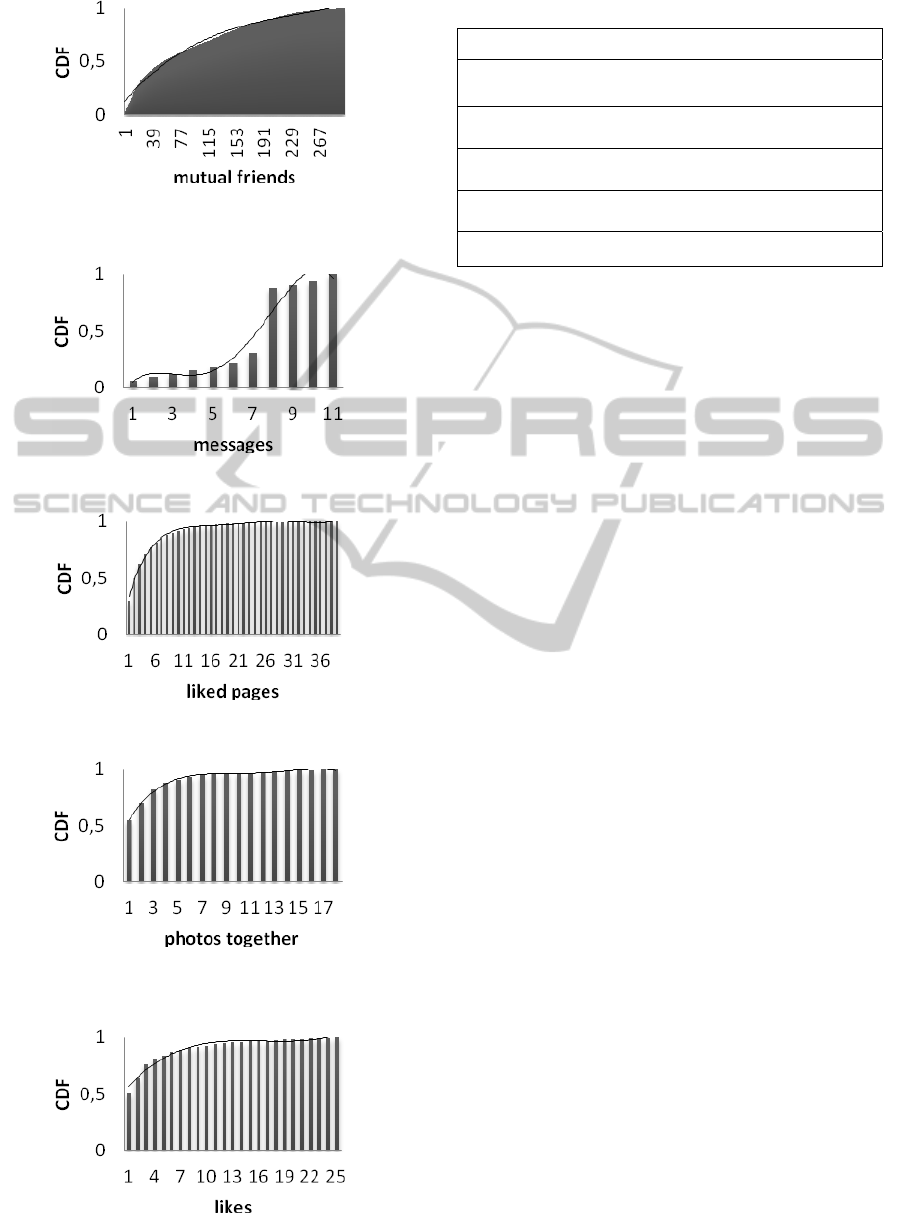
Figure 6: CDF and trendline of ‘mutual friends’ variable
(v
1
).
Figure 7: CDF and trendline of ‘messages’ variable (v
2
).
Figure 8: CDF and trendline of ‘liked pages’ variable (v
3
).
Figure 9: CDF and trendline of ‘photos together’ variable
(v
4
).
Figure 10: CDF and trendline of ‘likes’ variable (v
5
).
Table 1: CDF trendlines of Facebook variables.
CDF Trendline
CDFT(v
1
) = 4E-08 v
1
3
– 3E-05 v
1
2
+ 0.0078 v
1
+
0.1229
CDFT(v
2
) = – 0.0011 v
2
4
+ 0.00242 v
2
3
– 0.1584 v
2
2
+
0.3975 v
2
– 0.213
CDFT(v
3
) = 2E-07 v
3
5
– 2E-05 v
3
4
+ 0.0008 v
3
3
– 0.0182
v
3
2
+ 0.1915 v
3
+ 0.1632
CDFT(v
4
) = – 4E-05 v
4
4
+ 0.0019 v
4
3
– 0.0312 v
4
2
+
0.226 v
4
+ 0.3581
CDFT(v
5
) = 0.0001 v
5
3
– 0.0057 v
5
2
+ 0.0916 v
5
+ 0.4847
Since, not all possible values between 1 and
max(v
i
) were found in the CDF dataset, we decided
to use trendlines. Here, max(v
i
) is the highest value
found to variable v
i
in the collected data. We
calculate the respective trendline of each CDF using
polynomial approximation. The CDF trendlines
(CDFT) are shown in Table 1 and also in Figure 6 to
Figure 10. We checked if the approximation was
satisfactory by calculating the R-squared value. We
found the following R-squared values from v
1
to v
5
:
0.9909, 0.9505, 0.9947, 0.9961, and 0.9622. Our
objective was to achieve R-squared value of at least
0.95 to each trendline, since a trendline is most
reliable when its R-squared value is at or near 1.
3.2 Finding Weights
Analytic Hierarchy Process (AHP) was used to find
the weights w
i
of variables v
i
, as stated to Eq.1. We
followed the steps described in Section 2.2. We
invited 30 Facebook users to act as decision makers
individually.
Our objective was to determine the strength tie in
a relation, so we would like to know the impact
(weights) of variables in the composition of the
metric. So, the AHP alternatives are the variables. It
is very subjective in a social network to define why
individuals use some features or have some
behavior, so we decided to have as criteria the users’
perspectives. The decision matrix of criteria was
filled with ones and later normalized. The priority
vector of criteria was then defined.
We elaborated a questionnaire to ask how
important a variable is compared to others. As we
have 5 variables, the questionnaire was composed by
10 questions in the form of “How important is v
i
compared to v
j
”. We use the directive of Saaty scale
to define answers’ options. The answer could
assume the following values: extreme importance
(9), very strong importance (7), strong importance
(5), moderate importance (3), equal importance (1),
moderately less importance (1/3), strongly less
AHP-basedMetricforTieStrengthofOnlineFriendships
315

important (1/5), very strongly less important (1/7),
and extremely less important (1/9).
Each questionnaire was used to build a decision
matrix of variables. The main diagonal is filled with
one, meaning that one variable has the same
importance when compared to itself. The
questionnaire answers were the entries above the
main diagonal, while their reciprocals were the
entries below the main diagonal. As example, a
matrix driven from one questionnaire is shown in
Table 2.
Table 2: Example of decision matrix of variables.
v
1
v
2
v
3
v
4
v
5
v
1
1 1 1/7 1 1
v
2
1 1 1 1 1
v
3
7 1 1 1/3 3
v
4
1 1 3 1 1
v
5
1 1 1/3 1 1
We repeated the same procedure of building
matrix+ with each questionnaire. We analyzed
consistence of all matrixes, normalized them, and
calculated the related priority vector. We then use
these vectors to calculate the weights. Table 3 shows
the weights, already normalized, of Facebook
variables. We observe that ‘photos in common’ (v
4
)
is the most significant parameter of a friendship,
since it means that friends were together. The next
more important variable is ‘number of messages’
(v
2
), meaning that friends are keeping in touch.
Table 3: Weights of Facebook variables.
Variable (v
i
)
Weight (w
i
)
v
1
: number of mutual friends 0.121
v
2
: number of messages exchanged in the
last month
0.290
v
3
: number of pages in common that the
friends liked in the last month
0.105
v
4
: number of photos that the friends were
tagged together in the last month;
0.332
v
5
: number of likes made in comments of
a friend in the last month.
0.152
Using Eq.1, Eq. 2 and the results shown in Table
1 and Table 3, it is possible to calculate the tie
strength of a Facebook friendship since you have the
variables’ values that represent such relation.
4 EVALUATING THE TIE
STRENGTH METRIC
We planned two experiments to evaluate the
proposed metric. We invited 30 Facebook users,
different from those that participated during the
metric definition. In both experiments, applications
were developed to shown information related to the
metric. Applications to capture Facebook
information have to deal with users’ permissions.
So, before using the application, users had to accept
that their private data will be used for the study. The
applications also capture users’ answer of an
evaluation question and their feedback to support the
results’ analysis.
In the first experiment, we built an application
where a user can search a friend and see the tie
strength value of his friendship. In this situation, the
user can analyze if the proposed metric is
satisfactory. The user should evaluate the
affirmative “I agree with the result” using the
following 5-Likert scale: strongly agree, agree,
neutral, disagree, and strongly disagree. The total of
assessed relations was 96. The result was: 20%
strongly agree, 21% agree, 56% neutral, 0%
disagree, and 3% strongly disagree. The metric was
considered correct in 41% of the cases. Neutral
responses were, in general, users that could not
judge if the metric value was adequate in absolute
terms. We then conducted the second experiment to
analyze the metric in relative terms.
In the second experiment, we developed other
application, where a user can search two friends.
The application calculates the metric of both
relations, and it returns the name of the friend with
higher metric. So, users can evaluate the metric in
relative terms. Users answered the same question as
in the first experiment. The amount of evaluated
cases was 86. The result was: 35% strongly agree,
40% agree, 9% neutral, 5% disagree, and 12%
strongly disagree. The result was considered correct
in 75% of the cases. We observed that neutral
responses dropped abruptly. According to users, it is
easier to evaluate only the comparison instead of
reasoning about the metric value itself.
Using users’ feedback, we were able to
understand the existence of disagreements with the
result driven from the metric in the second
experiment. One user said that one of the assessed
friends was his brother in fact, and the result should
have shown higher tie strength to his brother. We
understand that the proposed metric correctly shows
the maintenance level of the friendship and not the
nature of that relation. Other user commented one
case of disagreement, explaining that he always
encounters his friend. It is a common misleading to
evaluate a friendship using online tie when friends
have strong offline interaction, however, we argue
WEBIST2015-11thInternationalConferenceonWebInformationSystemsandTechnologies
316

that the metric focuses on the strength of the online
relation only.
A user reported that the application showed a
higher tie with a friend, but he considers that both
friends have the same importance, since the unique
difference was to have only one more friend in
common. It raises an interesting aspect about what
we investigate in further comparative evaluations:
the definition of a range to consider friendships as
similar. Other case of disagreement was commented
by a user who considers ‘likes’ (v
5
) are more
important than ‘friends in common’ (v
1
). The metric
uses the opposite, as show in Table 3. The metric
was defined with solid foundation considering the
opinion of distinct users. This user has a different
impression, and we believe that it constitutes an
outlier.
5 DISCUSSIONS
The proposed metric of tie strength was proposed
considering Facebook as social network and the
young adult as public. Different public can have
different relational maintenance strategies; therefore
they can use social network features in a different
way. It can impact both trendline functions (Table 1)
and weights (Table 3). The selected five variables
are general and can be found in other social
networks. The process using AHP to define the
metric was described, and it can be repeated in
further investigations that consider changes in social
network or public.
Metric variables are time dependent. Variable v
1
regarding ‘mutual friends’ can change since
individuals connect to others in a dynamic way by
reconfiguring the network. The other variables (v
2
to
v
4
) have an explicit time range, in this case, a month.
Time dependency is what makes the metric able to
represent changes in relations. For example, an
individual can interact more with a friend in a
period, strengthening their relation. Later he can stay
without contact, representing the absence of
strategies to maintain the relation, so the tie strength
reduces.
Different periods for data collection can be
investigated to define the variables. We conjecture
that long periods are not recommended since the
metric may lose its momentum. Another issue is the
effort to collect data. The bottleneck step is to
capture the variables’ value of a given relation. For
instance, the variable v
4
about ‘number of photos in
common’ requires an examination of each photo
posted by a user. In this way, the application that
uses the metric could not provide the metric value in
a feasible time, which in turn generates usability
issues.
We conducted a preliminary evaluation of the
metric. A positive aspect was the online processing
of relations’ data. Two applications were built and
used by real users, demonstrating the feasibility of
the metric calculation. In the first experiment with
absolute values of the metric, we found that it can be
interesting to define labels to values, for instance
‘low’ and ‘high’. It can facilitate users’ judgment of
the metric result. Other possibility is to remove
‘neutral’ option as answer, letting users to respond
only positively or negatively, which is known as
‘forced choice’ method.
In the second experiment, we observed a major
approval of the results, confirming that the metric
was useful to compare tie strength of two
friendships. According to users’ feedback, one
possible enhancement is the definition of a range to
consider friends with the same importance. In both
experiments, we argue that a higher testing sample
could be beneficial to the evaluation. Other
experiments can be designed considering not the
friends chosen by users, but friends selected
randomly. Using this approach, we can even conduct
the evaluation of friendships with high and low tie
strength separately.
6 RELATED WORK
Previous research has proposed different solutions to
reason about tie strength in online social networks.
Xiang et al. (2010) propose a model to infer
relationship strength from interaction activity (e.g.,
communication, tagging) and user similarity (e.g.
common friends). Other important works are those
proposed by Gilbert and Karahalios (2009),
Arnaboldi et al. (2013), and Jones et al. (2013).
Below we discuss these articles and compare their
approach and results with ours.
Gilbert and Karahalios (2009) investigate if
social media data is able to predict tie strength of
general relationships, in order to classify a
relationship as weak or strong. They study the
influence of the following dimensions (described
here already in order of importance): intimacy,
intensity, duration, social distance, services,
emotional support, and structural. They use 32
variables distributed in these dimensions, for
instance: days since last communication (intimacy
dimension), wall words exchanged (intensity
dimension), days since first communication
AHP-basedMetricforTieStrengthofOnlineFriendships
317

(duration dimension), educational difference (social
distance dimension), applications in common
(services dimension), inbox positive words
(emotional support dimension), and number of
mutual friends (structural dimension). In order to
build the prediction model, they considered data
from the entire relationship, for example “wall
words exchanged” variable counts every message
since the relationship initiated in the social media.
They used linear regression to determine the
variables weights, and they added an extra term to
the equation to take into account the network
structure.
In our approach, we are interested in the online
maintenance of relationships. We would like to
know how a relation is in a given moment: if it is
active or not. One possible benefit is to help people
in keeping friendships alive. The background about
relationship maintenance strategies helped us to
identify potential variables to compose the tie
strength metric. The maintenance strategies include,
for instance, continuity, time, stability, and
satisfaction. The maintenance strategies were used to
investigate 27 Facebook features that are used to
maintain friendships. Identified variables can
represent one or more maintenance strategy, for
example, “number of mutual friends” can be
understood as both stability and network strategy.
We submitted the variables, in a random order, to
the appreciation of ten users, aiming to know which
ones are more relevant to measure the maintenance
of a relationship. The result was variables v
1
to v
5
(see Table 3). For time dependent variables (v
2
to
v
5
), we determine a period of one month, in order to
be able to capture a view of the relationship
maintenance.
The selected variables are present in other social
networks, which makes our approach feasible to be
replicated in other environments. Gilbert and
Karahalios (2009) use variables as “wall intimacy
words”, which need content analysis, so that they
focus on English language. In our approach, the
selected variables do not rely on content analysis, so
that it is possible to compare relations of a person
with two friends using distinct idioms. While Gilbert
and Karahalios (2009) consider data during the
entire relation, we specify a period of analysis. They
retrieved all data and processed offline to calculate
the dimensions’ power. We did offline processing
only to define our variables and weights, but later
we use the metric in online experiments with real
users. The experiments give confidence to the
proposed metric, and they show that the metric was
calculated in a feasible time: users selected friends,
they waited the metric result and later they evaluated
the result.
The focus of our paper is not just to find a metric
to define tie strength, but also to provide an
interpretation to how to maintain online friendships.
Mathematically, linear regression and other types of
regression make sense but they do not provide as
much meaning to the equation they generate.
Basically, the only meaning we can get from the
equation is that it provides the best fit to the test data
set. The key point is that regressions require the
subjective evaluation on the result, i.e. users are
asked to evaluate their relationship with other users
and based on that the regression is calculated. On the
other hand, our approach brings the subjective
evaluation to the weights. The AHP allows us to
bring meaning right away to what is important to
users of social networks. If we find that w
i
= 3*w
j
, it
literally means that most of people believe that v
i
is
more important to define an online friendship than
v
j
.
Arnaboldi et al. (2013) use the same background
as us, which includes the four tie strength
dimensions (time, intimacy, intensity, and reciprocal
services) proposed by Granovetter (1973). In fact,
we complement our background with the dimensions
suggested by Stafford and Canary (1991) and Dindia
and Canary (1993). Arnaboldi et al. (2013) work
with 11 quantitative relational variables. We initiate
our investigation with 27 variables, which include
the 11 variables used by Arnaboldi et al. (2013),
except from “number of days since first
communication” and “number of days since last
communication”. Variables driven from user-filled
fields (such as “educational difference”) were not
considered by Arnaboldi et al. (2013) since the
information depends on cultural aspects and can
even not be provided by users. Instead of eliminate
variables at the beginning, we decided to submit the
27 variables to the appreciation of users, in order to
make them reason about the variables’ importance.
Five quantitative variables were selected, as follows:
v
1
to v
5
(see Table 3). The variable v
1
was not used
by Arnaboldi et al. (2013), however it is presented in
other important works, such as Gilbert and
Karahalios (2009) and Xiang et al. (2010).
Arnaboldi et al. (2013) compare different models
to predict tie strength, including models with
uncorrelated variables and with correlated ones.
They retrieved data from relations of 28 users, who
also evaluated the strength of friendships (using a
scale between 0 and 100). In our work, we asked
users to evaluate the provided tie strength values in
the first experiment, and we observed that it is a
WEBIST2015-11thInternationalConferenceonWebInformationSystemsandTechnologies
318

difficult task when using absolute values. So, we
perform other experiment informing only the result
of comparison between the tie strength values of two
friends. Arnaboldi et al. (2013) found a good
performance of a 4-variables model, which includes:
“number of days since last communication”,
“bidirectional frequency of contact”, “number of
days since first communication”, and “frequency of
incoming communication”. It is interesting to
observe that these variables are related to
technological-mediated communication in general,
and not exclusively to social networks. In our
metric, variables v
1
, v
3
, v
4
and v
5
are typical of social
networks. Arnaboldi et al. (2013) reported an
accuracy of approximately 80%. It is close to our
result of 75%, although we are confident that this
number can increase if more experiments are
conducted. One similarity between our work and the
one by Arnaboldi et al. (2013) is that both respect
the sociological background that considers tie
strength as a linear combination of social factors.
Other similarity is that the resulted models are
composed by few variables, and consequently few
data about relations, which make the more suitable
to be used online in services and applications that
explore tie strength prediction.
Jones et al. (2013) investigate how to define if a
Facebook user is a closest friend or a non-closest
friend. They use classification methods, including
logistic regression, SVM (support vector machines)
and random forests. Our approach is different since
we propose a tie strength metric, which makes
possible to estimate the intensity of a relation
between two users. Regarding the used variables,
Jones et al. (2013) selected variables among
Facebook features, as they say, by hypothesizing
those ones that would be diagnostic in categorizing
dyads as closest-friends versus non-closest-friends.
They consider both demographic variables (such as
same gender and age difference) and interaction
variables (such as comments, likes and photo tags).
We rely on the background about relationships'
maintenance strategies, whose dimensions lead us to
27 variables. Considering users’ feedback, we
selected variables v
1
to v
5
(see Table 3). Jones et al.
(2013) found that demographic variables contribute
little to the prediction model, since the frequency of
online interaction was diagnostic of strong ties. It
corroborates with our approach, which has four
interaction variables (v
2
to v
5
). We also consider a
network variable (v
1
), which is cited as relevant in
other works, such as Gilbert and Karahalios (2009)
and Xiang et al. (2010). Considering the results,
Jones et al. (2013) reported 82% of accuracy when
using logistic regression model to classify a friend as
a closest-friend or not. We achieved 75% of
accuracy by comparing the tie strength values of two
relations in an experiment with real users. As the
works have different goals, it is not appropriate to
compare these results directly, but it may give an
indication about the works’ potential.
7 CONCLUSIONS
We proposed a metric to quantify the tie strength of
friendships in an online social network. We worked
with a public of young adults in Facebook. Using the
background about strategies of relational
maintenance, we identified the metric variables,
which are driven from features provided by the
social network. The following variables were
selected: mutual friends, exchanged messages, pages
in common, photos together, and likes. The relative
importance of variables in the metric composition
was defined based on users’ perspective retrieved
using the Analytic Hierarchy Process (AHP).
Our preliminary evaluation showed that the
metric was useful in detecting the closest friend
when comparing the tie strength of two friendships.
Users considered that 75% of the cases were
satisfactory. It is an interesting result that shows the
potential of the metric. Other evaluations need to be
conducted with more users testing more relations, in
a way to increase sample sizes. Other experiments
can consider different ways to capture users’
perception about the metric, for instance to present a
label associated to the metric value, to select friends
randomly, and to evaluate tie strength indirectly by
testing friends’ influence. New applications can also
be designed to capture users’ intention to rescue
important friendships that are presenting weak ties.
Further investigations can be performed in
Facebook with other public or even in other social
networks. As the metric variables are related to
features very common in social networks, they can
be used without changes. Other variables can also be
selected. Differences are expected to be presented in
the data distribution as well as in the variables’
weight, due to existence of distinct behaviors when
changing people and environment.
REFERENCES
Argyle, M., 1987. The psychology of happiness. London:
Methuen.
Arnaboldi, V., Guazzini, A. and Passarella, A., 2013.
AHP-basedMetricforTieStrengthofOnlineFriendships
319

Egocentric online social networks: Analysis of key
features and prediction of tie strength in Facebook. In
Computer Communications, 36:10-11, pp. 1130-1144.
Baumeister, R.F. and Leary, M.R., 1995. The Need to
Belong: Desire for Interpersonal Attachments as a
Fundamental Human Motivation. In Psychological
Bulletin, 117:3, pp. 497-529.
Dindia, K. and Canary, D.J., 1993. Definitions and
theoretical perspectives on maintaining relationships.
In Journal of Social and Personal Relationships, 10,
pp. 163-173.
Flanigan, N.N., 2005. Keeping Friendships Alive: Self-
monitoring and Maintenance Strategies. In UNF
Theses and Dissertations. Paper 168.
Gilbert, E. and Karahalios, K., 2009. Predicting Tie
Strength With Social Media. In Proceedings of the
SIGCHI Conference on Human Factors in Computing
Systems (CHI ’09), pp. 211-220.
Granovetter, M. S., 1973. The Strength of Weak Ties. In
The American Journal of Sociology, 78:6, pp. 1360-
1380.
Halford, G.S., Baker, R., McCredden, J.E. and Bain, J.D,
2005. How many variables can humans process? In
Psychological Science, 16:1, pp.70-6.
Hill, R.A. and Dunbar, R.I.M., 2003. Social network size
in humans. In Human Nature, 14, pp. 53-72.
Jones, J.J., Settle, J.E., Bond, R. M., Fariss, C.J., Marlow,
C. and Fowler, J.H., 2013. Inferring Tie Strength from
Online Directed Behavior. In PLoS ONE, 8:1.
Krackhardt, D., 1992. The Strength of Strong Ties: The
Importance of Philos in Organizations. In Nohria N.
and Eccles R., Networks and Organizations: Structure,
Form, and Action. Boston, MA: Harvard Business
School Press, pp. 216-239.
Kauer, M., 2013. Improving Privacy Settings for
Facebook by Using Interpersonal Distance as
Criterion. In Proceedings of the SIGCHI Conference
on Human Factors in Computing Systems (CHI ’13),
pp. 793-798.
Metts, S., Beverly, A. and Asbury, B., 2009. A
Comparison of Maintenance Strategies in the
Friendships of Young Adults, Middle Age Adults, and
Older Adults. In Proceedings of The NCA 95th Annual
Convention, Chicago Hilton & Towers, Chicago, IL.
Neville, J. et al., 2005. Using relational knowledge
discovery to prevent securities fraud. In Proceedings
of the International Conference on Knowledge
Discovery in Data Mining (KDD ’05), pp. 449-458.
Panovich, K. Miller, R., Karger, D., 2012. Tie Strength in
Question & Answer on Social Network Sites. In
Proceedings of the Conference on Computer
Supported Cooperative Work (CSCW ’12), pp. 1057-
1066.
Saaty, T.L., 1991. Multicriteria Decision Making: The
Analytic Hierarchy Process. RWS Publications.
Shklovski, I., Kraut, R. and Cummings, J., 2008. Keeping
in Touch by Technology: Maintaining Friendships
after a Residential Move. In Proceedings of the
SIGCHI Conference on Human Factors in Computing
Systems (CHI’08), pp. 807-816.
Stafford, L. and Canary, D.J., 1991. Maintenance
strategies and romantic relationship type, gender, and
relational characteristics. In Journal of Social &
Personal Relationships, 8, pp. 217-242.
Xiang, R., Neville, J. and Rogati, M., 2010. Modeling
Relationship Strength in Online Social Networks. In
Proceeding of the International World Wide Web
Conference (WWW ’10), pp. 981-990.
WEBIST2015-11thInternationalConferenceonWebInformationSystemsandTechnologies
320
